]www.lps.ens.fr/recherche/biophysique-ADN
Torque determination on DNA with magnetic tweezers
Abstract
We deduced the torque applied on a single stretched and twisted DNA by integrating with respect to force the change in the molecule’s extension as it is coiled. While consistent with previous direct measurements of the torque at high forces (pN) this method, which is simple and does not require a sophisticated set-up, allows for lower force estimates. We used this approach to deduce the effective torsional modulus of DNA, which decreases with force and to estimate the buckling torque of DNA as a function of force in various salt conditions.
pacs:
87.14.gk,87.15.La,87.80.Ek,87.80.Fe,87.80.Nj,82.37.Rs,82.35.LrMost polymers are insensitive to torsion because their monomers are linked by single covalent bonds around which they are free to rotate. This property is lost when the polymer possesses no single covalent bond about which to release the accumulated torsion. Such is the case of a DNA molecule with no nicks (no break in one of the strands), thanks to is double-helical structure. This particular feature has very important biological implications. First, from a structural point of view, twisted DNA provides an efficient way to compact the molecule so that it fits into the cell or nucleus. Second, a negatively twisted (underwound) DNA may locally denature thus facilitating the accessibility of its bases to a variety of proteins (RNA polymerasesRevyakin et al. (2004), regulation factorsLia et al. (2003), etc.). On the other hand, positively coiled DNA is more stable at high temperature (it denatures less). Thus thermophilic bacteria that live close to the boiling point of water have enzymes (reverse gyrases) that overwind the molecule. Because the topology of DNA plays such an essential role in the cell life, Nature has evolved a family of enzymes, generally known as topoisomerasesStrick et al. (2000); Koster et al. (2005); Taneja et al. (2007)(the just mentioned reverse gyraseCozzarelli (1980) is one of them) that control the torsion and entanglement of the molecules. Enzymes that translocate DNA (such as FtsKSaleh et al. (2005),EcoR124ISeidel et al. (2008), RSCLia et al. (2006)) can also apply a torque on the molecule as it is moved along. Thus understanding the behaviour of DNA under torsion and estimating the torque arising in a twisted molecule has important biological implications.
Single molecule manipulation experimentsStrick et al. (2000); Koster et al. (2005); Taneja et al. (2007); Bryant et al. (2003); Saleh et al. (2005); Seidel et al. (2008); Lia et al. (2006) offer a means to stretch and twist DNA. In these experiments, a DNA molecule is anchored at multiple points (to impede its swiveling) to a surface at one end and to a bead used to apply a force and a torque at the other. In the case of magnetic traps, a superparamagnetic bead is pulled by the field generated by small magnets and twisting is achieved by rotating the magnetic fieldStrick et al. (1996); Gosse and Croquette (2002). With this method the angular position of the bead is imposed and one does not control the applied torque. This set-up was nonetheless used to measure the twist-stretch coupling in a DNA molecule via the rotational drag of a small bead attached to the backbone and allowed to swivel to relax the accumulated torsionGore et al. (2006). More recently, optical tweezersWang et al. (1997) have been used to apply a constant torque on an anisotropic transparent particle through the angular momentum transfer of a polarized laser beamDeufel et al. (2007) that also traps the particle. The advantage of the optical tweezers set-up is that it allows for a direct measurement of the torque applied on the trapped particle (and through it on the DNA). Its drawback is that it involves a rather sophisticated set-up which is difficult to use to explore the low force (below 1pN) regime that might be more relevant to biological processes.
In this paper we describe a simple method to estimate the torque applied on DNA by measuring the change in extension of a stretched and coiled molecule as a function of force and number of turns. The magnetic trap system, briefly sketched above and employed extensively in previous experiments Strick et al. (1996); Stone et al. (2003); Bancaud et al. (2006); Dawid et al. (2006), is used to apply a force on a magnetic bead tethered by a single DNA to a surface and also, by rotating the magnets, to twist the molecule by a known number of turns, . The results of such experiments are qualitatively easy to understand on the basis of our daily experience with coiling tubes or cords. Consider twisting by turns a rubber tube of torsional modulus (usually normalized by in the DNA context: ) held under an applied force . Initially the torque will increase linearly with : , leaving the extension almost unchanged. Past a certain number of turns , the associated torque becomes so large that it is energetically less costly for the tube to bend rather than to increase its torsional energy: the tube buckles and loops to form a 3D structure called plectoneme, that absorbs torsion as writhe. Further twisting of the tube, while leaving the torque unchanged, results in formation of ever longer plectonemes. Very similar results are observed (see below and Fig.1) when coiling a DNA molecule: while its extension varies little for small it decreases linearly past a certain threshold. As recently suggested Zhang and Marko (2008), from these observations one can deduce the torque applied on the molecule. Indeed the free energy of a twisted and stretched molecule depends on the force and the rotational angle, . The mean extension of the molecule at a given force is: and the mean torque is: . One thus readily derives an expression for the mean torque at a given force from a measurement of the decrease in extension with increased coiling :
| (1) |
Since the angular rotation is known and the force and change in extension with rotation are easily measurable, the determination of the torque difference is reduced to a problem of sampling these variables finely enough to estimate the above integral with sufficient precision. The integration constant is set by the requirement that there is no torque on an untwisted molecule: (neglecting the small twist-stretch coupling modulus of DNALionnet et al. (2006); Gore et al. (2006)).
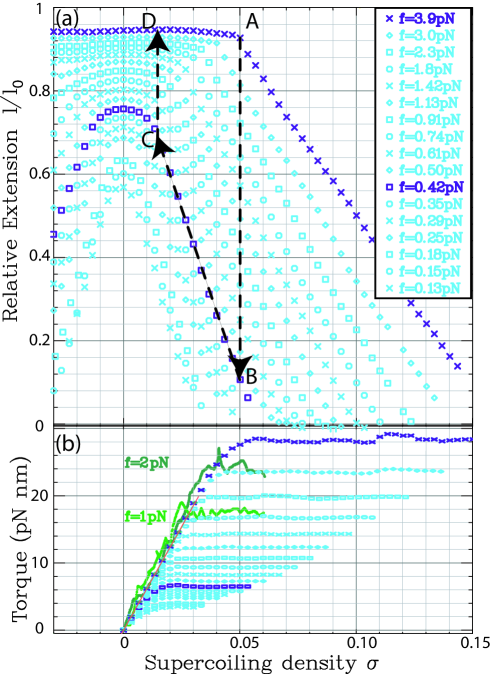
We measured the DNA extension (of total length m) in various salt conditions and for different values of force and degree of supercoiling (the linking number is the number of times the two strands of the molecule wrap around each other), see Fig.1. Such measurements have been described before Strick et al. (1996, 1998). Briefly at low forces ( less than about 0.4pN) the curves are symmetric. The extension is maximal at and decreases non-linearly for small values of due to twist fluctuations Moroz and Nelson (1998); Bouchiat et al. (1999). Past the buckling threshold (at ), the molecule coils on itself with a constant slope () to form plectonemes or supercoils. As explained above, while below buckling (i.e. when ) the torque increases with increased rotation, it is constant in the plectonemic regime Marko (2007) (i.e. when ). For larger forces ( pN) the curve becomes asymmetric as for negative supercoilings DNA denatures before buckling at a critical torque: pN nm Strick et al. (1999a); Bryant et al. (2003). For this reason we have computed the torque only for positive degrees of supercoiling, although this estimate should also be valid at low forces ( pN) for negative supercoilings.
To compute the torque at various forces and degrees of supercoiling using Eq.1, we start from the highest stretching force ( pN in the series shown in fig.1(a)) and the highest torque state investigated, namely point A at the buckling transition () in Fig.1(a). The value of torque in A (which served as our reference point) is initially unknown but will be fixed by the requirement that . We then compute the torque at point D ( for which ), by first integrating Eq.1 along path AB (a path of constant but varying force, see Fig.1(a)) from to . Taking into account the fact that the torques at points C and B are equal ), we then calculate the torque difference along the path CD from force to force along a path of constant and subtract it from the torque difference along path AB. This procedure is of course valid only if both points B and C are in the plectonemic regime. This in effect restricts that procedure to values of , where we can identify correctly the buckling transition. To evaluate the torque at smaller values, we notice that the values of as a function of at high forces grow linearly with . We extrapolate the values of for one of these curves down to (requiring ). It does not matter which curve is used: the intercept with the ordinate at varies by less than 1 pN nm. We then use these extrapolated values to infer from the numerical integration of Eq.1 the values of the torque at other forces and values of . The results are shown in Fig.1(b). Various methods to evaluate the derivative have been used and found to yield very similar results (a Savitzky-GolayPress et al. (1994) five points second order smoothing method was usually preferred as it is less affected by noise due to discrete sampling). The results obtained here are similar, see Fig.1(b) to the results reported on a different DNA molecule using optical tweezers as a means to measure the torque (the slightly different values of the buckling torques might be due to differences in the DNA sequences or to different ionic conditions).
From the data in Fig.1(a,b) we can deduce the effective tension and torque on a bare plasmid (circular DNA) unwound by (as often found in NatureMcClellan et al. (1990)). The tension is determined by the value of force at which the DNA’s extension is zero at , i.e. pNCharvin et al. (2004) (the line passing through the points BC (at pN) crosses the abscissa at ). The buckling torque at this force is obtained from Fig.1(b): pN nm . This value is close to the value where DNA denatures at negative supercoilings. This may explain the variable sensitivity of gene expression to sequence and degree of supercoilingRevyakin et al. (2004); Droge (1994).
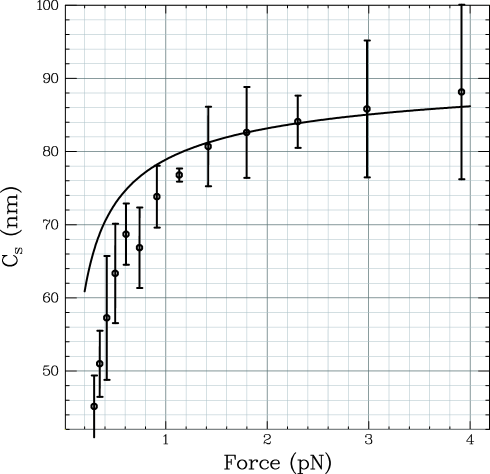
The slope of the torque vs. supercoiling curves at low values of (see Fig.1(b)) yields , i.e. the effective torsional stiffness of DNA. As shown in Fig.2 decreases with the force acting on the molecule which may explain the low values of torsional stiffness initially reported in bulk measurementsSelvin et al. (1992). This was anticipated by Moroz and NelsonMoroz and Nelson (1997) who ascribed this variation to a renormalisation of the bare torsional stiffness by torsional fluctuations (that become more important at low forces). Their estimate of this effect ( obtained by a perturbation expansion at high forces) is shown in Fig.2. It allows to deduce a value of nm, in agreement with previous estimatesStrick et al. (1999b); Bryant et al. (2003); Forth et al. (2008).
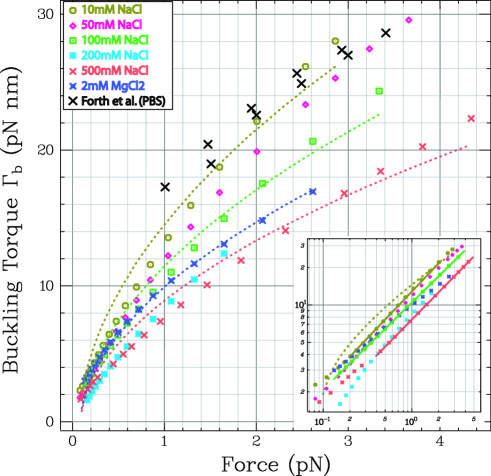
While the value of the DNA bare torsional modulus does not seem to vary much with salt, the buckling torque of DNA appears to be much affected by the ionic concentration, increasing by as much as a factor 2 at low salt concentrations, see Fig.3. The buckling torque increases also with the forceCharvin et al. (2004) with an approximate power law dependence . Although the precise values of the buckling torque for DNA may depend slightly on sequence (for example AT tracks are known to form bends that may buckle more easily) one expects the general dependence of with force and salt to be sequence independent for long enough DNA’s. Clauvelin et al. Clauvelin et al. (2008) obtain the buckling torque from the experimental slopes of the torque vs. supercoiling curves using an analytically solvable model of plectonemic DNA. The values of buckling torque obtained with their method are very close to the values reported in Fig. 3.
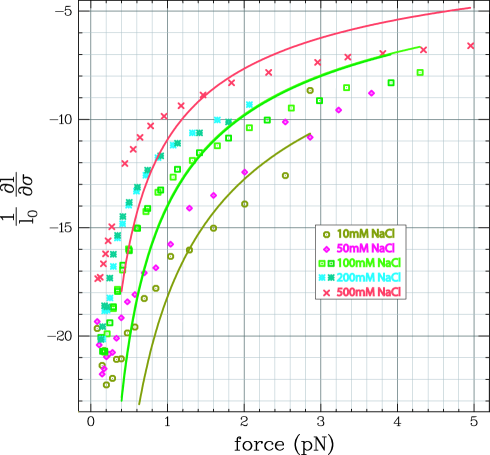
J.Marko Marko (2007) has recently suggested a heuristic model to describe the behavior of a stretched DNA molecule under twist. In his model, DNA molecules in the plectonemic regime partition between an unstretched plectonemic supercoil phase with torsional stiffness and a stretched and twisted DNA molecule with persistence length and effective torsional stiffness . This model is characterized by only three parameters: the DNA persistence length nm, its bare torsional stiffness nm and an unknown plectonemic torsional stiffness , estimated to be about 26 nm. The model makes a number of predictions on the variation of extension with and the variation of with that can be compared with experiments. While the predictions of Marko’s model are in qualitative agreement with our observations (see for example the variation of with force in Fig.3), the model cannot explain all the data with only three fit parameters (actually only one , since can be independently obtained from force-extension measurements, and can be deduced as explained from Fig.2). In particular as can be seen in Fig.4, the predictions of the model for the variation of as a function of force does not quantitatively fit the data. In some sense this is not very surprising since a description of the plectonemic phase with a single force independent torsional stiffness is an oversimplification that does not take into account for example the variation of plectonemic radius with force due to entropic repulsion Marko and Siggia (1994).
Acknowledgements.
We would like to thank J. Marko, Z.Bryant and M.Wang for useful discussions and correspondence. This work has been supported by grants from CNRS, the ANR and the EU (BioNano-Switch).References
- Revyakin et al. (2004) A. Revyakin, R. H. Ebright, and T. R. Strick, Proc.Nat.Acad.Sci. (USA) 101, 4776 (2004).
- Lia et al. (2003) G. Lia, D. Bensimon, V. Croquette, J. Allemand, D. Dunlap, D. Lewis, S. Adhya, and L. Finzi, Proc. Natl. Acad. Sci. (USA) 100, 11373 (2003).
- Strick et al. (2000) T. Strick, V. Croquette, and D. Bensimon, Nature 404, 901 (2000).
- Koster et al. (2005) D. A. Koster, V. Croquette, C. Dekker, S. Shuman, and N. H. Dekker, Nature 434, 671 (2005).
- Taneja et al. (2007) B. Taneja, B. Schnurr, A. Slesarev, J. F. Marko, and A. Mondragon, Proc.Nat.Acad.Sci.(USA) 434, 14670 (2007).
- Cozzarelli (1980) N. Cozzarelli, Science 207, 953 (1980).
- Saleh et al. (2005) O. A. Saleh, S. Bigot, F.-X. Barre, and J.-F. Allemand, Nat Struct Mol Biol 12, 436 (2005).
- Seidel et al. (2008) R. Seidel, J. G. P. Bloom, C. Dekker, and M. D. Szczelkun, EMBO J. 27, 1388 (2008).
- Lia et al. (2006) G. Lia, E. Praly, H. Ferreira, C. Stockdale, Y. C. Tse-Dinh, D. Dunlap, V. Croquette, D. Bensimon, and T. Owen-Hughes, Mol.Cell 21, 417 (2006).
- Bryant et al. (2003) Z. Bryant, M. D. Stone, J. Gore, S. B. Smith, N. R. Cozzarelli, and C. Bustamante, Nature 424, 338 (2003).
- Strick et al. (1996) T. R. Strick, J. F. Allemand, D. Bensimon, A. Bensimon, and V. Croquette, Science 271, 1835 (1996).
- Gosse and Croquette (2002) C. Gosse and V. Croquette, Biophys. J. 82, 3314 (2002).
- Gore et al. (2006) J. Gore, Z. Bryant, M. Nöllmann, M. U. Le, N. R. Cozzarelli, and C. Bustamante, Nature 442, 836 (2006).
- Wang et al. (1997) M. Wang, H. Yin, R. Landick, J. Gelles, and S. Block, Biophys. J. 72, 1335 (1997).
- Deufel et al. (2007) C. Deufel, S. Forth, C. R. Simmons, S. Dejgosha, and M. D. Wang, Nat.Meth. 4, 223 (2007).
- Stone et al. (2003) M. D. Stone, Z. Bryant, N. J. Crisona, S. B. Smith, A. Vologodskii, C. Bustamante, and N. R. Cozzarelli, Proc.Nat.Acad.Sci. (USA) 100, 8654 (2003).
- Bancaud et al. (2006) A. Bancaud, N. C. de Silva, M. Barbi, G. Wagner, J.-F. Allemand, J. Mozziconacci, C. Lavelle, V. Croquette, J.-M. Victor, A. Prunell, et al., Nat.Struct.Mol.Biol. 13, 444 (2006).
- Dawid et al. (2006) A. Dawid, F. Guillemot, C. Breme, V. Croquette, and F. Heslot, Phys.Rev.Lett. 96, 188102 (2006).
- Zhang and Marko (2008) H. Zhang and J. F. Marko, Phys.Rev.E 77, 031916 (2008).
- Lionnet et al. (2006) T. Lionnet, S. Joubaud, R. Lavery, D. Bensimon, and V. Croquette, Phys.Rev.Lett. 96, 178102 (2006).
- Forth et al. (2008) S. Forth, C. Deufel, M. Y. Sheinin, B. Daniels, J. P. Sethna, and M. D. Wang, Phys.Rev.Lett. 100, 148301 (2008).
- Strick et al. (1998) T. R. Strick, J. F. Allemand, D. Bensimon, and V. Croquette, Biophys. J. 74, 2016 (1998).
- Moroz and Nelson (1998) J. Moroz and P. Nelson, Macromolecules 31, 6333 (1998).
- Bouchiat et al. (1999) C. Bouchiat, M. D. Wang, J. F. Allemand, T. Strick, S. M. Block, and V. Croquette, Biophys. J. 76, 409 (1999).
- Marko (2007) J. F. Marko, Phys.Rev. E 76, 021926 (2007).
- Strick et al. (1999a) T. Strick, D. Bensimon, and V. Croquette, Genetica 106, 57 (1999a).
- Press et al. (1994) W. Press, S. Teukolsky, W. Vetterling, and B. Flannery, Numerical Recipes in C (Cambridge Univ., 1994).
- McClellan et al. (1990) J. McClellan, P. Boublikova, E. Palecek, and D. Lilley, Proc.Nat.Acad.Sci. (USA) 87, 8373 (1990).
- Charvin et al. (2004) G. Charvin, J. Allemand, T. Strick, D. Bensimon, and V. Croquette, Contemp.Phys. 45, 383 (2004).
- Droge (1994) P. Droge, Bioessays 16, 91 (1994).
- Moroz and Nelson (1997) J. D. Moroz and P. Nelson, Proc.Nat.Acad.Sci. (USA) 94, 14418 (1997).
- Selvin et al. (1992) P. Selvin, D. Cook, N. Pon, W. Bauer, M. Klein, and J. Hearst, Science 255, 82 (1992).
- Strick et al. (1999b) T. R. Strick, D. Bensimon, and V. Croquette, Genetica 106, 57 (1999b).
- Clauvelin et al. (2008) N. Clauvelin, B. Audoly, and S. Neukirch, Macromolecules 41, 4479 (2008).
- Marko and Siggia (1994) J. F. Marko and E. D. Siggia, Science 265, 506 (1994).