Imaging the Molecular Gas in a =3.9 Quasar Host Galaxy at
0.3′′ Resolution:
A Central, sub-kiloparsec Scale Star Formation Reservoir in
APM 08279+5255
Abstract
We have mapped the molecular gas content in the host galaxy of the strongly lensed high redshift quasar APM 08279+5255 () with the Very Large Array at 0.3′′ resolution. The CO(=10) emission is clearly resolved in our maps. The CO(=10) line luminosity derived from these maps is in good agreement with a previous single-dish measurement. In contrast to previous interferometer-based studies, we find that the full molecular gas reservoir is situated in two compact peaks separated by 0.4′′. Our observations reveal, for the first time, that the emission from cold molecular gas is virtually cospatial with the optical/near-infrared continuum emission of the central AGN in this source. This striking similarity in morphology indicates that the molecular gas is situated in a compact region close to the AGN. Based on the high resolution CO maps, we present a revised model for the gravitational lensing in this system, which indicates that the molecular gas emission is magnified by only a factor of 4 (in contrast to previously suggested factors of 100). This model suggests that the CO is situated in a circumnuclear disk of 550 pc radius that is possibly seen at an inclination of 25∘, i.e., relatively close to face-on. From the CO luminosity, we derive a molecular gas mass of =1.31011 M⊙ for this galaxy. From the CO structure and linewidth, we derive a dynamical mass of sin=4.01010 M⊙. Based on a revised mass estimate for the central black hole of =2.31010 M⊙ and the results of our molecular line study, we find that the mass of the stellar bulge of APM 08279+5255 falls short of the local – relationship of nearby galaxies by more than an order of magnitude, lending support to recent suggestions that this relation may evolve with cosmic time and/or change toward the high mass end.
Subject headings:
galaxies: active — galaxies: starburst — galaxies: formation — galaxies: high-redshift — cosmology: observations — radio lines: galaxies1. Introduction
Several different populations of distant galaxies have been detected to date, out to a (spectroscopically confirmed) redshift of =7.0 (see Ellis 2007 for a review). It is of fundamental importance to study such young galaxies in great detail in order to constrain their nuclear, stellar, and gaseous constituents and their physical properties and chemical abundances. Understanding these different characteristics of high redshift galaxy populations and their progression through cosmic times is vital to develop a unified picture of galaxy formation and evolution. One key aspect in these high- galaxy studies are sensitive, high-resolution radio observations of the molecular gas phase, i.e., the raw material that fuels star formation.
Since its initial discovery at 2 more than a decade ago (Brown & Vanden Bout 1991; Solomon et al. 1992), observations of spectral line emission from interstellar molecular gas in distant galaxies have revolutionized our understanding of some of the most luminous objects that populate the early universe. This is due to the fact that the physical state of the molecular interstellar medium (ISM) plays a critical role in the evolution of a galaxy. The total amount of molecular gas in a galaxy determines for how long starburst activity can be maintained, while its temperature and density are a direct measure for the conditions under which star formation can occur (see Solomon & Vanden Bout 2005 for a review). Also, there is growing evidence that the observed relationships between black hole mass and galaxy bulge velocity dispersion (–; Ferrarese & Merritt 2000; Gebhardt et al. 2000), black hole mass and host bulge concentration (i.e., Sersic index; Graham et al. 2001; Graham & Driver 2007), and, ultimately, black hole mass and bulge mass (–; Magorrian et al. 1998; Häring & Rix 2004), may be a consequence of an active galactic nucleus (AGN) feedback mechanism acting on its surrounding material, at least in the most luminous systems (Silk & Rees 1998; Di Matteo et al. 2005). Such an AGN-driven wind will also interact with the molecular gas, the material which will eventually form the stellar bulges and disks in galaxies at high redshift, but also feed the active nucleus itself. Observations of the dynamical structure and distribution of molecular gas in distant galaxies may even reveal the initial cause of event (e.g., mergers) for both star formation and AGN activity, an important test for recent cosmological models (e.g., Springel et al. 2005; Narayanan et al. 2006).
The flux magnification provided by gravitational lensing has been facilitated in studies of high redshift molecular gas emission since early on, leading to the detection of a number of quasar host galaxies (e.g., Barvainis et al. 1994; Downes et al. 1999) and submillimeter galaxies (SMGs; e.g., Frayer et al. 1998; Greve et al. 2005), but also substantially fainter populations such as Lyman-break galaxies (LBGs; Baker et al. 2004; Coppin et al. 2007). Also, some sources have large enough lens image separations to show structure even at only moderate angular resolution (Sheth et al. 2004; Kneib et al. 2005).
High angular resolution observations of molecular gas in high- galaxies are, to date, exclusively obtained in the rotational transitions of carbon monoxide (CO). In the past few years, a number of SMGs (Genzel et al. 2003; Downes & Solomon 2003; Tacconi et al. 2006) and quasars (Alloin et al. 1997) at 2 have been studied at a linear resolution of up to 5 kpc at the target redshifts (1 kpc=0.12′′ at =2). In some cases, gravitational lensing aids in zooming in further on these systems. However, the only telescope that currently allows to attain resolutions of sub-kpc to 1 kpc scale at even higher redshifts (4, where 1 kpc0.14′′) is the NRAO’s Very Large Array (VLA)111The Very Large Array is a facility of the National Radio Astronomy Observatory, operated by Associated Universities, Inc., under a cooperative agreement with the National Science Foundation.. First sub-arcsecond resolution CO imaging with the VLA has been obtained toward the distant quasars BR 1202-0725 (=4.69; Carilli et al. 2002), APM 08279+5255 (=3.91; Lewis et al. 2002a), PSS J2322+1944 (=4.12; Carilli et al. 2003; Riechers et al. 2008a), SDSS J1148+5251 (=6.42; Walter et al. 2004), and BRI 1335-0417 (=4.41; Riechers et al. 2008b).
We here report on new, more sensitive high-resolution observations of CO(=10) emission towards the strongly lensed quasar APM 08279+5255 (). APM 08279+5255 was already222Due to the source’s enormous optical brightness, much older images may exist. imaged during the Palomar Sky Survey (PSS) in 1953, a decade before the discovery of the first quasar was reported in the literature (Schmidt 1963). About 45 years later, it was ‘officially’ discovered in an automatic plate measuring facility (APM) survey for distant cool carbon stars, and identified as a 15th magnitude, radio-quiet broad absorption line (BAL) quasar with an IRAS Faint Source Catalog (FSC) counterpart at a redshift of =3.87 (Irwin et al. 1998). APM 08279+5255 was found to have an unprecedented apparent bolometric luminosity of =71015 L⊙, about 20% of which is emitted in the (far-)infrared (Lewis et al. 1998). This extreme value was found early on to be due to strong gravitational lensing (Irwin et al. 1998), producing three close (maximum separation 0.4′′), almost collinear images in the optical/near-infrared (Ibata et al. 1999; Egami et al. 2000). Due to the lack of a detection of the lensing galaxy, and an indication for significant microlensing effects, the true nature of the gravitational lens configuration (and thus the magnification factor ) in this system remains subject to debate (e.g., Egami et al. 2000; Lewis et al. 2002a) despite the fact that APM 08279+5255 is one of the best-studied sources in the distant universe. In addition to its enormous continuum brightness at basically every astronomically relevant wavelength, APM 08279+5255 is also one of the brightest CO sources at high redshift (Downes et al. 1999). It also exhibits unusually bright HCN (Wagg et al. 2005) and HCO+ (Garcia-Burillo et al. 2006) emission, and was recently also detected in C I (Wagg et al. 2006) emission. The properties of its molecular gas content have recently been modeled based on observations of the CO(=10) up to CO(=1110) rotational ladder (‘CO spectral line energy distribution’, or SLED) with the NRAO Green Bank Telescope (GBT)333The Green Bank Telescope is a facility of the National Radio Astronomy Observatory, operated by Associated Universities, Inc., under a cooperative agreement with the National Science Foundation. and the IRAM 30 m telescope (Riechers et al. 2006; Weiß et al. 2007). We use a standard concordance cosmology throughout, with km s-1 Mpc-1, , and (Spergel et al. 2003, 2007).
2. Observations
We here report new, sensitive high-resolution observations of the CO(=10) emission line in APM 08279+5255. To better constrain the molecular gas properties in this source, we also re-derive the strength of the CO(=21) emission line, based on more sensitive (unpublished archival) observations than reported previously (Papadopoulos et al. 2001). In this context, we also present a search for the CN(=10) emission line in this galaxy, a tracer of the dense fraction of the molecular gas phase (see Riechers et al. 2006 for more details on this data). To further investigate the AGN and starburst environments in this source, we augment our analysis of the molecular gas properties with a study of the radio continuum properties, based in part on archival observations. A fraction of the archival continuum data was used in previous studies of this source (Ibata et al. 1999; Ivison 2006; see Tab. 2 for details).
VLA observations summary.
| Date | Config. | Duration | Band | Type | Ref. |
|---|---|---|---|---|---|
| 2005 Apr 07 | B | 6.75 h | K | CO(=10) | 1 |
| 2005 Apr 08 | B | 6.0 h | K | CO(=10) | 1 |
| 2005 Apr 09 | B | 5.25 h | K | CO(=10) | 1 |
| 2005 Apr 10 | B | 6.0 h | K | CO(=10) | 1 |
| 2005 Apr 18 | B | 7.5 h | K | CO(=10) | 1 |
| 2005 May 01 | B | 4.0 h | C | Continuum | 1 |
| 2005 Sep 12 | C | 8.25 h | K | CO(=10) | 1 |
| 2005 Sep 20 | C | 7.5 h | K | CO(=10) | 1 |
| 2005 Dec 02 | D | 4.0 h | K | CO(=10) | 1 |
| 1998 Jun 18 | BnA | 3.0 h | X | Continuum | 2 |
| 1998 Jul 28 | B | 2.5 h | X | Continuum | 1 |
| 2.0 h | U | Continuum | 1 | ||
| 1998 Aug 11 | B | 3.0 h | X | Continuum | 1 |
| 3.5 h | U | Continuum | 1 | ||
| 2000 Apr 24 | C | 13.0 h | Q | CO(=21) | 3 |
| 2000 Sep 16 | D | 4.0 h | Q | CO(=21) | 1 |
| 2001 Jan 21 | A | 2.25 h | L | Continuum | 4 |
| 2001 Oct 20 | D | 9.0 h | Q | CO(=21) | 1 |
Note. — Maximum baselines of VLA configurations are: A - 36.4 km, B - 11.4 km, C - 3.4 km, D - 1.03 km. BnA is a hybrid configuration where the antennas on the east and west arms of the array are in the shorter of the two denoted configurations, and the north arm is in the more extended configuration.
2.1. VLA Data
2.1.1 CO(=10) and 23.5 GHz continuum [new]
We observed the CO(=10) transition line (GHz) towards APM 08279+5255 using the VLA in B, C, and D configuration between 2005 April 07 and 2005 December 02. At the target redshift of 3.911, the line is redshifted to 23.472 GHz (12.77 mm, K band). The total on-sky integration time amounts to 51.25 hr (see Tab. 2 for details). Observations were performed in fast-switching mode (see, e.g., Carilli & Holdaway 1999) using the nearby source 08248+55527 for secondary amplitude and phase calibration. Observations were carried out under excellent weather conditions with 25 antennas. The phase stability in all runs was excellent (typically 15∘ for the longest baselines). The phase coherence was determined by imaging the calibrator source 08087+49506 with the same calibration cycle as that used for the target source, and found to be high during all runs. For primary flux calibration, 3C 286 was observed during each run.
Two 25 MHz intermediate frequencies (IFs) with seven 3.125 MHz channels each were observed in ‘spectral line’ mode centered at the CO(=10) line frequency, leading to an effective bandwidth of 43.75 MHz (corresponding to 558 km s-1 at 23.5 GHz; ‘ON’ channels). Two 50 MHz (corresponding to 638 km s-1 at 23.5 GHz) IFs were observed in continuum mode at 23.3649 GHz and 23.5649 GHz (100 MHz offset from the line frequency) to measure the source’s continuum at 12.8 mm (‘OFF’ channels). The continuum was observed for one third of the total time to attain the same rms as in the combined line channels.
For data reduction and analysis, the 444www.aoc.nrao.edu/aips/ package was used. The two continuum channels were concatenated in the uv/visibility plane. The CO(=10) line image was generated by subtracting a CLEAN component model of the continuum emission from the visibility data. All data were mapped using the CLEAN algorithm. The velocity-integrated maps shown in Fig. 1 are imaged using robust 1 weighting and combining B and C array data, leading to a synthesized clean beam size of 0.30 ′′0.29 ′′ in the CO(=10) line map and 0.32 ′′0.29 ′′ in the continuum map (note that D array data were omitted in these maps to improve the size of the synthesized beam). The final rms over the full bandwidth of 43.75 MHz (558 km s-1) in the CO(=10) map is 16 Jy beam-1, and the rms over the 100 MHz continuum bandpass is 13 Jy beam-1. In Fig. 2, four velocity channel maps (9.375 MHz, or 120 km s-1 each) of the central 37.5 MHz (480 km s-1) of the CO(=10) line are shown. To maximize the sensitivity in individual channels the data were imaged using natural weighting and combining B and C array data, achieving a resolution of 0.34 ′′0.33 ′′. Hanning smoothing was applied to the image cube, resulting in an rms of 27 Jy beam-1 per channel. The velocity-integrated CO(=10) and 23.5 GHz continuum maps of the combined B, C and D array data shown in Fig. 3 and Fig. 4, top right, are imaged using natural weighting and a Gaussian taper, leading to synthesized beams of 1.19 ′′1.14 ′′ and 1.19 ′′1.10 ′′, and an rms of 19 Jy beam-1 for both maps.
2.1.2 CO(=21) [archival]
Spectral line observations of the CO(=21) transition line (GHz) towards APM 08279+5255 were carried out between 2000 Apr 24 and 2001 Oct 20 using the VLA in C and D configuration. The C array data was published by Papadopoulos et al. (2001). We here re-analyze this data, and add in shorter (unpublished) D array spacings to improve the sensitivity of the data. At the target redshift of 3.911, the CO(=21) line is redshifted to 46.943 GHz (6.39 mm, Q band). The total on-sky integration time amounts to 26 hr (see Tab. 2 for details). Observations were performed in fast-switching mode using the nearby source 08248+55527 for secondary amplitude and phase calibration. Observations were carried out under excellent weather conditions with up to 27 antennas. For primary flux calibration, 3C 48 and 3C 286 were observed. Observations were set up in quasi-continuum mode; two 50 MHz IFs were observed simultaneously at 46.9149 GHz and 46.9649 GHz to cover the central 640 km s-1 of the spectral line.
Data were mapped using the CLEAN algorithm at natural weighting; this results in a synthesized beam of 1.11 ′′0.93 ′′ and an rms of 65 Jy beam-1 (no map shown here).
| Transition/Frequency | Configuration | |
|---|---|---|
| [Jy] | ||
| CO(=10) | 28527aaPeak flux from Gaussian fitting to the unsmoothed 14 channel spectrum. | BCD |
| CO(=21) | 163765bbNot corrected for the estimated 46.9 GHz continuum contribution. | CD |
| CN(=10) | 195 | [GBT] |
| 1.4 GHz | 116033 | A |
| 4.5 GHz | 55140 | B |
| 8.4 GHz | 44620 | BnA/B |
| 14.9 GHz | 30393ccTentative detection. | B |
| 23.5 GHz | 37619 | BCD |
| 46.9 GHz (estimated)ddEstimated based on the FIR-to-radio SED. The lower limit is given by the model of the FIR-only part of the continuum, and the upper limit is estimated by linear interpolation (in the log–log plane) of the 23 GHz and 94 GHz continuum measurements. | 405 | — |
Note. — Fluxes are derived from convolved maps for all datasets with linear resolutions higher than 1.2′′, and agree with those derived from Gaussian fitting to the unconvolved data within 10%.
2.1.3 1.4 GHz continuum [archival]
Continuum observations at 1.400 GHz (L band) towards APM 08279+5255 were carried out on 2001 Jan 21 using the VLA in A configuration. This data was recently published by Ivison (2006; no map shown). The total on-sky integration time amounts to 2.25 hr (see Tab. 2 for details). Observations were performed in spectral line mode using the nearby source 0824+558 for secondary amplitude and phase calibration. Observations were set up using two IFs and seven 3.125 MHz channels per IF, leading to an effective bandwidth of 43.75 MHz (corresponding to 9400 km s-1 at 1.4 GHz). Observations were carried out under good weather conditions with 27 antennas. For primary flux calibration, 3C 48 was observed.
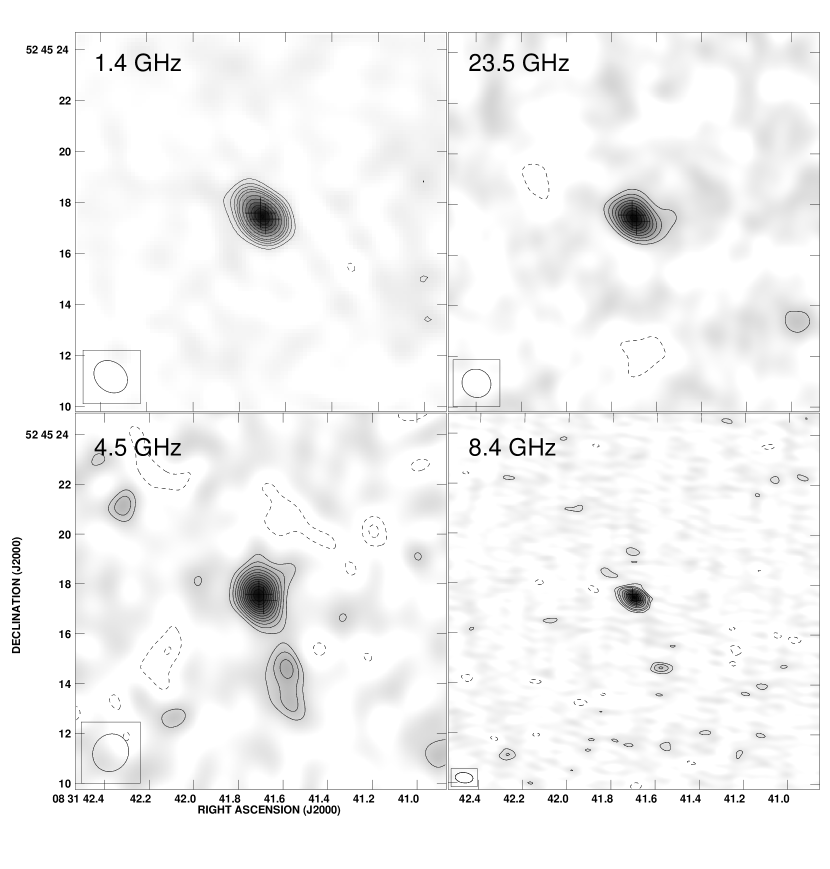
Data were mapped using the CLEAN algorithm at robust 0 weighting; this results in a synthesized beam of 1.42 ′′1.15 ′′ and an rms of 33 Jy beam-1 (see Fig. 4, top left).
2.1.4 4.5 GHz continuum [new]
Continuum observations at 4.5276 GHz (C band) towards APM 08279+5255 were carried out on 2005 May 01 using the VLA in B configuration. The total on-sky integration time amounts to 4 hr (see Tab. 2 for details). Observations were performed in spectral line mode using the nearby source 08248+55527 for secondary amplitude and phase calibration. Observations at 4.5276 GHz were set up using thirty-one 390.625 kHz channels, leading to an effective bandwidth of 12.109375 MHz (corresponding to 802 km s-1 at 4.5276 GHz). Observations were carried out under excellent weather conditions with 25 antennas. The phase stability in this run was excellent. For primary flux calibration, 3C 286 was observed during each run.
Data were mapped using the CLEAN algorithm at natural weighting; this results in a synthesized beam of 1.55 ′′1.42 ′′ and an rms of 40 Jy beam-1 (see Fig. 4, bottom left).
2.1.5 8.4 GHz continuum [archival]
Continuum observations at 8.4 GHz (X band) towards APM 08279+5255 were carried out between 1998 Jun 18 and Aug 11 using the VLA in BnA and B configuration. The BnA array data was published by Ibata et al. (1999). We here re-analyze this data, and add in shorter B array spacings to improve the sensitivity and image quality of the data. The total on-sky integration time amounts to 8.5 hr (see Tab. 2 for details). Observations were performed in quasi-continuum mode (two 50 MHz IFs were observed simultaneously at 8.4351 GHz and 8.4851 GHz) using the nearby sources 0749+540 and 0820+560 for secondary amplitude and phase calibration. Observations were carried out under good weather conditions with 27 antennas. For primary flux calibration, 3C 48 and 3C 147 were observed.
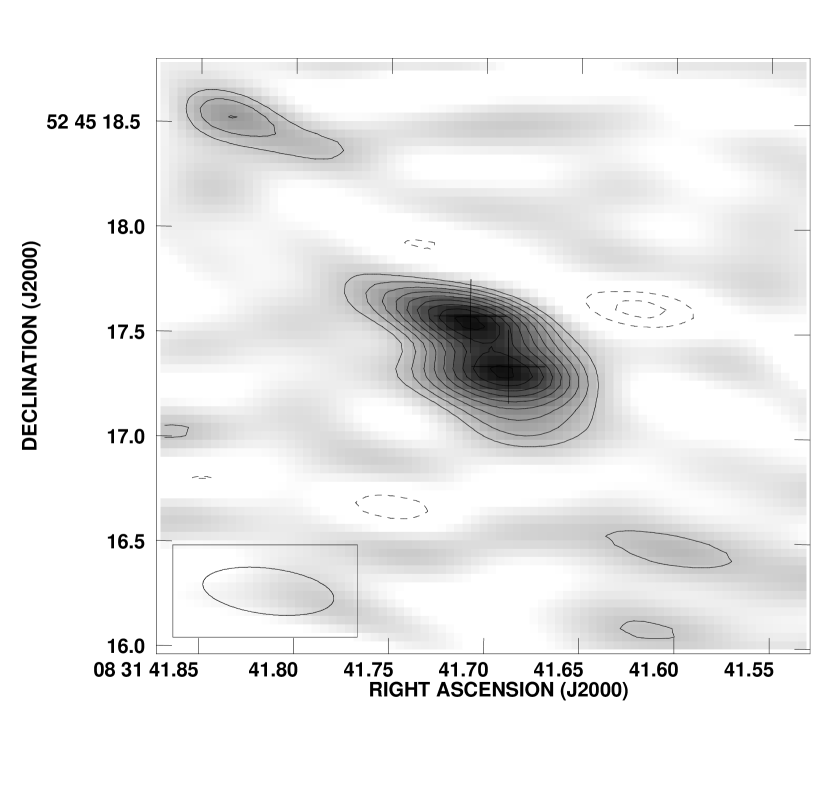
Data were mapped using the CLEAN algorithm. Imaging the data with natural weighting results in a synthesized beam of 0.73 ′′0.42 ′′ and an rms of 10 Jy beam-1 (see Fig. 4, bottom right). Imaging the data with uniform weighting results in a synthesized beam of 0.63 ′′0.22 ′′ and an rms of 20 Jy beam-1 (see Fig. 5).
2.1.6 14.9 GHz continuum [archival]
Continuum observations at 14.9 GHz (U band) towards APM 08279+5255 were carried out on 1998 Jul 28 and Aug 11 using the VLA in B configuration. The total on-sky integration time amounts to 5.5 hr (see Tab. 2 for details). Observations were performed in quasi-continuum mode (two 50 MHz IFs were observed simultaneously at 14.9149 GHz and 14.9649 GHz) using the nearby source 0749+540 for secondary amplitude and phase calibration. Observations were carried out under good weather conditions with 27 antennas. For primary flux calibration, 3C 48 was observed.
Data were mapped using the CLEAN algorithm at natural weighting; this results in a synthesized beam of 0.51 ′′0.44 ′′ and an rms of 44 Jy beam-1 (no map shown here).

2.2. GBT Data
2.2.1 CN(=10)
As part of our wide-band high- molecular line study (Riechers et al. 2006), we observed the =3/21/2, =5/23/2, =1/21/2, and =3/23/2 hyper-fine structure transitions of the CN(=10, =0, =3/21/2) line (GHz) towards APM 08279+5255 with the GBT between 2004 December 15 and 19 for a total of 22.5 hr (15 hr on source). At the target redshift of 3.911, these lines are redshifted to 23.109-23.113 GHz (12.97 mm, K band), and can be observed simultaneously (in-band) with CO(=10) at the GBT (see Riechers et al. 2006 for a more detailed description and results on the CO observations). Observations were performed in ON–OFF position switching mode using the nearby source J0753+538 for secondary amplitude and pointing calibration, correcting for the atmospheric opacity. The pointing accuracy was typically 3′′. Observations were carried out under excellent weather conditions. For primary flux calibration, 3C 147 and 3C 286 were observed during each run. The dual-beam, dual-polarization 18-26 GHz receiver was used for all observations. The beam size at our observing frequency is 32′′ (230 kpc at the source’s redshift), i.e., much larger than our target.
Two 800 MHz IFs with 2048 390.625 kHz (5 km s-1) channels and two orthogonal polarizations each were observed simultaneously. The first IF was centered on the redshifted CO(=10) frequency at 23.4663 GHz, and the second IF was tuned 700 MHz bluewards. Therefore, the observed CN(=10) fine structure transition lines are located at the lower end of the first IF.
For data reduction and analysis, the AIPS++555http://www.aips2.nrao.edu. and GBT IDL666http://gbtidl.sourceforge.net. packages were used. Final combination, binning, and baseline subtraction were done with GILDAS/CLASS777http://www.iram.fr/IRAMFR/GILDAS/.. An rms of 65 Jy was attained in these observations.
3. Results
3.1. CO(1–0) Line and 23.5 GHz Continuum Emission
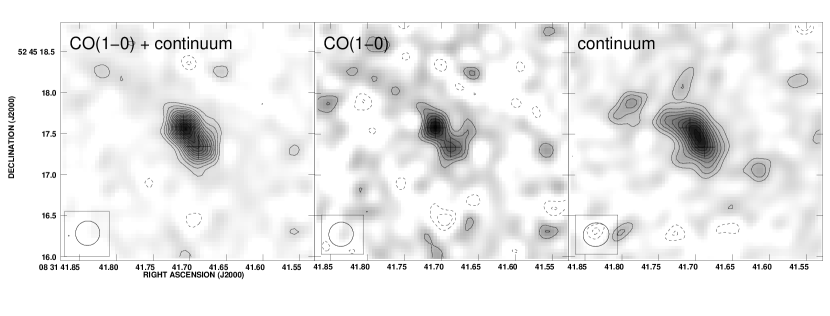
We have resolved the emission from the CO(=10) transition line towards APM 08279+5255 (), as well as the continuum emission at the same frequency (Fig. 1). The left panel of Fig. 1 shows the CO(=10) and continuum emission, the middle panel the continuum-subtracted CO(=10) emission, and the right panel the 23.5 GHz continuum emission. The continuum-subtracted CO(=10) line emission (Fig. 1, middle) is clearly resolved into two peaks (north-east and south-west). From 2-dimensional Gaussian fitting we find a line peak flux density of 131 16 Jy beam-1 for the north-eastern CO peak at = , = and a line peak flux density of 87 16 Jy beam-1 for the south-western CO peak at = , = (astrometric errors are derived from the fit; Tables 2 and 3). This corresponds to a peak flux ratio of (SW,NE)=0.66 0.15. The separation between both peaks is (SW,NE)=0.31′′ 0.05′′.
The continuum emission (Fig. 1, right) is also clearly resolved and has about the same extent as the CO(=10) line emission, but is not resolved into two individual peaks. The emission rather peaks centrally between the two CO peaks indicated by the plus signs. For the continuum emission at this resolution, we derive a peak flux density of 147 12 Jy beam-1 by fitting a single two-dimensional Gaussian.
In Fig. 2, four (continuum-subtracted) channel maps (9.375 MHz, or 120 km s-1 each) of the central 37.5 MHz (480 km s-1) of the CO(=10) line are shown. The line is resolved into the two CO(=10) peaks defined above in the central two channels, and the decline of the line intensity towards the line wings is clearly visible in the outer channels, as expected. Due to the slight asymmetry of the CO(=10) line with respect to our central tuning frequency, only little emission is detected in the blueward outer channel, the lack of extended emission in this channel is therefore ascribed to low signal-to-noise rather than different structure relative to the other channels. However, there is tentative evidence for a spatially resolved velocity gradient between the velocity channels along an axis close to the major lensing axis. From the central line channels, we derive a line peak flux density of 185 27 Jy beam-1 for the north-eastern CO peak and a line peak flux density of 101 27 Jy beam-1 for the south-western CO peak.
To derive the full CO(=10) and 23.5 GHz continuum flux of APM 08279+5255, we have imaged the whole B, C, and D array dataset with natural weighting, but tapered to a linear resolution of 1.2′′ (Fig. 3 and Fig. 4, top right). At this resolution, the source appears at best marginally resolved, and we derive that we outresolve at most 10% of the integrated flux. From the integrated maps, we derive an CO(=10) peak flux density of 210 19 Jy beam-1, and a continuum peak flux density of 372 19 Jy beam-1. The complete beam-corrected source fluxes (derived from 2-dimensional Gaussian fitting to the source) in both maps agree with the peak fluxes within the errors. It also agrees well with the beam-corrected fluxes in the full resolution dataset within the error bars. From the central line channels, we derive a CO(=10) line peak flux density of 285 27 Jy beam-1.
This peak flux agrees well with that derived from single-dish observations. Figure 6 shows the central part of the CO(=10) spectrum we have obtained with the GBT (Riechers et al. 2006). This spectrum has a resolution of 75 km s-1 at an rms of 65 Jy per channel. The solid black line is a Gaussian fit to that data. Overplotted on this spectrum, we show the flux of the four 120 km s-1 channels of Fig. 2 (but for the tapered BCD array dataset). The error bars indicate the rms per channel (40 Jy). This clearly demonstrates that, within the error bars, our interferometric observations recover the same amount of CO emission as the single-dish observations obtained with a 32′′ observing beam.
3.2. CO(2–1) Line Emission
The CO(=21) transition line towards APM 08279+5255 () is also detected (see also discovery paper by Papadopoulos et al. 2001). To extract the full CO(=21) line flux, we convolved the map with a circular beam of 1.2′′ diameter. From 2-dimensional Gaussian fitting, we then derive a line peak flux density of 1637 65 Jy beam-1.
We note that during none of the (archival) CO(=21) observations, the continuum at 46.9 GHz was measured. However, Papadopoulos et al. (2001) report a limit of 3=0.9 mJy on the continuum emission at 43.3 GHz. This means that up to about half of the CO(=21) emission reported above may be attributed to 7 mm continuum emission rather than CO(=21) emission (see Sect. 4.3 for further discussion).
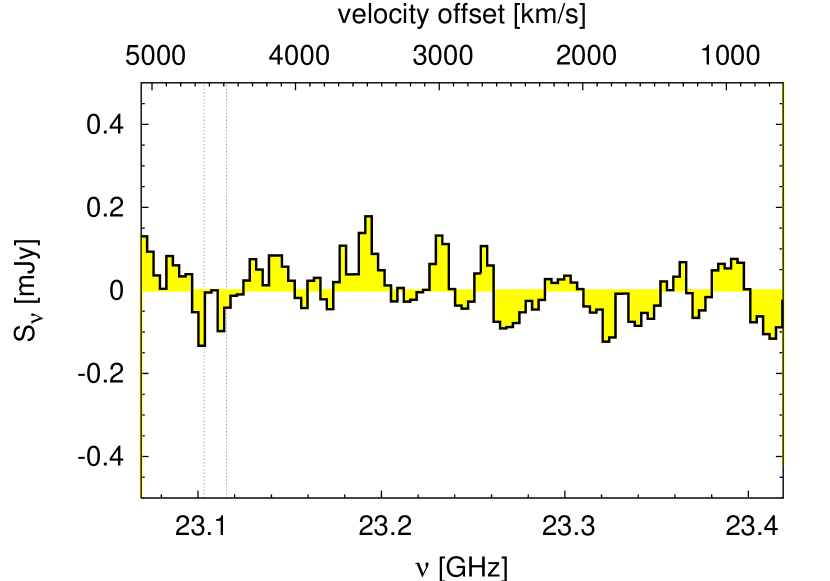
3.3. The Search for CN(1–0) Line Emission
To measure the total CO luminosity, we have obtained wide-band CO(=10) observations toward APM 08279+5255 with the GBT (see Riechers et al. 2006 for details). The bandwidth of these observations was high enough to also search for redshifted CN(=10) emission within the same setup (see Fig. 7). The strongest hyper-fine structure components of the CN(=10, =0, =3/21/2) multiplet, i.e. the =3/21/2, =5/23/2, =1/21/2, and =3/23/2 transitions, have rest frequencies of 113.4881420, 113.4909850, 113.4996430, and 113.5089340 GHz. At , this corresponds to 23.109, 23.110, 23.111, and 23.113 GHz. Accounting for the uncertainty in redshift (Riechers et al. 2006), the dashed lines in Fig. 7 indicate the region where these transitions are expected to peak. We note that, if the CN emission comes from a similar region than the CO emission, these components are expected to be blended due to their large linewidth (500 km s-1, or 39 MHz FWHM, Riechers et al. 2006; Weiß et al. 2007). At an rms of 65 Jy, we do not detect any emission. We thus set a 3 limit of 195 Jy on the peak strength of the CN(=10) emission in APM 08279+5255.
| Component | Position | (CO) | (8.4 GHz) |
|---|---|---|---|
| (;) | [Jy] | [Jy] | |
| APM08279(A) | ( ; ) | 131 16 | 205 20 |
| (B) | ( ; ) | 87 16 | 204 20 |
3.4. Continuum Emission at 1.4 GHz
Using the VLA in A array, 1.4 GHz continuum emission from APM 08279+5255 was detected by Ivison (2006). From this analysis, Ivison (2006) derived a continuum flux density of 3.05 0.07 mJy. APM 08279+5255 was previously detected at 1.4 GHz in the VLA-FIRST survey (White et al. 1997), but at significantly lower resolution and signal-to-noise. However, the 1.4 GHz continuum flux of 897 148 Jy beam-1 derived from the VLA-FIRST data is significantly lower that that of Ivison (2006). To obtain a coherent dataset, we thus re-analyzed the A-array data by Ivison (2006). We derive a continuum peak flux density of 1160 33 Jy beam-1 (see Fig. 4, top left). This value is consistent with that found from the VLA-FIRST survey data, but significantly lower than that derived by Ivison (2006). Our result was independently confirmed by Ivison (2007, priv. comm.). We thus use our revised 1.4 GHz continuum flux in the following.
3.5. Continuum Emission at 4.5 GHz
We have detected continuum emission at 4.5 GHz towards APM 08279+5255 using the VLA in B array. APM 08279+5255 remains unresolved in our observations (see Fig. 4, bottom left). We derive a continuum peak flux density of 551 40 Jy beam-1. We also detect another continuum source about 3′′ south of APM 08279+5255, which is detected at a peak flux density of 180 40 Jy beam-1 (this source was first detected at 8.4 GHz by Ibata et al. 1999, see peak position derived below). At the given signal-to-noise, it is unclear whether this source is extended or not. APM 08279+5255 has been detected at 4.5 GHz previously (Ivison 2006), but at a factor of 4 worse linear resolution (VLA C array, ). Thus, APM 08279+5255 and the source detected 3′′ south are blended at this resolution in Ivison’s data, and the continuum flux of APM 08279+5255 at 4.5 GHz is overestimated. The 4.5 GHz continuum flux derived from Ivison’s data (his Fig. 2, bottom panel) is in good agreement with the sum of the 4.5 GHz continuum fluxes of both sources in our analysis. We thus use our revised 4.5 GHz continuum flux of APM 08279+5255 in the following.
3.6. Continuum Emission at 8.4 GHz
Continuum emission from APM 08279+5255 was first detected at 8.4 GHz by Ibata et al. (1999) using the VLA in BnA array. We here combine this data with shorter B array spacings to improve the sensitivity of the data (see Fig. 4, bottom right). For APM 08279+5255, we derive a 8.4 GHz peak flux density of 446 20 Jy beam-1 (map convolved with a circular beam of 1.2′′ diameter for flux extraction), consistent with the value given by Ibata et al. (1999) of 0.45 0.03 mJy. We also detect the ‘southern’ source described in the previous subsection. It is detected at higher signal-to-noise and resolution in the unconvolved map than at 4.5 GHz. We thus use the 8.4 GHz data to derive the peak position of the source. The position of =, = is in good agreement with the peak of the 4.5 GHz continuum (source designation from now on: VLA J083141+524514). From the unconvolved, naturally weighted emission line map, we derive a peak flux density of 83 10 Jy beam-1. Note that VLA J083141+524514 is detected in none of the other bands, 3 upper limits are given in Tab. 4.
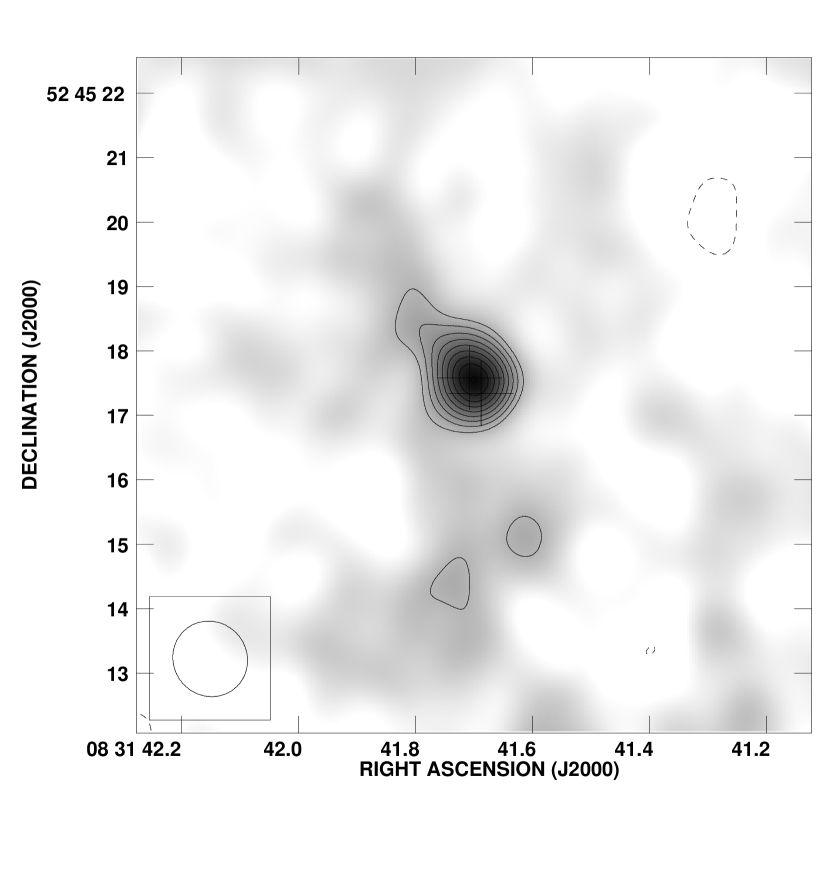
We also imaged APM 08279+5255 with uniform weighting (Fig. 5). The emission is clearly resolved into two peaks at this higher resolution, which coincide with the CO(=10) peaks as indicated by the plus signs. Interestingly, both peaks appear to have the same brightness at 8.4 GHz (205 20 Jy beam-1 for the north-eastern peak, and 204 20 Jy beam-1 for the south-western peak; corresponding to rest-frame peak brightness temperatures of 12612 and 12512 K). This is consistent with the naturally weighted image where the emission peaks centrally between the CO(=10) peak positions (as both components are blended due to lower resolution). This different image brightness ratio relative to CO may be due to two non-thermal radio continuum components within the source with different spectral indices that are lensed differentially. VLA J083141+524514 remains unresolved at this higher resolution.

3.7. Continuum Emission at 14.9 GHz
Continuum emission at 14.9 GHz was searched for towards APM 08279+5255. We tentatively detect emission at the center of the CO(=10) peak positions. This emission appears to be resolved and elongated along the same axis as the CO(=10) emission. The peak flux density measured at this position is 161 44 Jy beam-1. However, since the detected flux density is 4, this measurement has to be treated with caution, and more sensitive data are required to confirm this result. Convolving this image with a circular beam of 1.2′′ diameter as above, we derive a flux density of 30393 Jy beam-1, which we will treat as a tentative detection in the following. We summarize all our results in Tab. 2.
4. Analysis
4.1. Spectral Energy Distribution
Detailed continuum observations are now available for APM 08279+5255. Figure 8 shows the near-infrared-to-radio (1 m–1 m, or 300 THz–300 MHz) spectral energy distribution (SED). The mid-IR-to-far-IR part of the spectrum has been modeled previously (Rowan-Robinson 2000; Beelen et al. 2006), indicating that a two component fit to the dust emission may be necessary to reproduce the data (a ‘warm’ AGN dust torus component plus a ‘cold’ starburst component; see also the multiple-component models by Blain et al. 2003). Recently, Weiß et al. (2007) have presented a model for the dust continuum that also assumes two components, but which is additionally constrained by model parameters which result from a study of multiple rotational transitions of CO and HCN.
However, no detailed analysis of the radio continuum properties of APM 08279+5255 has been conducted so far. We here present two modeling approaches. The first model aims at finding an overall good fit to the data while minimizing the number of free parameters. The second model aims at constraining which fraction of the total radio continuum emission is due to star formation (i.e., not AGN-related888Note that our models do not account for possible AGN variability in this source (for which no evidence has been found to date).).
4.1.1 Best Fit SED Model
As our focus lies on fitting the radio data, we restrict our analysis to the mid-IR-to-radio part of the spectral data (60 m to 90 cm). For comparison only, we also show upscaled versions of quasar templates by Elvis et al. (1994) and Richards et al. (2006) on the optical to mid-IR part of the spectrum, which however are not particularly good fits to APM 08279+5255’s SED.
Thermal dust emission is mainly caused by ionizing and non-ionizing ultra-violet (UV) radiation from massive stars and (in quasars) possibly the central AGN. This radiation is processed by the dust and then re-radiated in the far-infrared wavelength regime. To minimize the number of free parameters, we adopt the results of Weiß et al. (2007) to describe the dust continuum part of the SED. As discussed by Weiß et al., this implies dust masses of M⊙ and M⊙ and dust temperatures of K and K for the ‘cold’ and ‘warm’ dust components, a dust disk with a magnified equivalent radius of pc, relative area filling factors of 78% and 22%, and a dust absorption coefficient exponent of =2 to describe its frequency dependence ( denotes the lensing magnification, the index d denotes thermal dust emission). Using these parameters and equations 3, 4, 5, and 6 of Weiß et al. (2007) fully describes the model used here for the dust emission. The observed flux density of the dust emission will be denoted as in the following. To extend this model to the radio continuum, we added a double power-law component, which we fit by the minimization technique. The full expression for the model flux density takes the form:
| (1) |
where indicates the frequency in GHz, indicates a constant coefficient, denotes a spectral index, and indicates the index denoting the ‘flat’ and ‘steep’ power-law components.
To solve equation (1), we attempted to fit the observed SED with three degrees of complexity. In the first step, we fixed the dust term to the model parameters by Weiß et al. (2007, see above), and fitted the ‘flat’ and ‘steep’ components with a four-parameter double power law least-squares fit. The best fits to the ‘flat’ component result in values close to -0.1. However, the fitting uncertainty of this component is quite large due to the relatively small region where this component actually dominates the emission. In the second step, we thus fixed to -0.1. The remaining three free parameters are fairly well constrained. Our best-fitting model to the composite spectrum then gives a ‘steep’ power law index of , and ‘steep’ and ‘flat’ coefficients of and . The ‘steep’ power law index suggests that APM 08279+5255 may be an ultra-steep spectrum source (; e.g., Bondi et al. 2007), which may indicate that it evolves in a dense environment (Klamer et al. 2006). In the third step, we left single or pairs of parameters of the Weiß et al. (2007) dust model as free parameters to test the stability of the solution. This however did not further improve our best solution. Our final SED model is shown in the top panel of Fig. 8.
| Frequency | Configuration | |
|---|---|---|
| [Jy] | ||
| 1.4 GHz | 100 | A |
| 4.5 GHz | 18040 | B |
| 8.4 GHz | 8310 | BnA/B |
| 14.9 GHz | 130 | B |
| 23.5 GHz | 40 | BCD |
| 46.9 GHz | 200 | CD |
Note. — Source is detected at position , .
4.1.2 Model SED of a Star-forming Galaxy
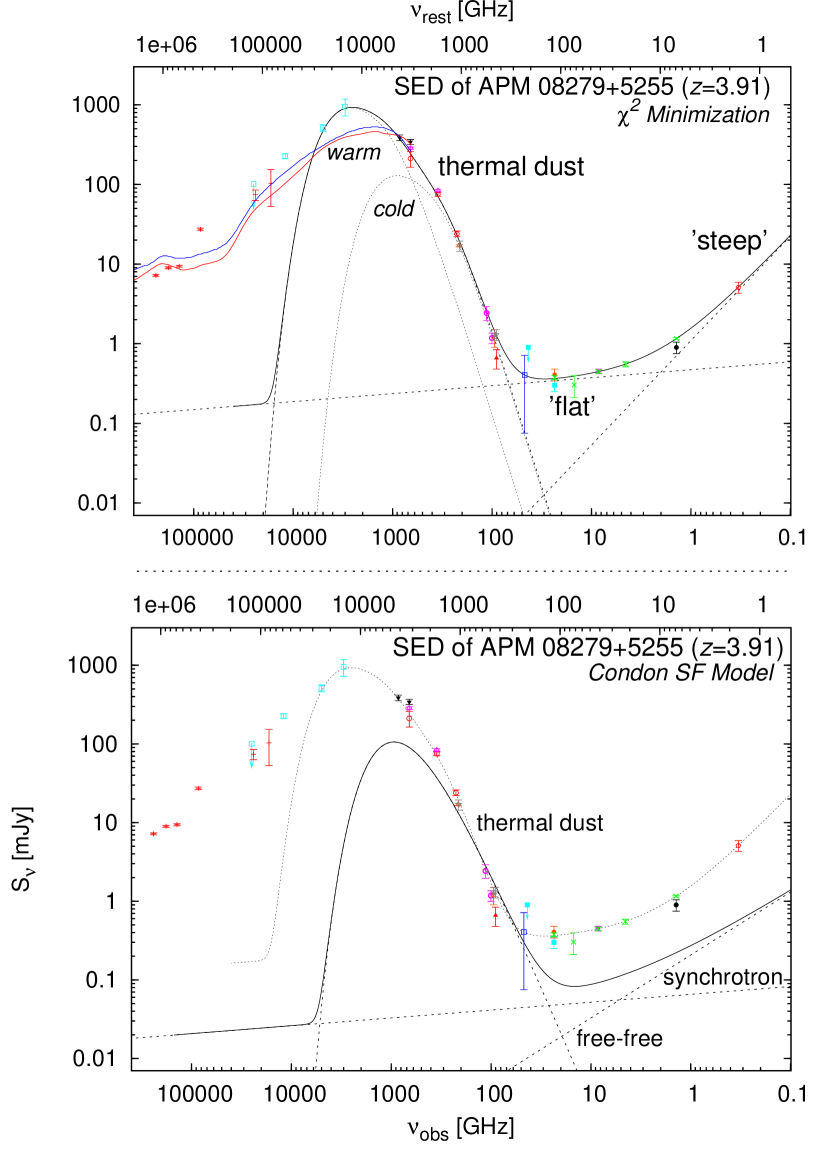
Due to the fact that APM 08279+5255 is a composite AGN-starburst system, it is likely that both components contribute to the continuum emission at radio wavelengths. Note that the ‘warm’ dust component in the Weiß et al. model of APM 08279+5255, which may be dominated by AGN heating, contributes 90% to the far-infrared (FIR) luminosity. This finding implies that a clear separation of AGN and starburst contributions to the radio luminosity may be possible.
We here investigate what fraction of the radio emission can be produced by the starburst component in APM 08279+5255. Based on the SED of the Milky Way and first principles, Condon (1992) has developed a model for the radio-through-FIR emission from ‘normal’ galaxies, which is solely attributed to a stellar origin. This model contains three components: one for thermal dust emission, one for thermal (mostly free-free) radio emission, and one for non-thermal (mostly synchrotron) radio emission. The two radio components are described by power laws. This model also fits the starburst galaxy M82 very well.
Free-free emission is either associated with the ionized gas in HII regions surrounding hot young stars, or the environment of the active galactic nucleus, and therefore an indicator for the total photoionization rate. If the thermal, optically thin free-free (or thermal bremsstrahlung) radiation emerges from a 104 K photoionized gas, a spectral index of (notation analogue to above) is expected, and thus assumed in the Condon model. The free-free power-law coefficient then parameterizes the emission measure, the source size and the electron temperature. However, note that free-free emission can only be described by a simple power law if the emission is optically thin.
The (non-thermal) synchrotron emission is optically thin at typical radio wavelengths, and produced in supernova explosions and remnants (SNRs) through acceleration of cosmic ray electrons, spiraling in a galaxy’s magnetic field. Detection of strong synchrotron emission from relativistic electrons thus indicates the presence of a large-scale magnetic field (Turner et al. 1998). In starburst galaxies, it may indicate a concentration of SNRs associated with localized and intense star formation. Synchrotron emission usually shows a spectral index of , with a typical value of –0.8, which is assumed in the Condon model. Here, the synchrotron power-law coefficient parameterizes the type II supernova rate (assuming that supernova remnants dominate the non-thermal synchrotron emission).
In the Condon (1992) model, all three components (dust heating, free-free, and synchrotron) are directly proportional to the star-formation rate (SFR) in a galaxy. The dust emissivity , the dust temperature , and the SFR are the only model parameters. We here adopt =1.5 from Condon’s model. Due to the fact that the ‘warm’ dust component in APM 08279+5255 may be dominantly heated by the AGN, we here only consider the ‘cold’ component, which likely traces the dominant fraction of the dust heated by star formation. We thus adopt =75 K. The only remaining free parameter thus is the SFR. Assuming a SFR of 4000 M⊙ yr-1 provides a reasonable fit to the spectrum of the cold dust of APM 08279+5255 (see Fig. 8, bottom). However, this model only recovers 20% of the radio emission. Yun & Carilli (2002) suggested some changes to the Condon model999They suggest a different initial mass function, an update to the H normalization, and a small correction factor for the supernova rate., which would result in about a factor of 2 less radio flux compared to the original Condon model. As a next step, we investigated if including the =220 K component (under the assumption that it is also heated by star formation) improves the fit. In this model, the peak of the dust spectrum limits the SFR from the ‘warm’ component to 1500 M⊙ yr-1. Assuming such high values however requires to reduce the SFR of the ‘cold’ component to only few hundreds M⊙ yr-1 in order to still reproduce the low- end of the dust bump. This significantly decreases the model-predicted radio flux, and thus gives an overall worse fit. The full radio flux could be recovered by including a very cold, 10-15 K dust component that is maintained by an extreme 15,000-20,000 M⊙ yr-1 starburst. Such a component could exist in theory, but would require to be spread out over large scales in order to exhibit such low dust temperatures, and thus is basically ruled out by high spatial resolution studies of this source. Although it is difficult to assess the validity of a simple Condon model for a warm, starbursting quasar like APM 08279+5255, this result leads us to conclude that the radio continuum emission in this source may be dominanted by the AGN. This would be in agreement with our best-fit model, as it implies an ultra-steep radio spectrum component, which is usually associated with a source where AGN-related emission dominates the energy output at radio frequencies (e.g., high redshift radio galaxies and quasars; Athreya et al. 1997; Pentericci et al. 2000). The ultra-steep spectrum component in AGN-driven radio sources is often associated with extended radio emission. Interestingly, the best-fit model also requires a relatively bright ‘flat’-spectrum component to originate from the radio AGN. The core of the archetypical radio galaxy Cygnus A has a flat spectrum at radio wavelengths, which dominates over the steep-spectrum emission from the hotspots at higher frequencies (e.g., Eales et al. 1989). A similar ‘composite’ effect (extended steep-spectrum component, flat core component) may cause the apparent flattening of the radio spectrum of APM 08279+5255.
4.2. Comparison to Previous CO(1–0) Imaging
The CO(=10) transition line in APM 08279+5255 was targeted twice before with the VLA, first at C array resolution (1.5 ′′1.4 ′′, Papadopoulos et al. 2001), and then followed up at higher B array resolution (0.39 ′′0.28 ′′, Lewis et al. 2002a). Both observations were setup in quasi-continuum mode, i.e. lacking any spectral information of the CO(=10) line. In both observations, CO(=10) line and 23.3649 GHz continuum emission were detected towards the source. Papadopoulos et al. (2001) detect unresolved continuum emission at a flux density level of 0.30 0.05 mJy. Lewis et al. (2002a) detect continuum emission at a flux density of 0.41 0.07 mJy, and the resolved structure coincides with our continuum map in structure and position. Both flux densities are in agreement with our result within the errors, although some intrinsic variability cannot be excluded.
Papadopoulos et al. (2001) report the detection of resolved CO(=10) emission towards APM 08279+5255, which extends over scales of 7 ′′2.25 ′′ (their 3 contour) at a resolution convolved to 2.25 ′′2.25 ′′ (7 ′′ correspond to 30 kpc at the target redshift of 3.911). They quote an integrated flux for the ‘nuclear CO(=10) emission’ (the inner 1′′) of 0.150 0.045 Jy km s-1.
From our new VLA observations, we derive an integrated CO(=10) flux of 0.168 0.015 Jy km s-1 assuming a line FWHM of 556 55 km s-1 (Riechers et al. 2006; width of our bandpass: 558 km s-1). This corresponds to a CO(=10) line luminosity of = (10.60.9)10 K km s-1 pc2 (see Tab. 4.2). From the CO(=10) spectrum obtained with the GBT, Riechers et al. (2006) find 0.152 0.020 Jy km s-1. The 3 contour of the extended CO(=10) reservoir of Papadopoulos et al. (2001, their Fig. 1) corresponds to a flux density of 120 Jy beam-1. In our CO(=10) map which was tapered to a linear resolution of 1.2′′ (Fig. 3, similar to the resolution of their observations), this would correspond to 6.3. Even at less than half this flux level (3=57 Jy beam-1), we find no evidence for any extended flux. We note that our observations even include shorter (D array) baselines than Papadopoulos et al. (2001) and are therefore more sensitive to extended structure. We thus exclude the possibility that our observations outresolve the extended emission, and conclude that there is no bright, extended CO(=10) reservoir in APM 08279+5255.
Lewis et al. (2002a) find resolved CO(=10) emission on sub-arcsec scale at moderate signal-to-noise. The peak of the emission reported in their paper roughly coincides with our north-eastern CO(=10) peak. However, our new, more sensitive (by a factor of 2 in terms of rms noise) high-resolution maps do not show the extended structure that is present in their CO(=10) map, which we thus conclude to be a noise artifact. Lewis et al. (2002a) derive an integrated CO(=10) flux of 0.22 0.05 Jy km s-1 from their observations, in agreement with the three independent results given above within the errors (adopting only the ‘nuclear CO(=10) emission’ from the report of Papadopoulos et al.).
| Line | data reference | |||
|---|---|---|---|---|
| [Jy km s-1] | [1010 K km s-1 pc2] | |||
| CO(=10) | 0.168 0.015 | 10.6 0.9 | 1 | 1,2 |
| CO(=21) | 0.81 0.18 | 12.8 2.9 | 1.21 0.30 | 1,3 |
| CO(=43) | 3.7 0.2 | 14.7 0.9 | 1.39 0.16 | 4 |
| CO(=65) | 6.7 1.2 | 11.8 2.1 | 1.12 0.23 | 4 |
| CO(=98) | 11.8 0.6 | 9.2 0.4 | 0.89 0.10 | 4 |
| CO(=109) | 11.9 2.0 | 7.5 1.2 | 0.71 0.14 | 4 |
| CO(=1110) | 11.3 1.9 | 5.9 1.0 | 0.56 0.11 | 4 |
| CN(=10) | 0.06 | 3.9 | 0.37 | 1 |
References. — [1] this work; [2] Riechers et al. 2006; [3] Papadopoulos et al. 2001; [4] Weiß et al. 2007.
Note. — Luminosities are apparent values uncorrected for gravitational magnification. They are derived as described by Solomon et al. (1992): , where is the velocity-integrated line flux in Jy km s-1, is the luminosity distance in Mpc, is the observed frequency in GHz, and is the lensing magnification factor.
4.3. On the 46.9 GHz Continuum Emission
As mentioned previously, the continuum emission at the line frequency (46.9 GHz) was not monitored in parallel during the (archival) CO(=21) observations. Papadopoulos et al. (2001) report a limit of mJy on the continuum emission at 43.3 GHz. This corresponds to 55% of the CO(=21) peak flux. Therefore, the ‘real’ CO(=21) flux towards APM 08279+5255 may be lower by up to a factor of 2. Based on our SED modeling, we now attempt to set additional limits to the continuum contribution to the emission detected at the CO(=21) frequency to attain some tighter constraints.
A first-order estimate for the 46.9 GHz continuum flux is provided by examining the overall spectral energy distribution of APM 08279+5255. The SED model presented in Fig. 8 predicts a continuum flux at 46.9 GHz of 405 Jy. This estimate is plotted as the square symbol in Fig. 8. A lower constraint is provided by the fit to the thermal part of the SED (75 Jy), and an upper constraint is given by linear interpolation of the 23 GHz and 94 GHz continuum flux measurements (715 Jy). For illustration, these constraints are plotted as error bars to this model-predicted data point. We however note that the 23 GHz and 94 GHz measurements were obtained at different epochs, therefore this estimate does not account for possible variability of the millimeter continuum.
As another estimate, we assume that both the emission from CO(=10) and CO(=21) are fully thermalized and optically thick. The CO(=21) peak flux should then be four times higher than the CO(=10) peak flux. For the CO(=10) peak flux, an average over the whole 558 km s-1 bandpass (21019 Jy) is assumed to match the velocity resolution of the CO(=21) observations as closely as possible. In comparison to the measured flux at the CO(=21) frequency (163765 Jy), this predicts a contribution of the continuum flux of 800 Jy, which is twice as high as the SED-based estimate. This discrepancy may be explained by different optical depths of the emission from different rotational CO transitions. If the opacity of the CO(=10) emission is much lower than that of the higher transitions, it may actually have a lower luminosity than the emission from these transitions [contrary to the effects of (sub-)thermal excitation]. This would allow the CO(=21) line peak flux to be more than four times higher than the CO(=10) peak flux. Note that such an effect may actually be observed towards APM 08279+5255 in the 4 transitions, as the CO(=43)/CO(=10) luminosity ratio is 1 (Weiß et al. 2007; see also Tab. 4.2).
We conclude that APM 08279+5255 likely exhibits a 46.9 GHz continuum flux of at least 0.4 mJy, i.e. 25% of the measured CO(=21) flux. We thus estimate the ‘real’ CO(=21) line peak flux to be 1.2 mJy. From this, we derive a CO(=21) line luminosity of =(12.82.9)10 K km s-1 pc2.
4.4. A Limit for the CN Luminosity
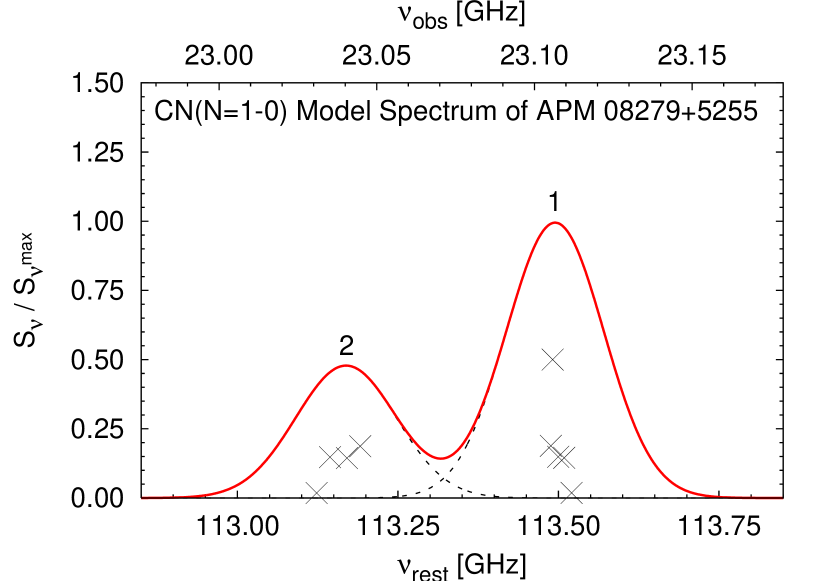
Due to its fine structure (fs) and hyperfine structure (hfs) splitting, the CN(=10) emission line is distributed over 9 lines101010We assume that CN is in its ground electronic state (), and that the spins couple according to Hund’s case (b) coupling scheme: , (fs coupling) and (hfs coupling). Here, is the rotational angular momentum vector, is the electronic spin, and is a nuclear spin. in its =0 vibrational state. These lines are distributed in 2 main components separated by about 350 MHz in the rest frame. While the hfs transitions within these main components are blended if their kinematical broadening is similar to that of the CO/HCN lines in APM 08279+5255, the components themselves are still clearly separated. To obtain a proper limit on the integrated CN(=10) line flux (and thus on the total CN luminosity), we calculated a synthetic line profile, assuming optically thin emission in the Local Thermodynamic Equilibrium (LTE) case to derive the relative intensities of the hfs components. The relative intensities of the components were computed using the laboratory data from Skatrud et al. (1983), and approximation (4) of equation (1) of Pickett et al. (1998). Assuming that all CN(=10) hfs components are kinematically broadened in the same way as the higher CO lines (500 km s-1 FWHM; see Weiß et al. 2007), we obtain the synthetic line profile displayed in Fig. 9 (solid line). The two main components (dashed lines) have a peak strength ratio of 2:1. The brightest main component is fully covered by our bandpass, the second component, however, was close to the edge, and thus only covered in part by the part of the spectrum that was properly calibratable. For the derivation of the limit on the integrated CN(=10) line flux, we thus consider the peak flux limit for the brightest component to derive the relative intensity limits for all subcomponents in the LTE case. Under these assumptions, we derive a limit of 0.06 Jy km s-1 for the integrated line flux, and thus a limit of 3.910 K km s-1 pc2 for the line luminosity. This corresponds to a luminosity ratio limit of /0.37. Note that Guélin et al. (2007) recently observed the CN(=43) transition towards APM 08279+5255; however, due to strong blending with the HNC(=54) line, it remains unclear whether or not the line is detected.
4.5. Radio Luminosity
In general, the monochromatic rest-frame 1.4 GHz radio luminosity is defined as:
| (2) |
However, we here calculate based on the (rest-frame) 1.4 GHz flux predicted by our best-fit SED model. In the above equation, this would correspond to using a spectral index of =–1.05. We thus obtain =(1.900.05)1026 W Hz-1 (not lensing corrected), about 10 times the radio luminosity of M87 (=(1.760.07)1025 W Hz-1; Laing & Peacock 1980). In an analogous manner, we derive a 5 GHz radio luminosity of =(4.750.34)1025 W Hz-1. Here, the model prediction would correspond to a spectral index of only =–0.67.
Studies of the radio luminosity function of quasars and its evolution have identified a bimodality in the source distribution, separating them into radio-quiet and radio-loud quasars. However, two generally different definitions of radio loudness have been put forward, one based on the optical-to-radio flux ratio (e.g., Schmidt 1970; Kellerman et al. 1989), and one only based on the monochromatic radio luminosity (e.g., Peacock et al. 1986; Schneider et al. 1992). However, Ivezić et al. (2002) argue that for optically selected quasars, both definitions are similar within the flux-limited samples that were examined. We thus restrict our analysis to the radio luminosity-based estimate here. Due to different assumptions and definitions, a range of threshold values for the radio loudness definition is found in the literature. For the radio-based definition, we here adopt the range of =(1.0–5.6)1025 W Hz-1 as given by Schneider et al. (1992). Changing the cutoff within this range does not change the relations they find dramatically. Even without correcting for gravitational lensing, APM 08279+5255 clearly falls within the transition region between radio-quiet and radio-loud sources. As this source is known to be substantially gravitationally magnified (see also discussion below), we conclude that it is a radio-quiet quasar by this definition.
4.6. Morphology at X-Ray to Radio Wavelengths
Optical imaging of APM 08279+5255 with the Hubble Space Telescope (HST) Near Infrared Camera and Multi-Object Spectrometer (NICMOS) has revealed three pointlike, almost collinear images with very similar colors (Ibata et al. 1999). A spectroscopic follow-up study with the Space Telescope Imaging Spectrograph (STIS) spectrograph on board HST has shown that these three images have essentially identical spectral shapes, and thus are, indeed, all images caused by gravitational lensing (Lewis et al. 2002b). These three optical images A, B, and C111111By convention, A is the brightest image, and C is the faintest image. are separated by (A,B)=0.377′′0.002′′ and (A,C)=0.150′′0.006′′, and have brightness ratios of (A,B)=0.773 0.007 and (A,C)=0.175 0.008, i.e., (A+C,B)0.66. The north-eastern CO peak corresponds to a blend of optical images A+C, and the south-western CO peak to optical image B. The CO image peak brightness ratio of (SW,NE)=0.66 0.15 thus agrees very well with the optical observations. The separation of the CO images is by 20% lower than that of optical images A and B, which agrees with the assumption that the north-eastern CO component is actually a blend of optical images A+C, which we will assume in the following.
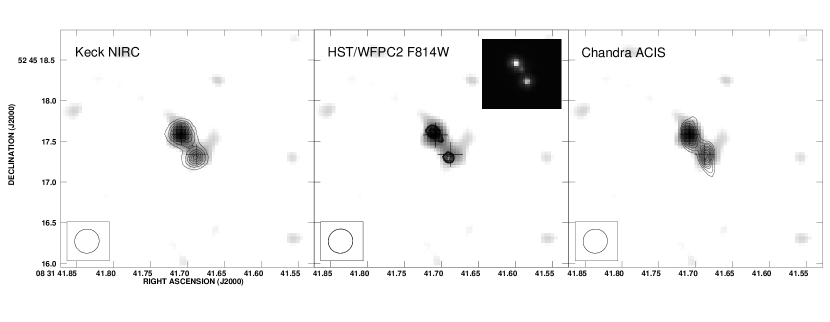
In their analysis, Ibata et al. (1999) find an offset of 0.6′′ between the positions of HST NICMOS image A and the 8.4 GHz continuum source, which is not thought to be real. From our analysis, we find that the observations in six different radio frequency bands are consistent in position among each other to high precision (and with the radio positions from previous studies). We also find that the offset between the radio position and a more recent image taken with HST Wide-Field Planetary Camera (WFPC2; HST archive, see also Fig. 10) is 0.2′′. This implies a large offset between the WFPC2 and NICMOS images, which are close in wavelength and likely dominated by compact, parsec-scale AGN emission which is expected to be spatially coincident. In the following, we thus assume that these offsets are due to HST astrometric calibration errors, and shift all images at other wavelengths to the radio coordinates.
The three images of APM 08279+5255 were also resolved in the (observed frame) near-infrared (NIR) continuum at 2.2 m in ground-based adaptive optics observations with the Keck telescopes (Egami et al. 2000) at a resolution where images A and C are still significantly blended, similar to our CO(=10) observations. The left panel of Fig. 10 shows an overlay of the 2.2 m continuum emission and the CO(=10) emission. The 2.2 m has been de-rotated (see caption of Fig. 1 of Egami et al. 2000 for the rotation angle) and aligned to the radio coordinates. The resolution of the NIR observations is by about a factor of 2 higher than that of the CO observations, and thus peaks close to the position of image A rather than between A and C. The image separation of the two peaks thus is (A,B)=0.38′′, in agreement with the optical images (Fig. 10, middle panel). Taking this into account, it is striking how similar the morphologies of the NIR and CO emission are, even though they are expected to emerge from largely different scales (hot dust around the central AGN vs. cold molecular gas in an extended star-forming ring), and thus to be differentially lensed. This similarity of morphologies even holds for hard X-ray emission from the central engine (Chartas et al. 2002, see Fig. 10, right), which is expected to be by many orders of magnitude more compact than the CO emission. Even the image separation (A,B)=0.38′′0.01′′ of the two main peaks (image A and C are again significantly blended) is the same as in the optical/NIR, and thus in agreement with the CO observations under the above assumptions.
In addition, the rest-frame 2.6 mm continuum underlying the CO(=10) line shows a different, more extended structure than the CO emission121212A possible caveat is that the bandwidth of our observations is too narrow to image the CO(=10) linewings. It however is highly unlikely that this significantly alters this conclusion. (see Fig. 1). This may be due to a foreground source that emits in the continuum, but does not contribute to the line emission due to its different redshift. Another, probably more likely explanation is that the different structure is due to differential lensing. If the 2.6 mm continuum emission were to be due to star formation, it would be possible that it is dominated by a free-free component that is not co-spatial with the CO emission, but extended out to kpc scales. On the other hand, the SED of APM 08279+5255 indicates that a major fraction of emission at this wavelength may also be AGN-related. If correct, this would suggest that the differentially lensed emission is due to 100 pc to kpc-scale outflow from the nucleus. Higher resolution observations using a very long baseline radio interferometer are required to further investigate the nature of this phenomenon. Also, imaging the rest-frame FIR continuum at comparable resolution may shed more light on this issue. In the following, we will refer to this emission as ‘the extended component’. This differentially lensed, extended component may also contribute significantly to the continuum emission at 7.3 mm (8.4 GHz observed frame), which also shows a different structure compared to other wavelengths.
The morphological similarity of the strongly lensed quasar APM 08279+5255 on largely different scales (0.1 pc to few 100 pc) as well as the different structure of the extended continuum component (probably few 100 pc to kpc) severely constrains the lens configuration, and any valid lens model will have to be able to reproduce this scaling effect.
5. Gravitational Lensing
5.1. Direct Constraints on the Lensing Properties from the CO Observations
The brightness temperature of a lensed source is a conserved quantity under gravitational lensing, as the latter is a purely geometrical effect. Due to the fact that APM 08279+5255 is resolved in our CO(=10) observations, we can derive the observed brightness temperatures at redshift for images A+C and B directly from the observed peak fluxes using
| (3) |
where is the beam solid angle. For Gaussian beam and source shapes, this equation can be simplified to
| (4) |
where is given in K, is given in mm, the beam major and minor axes and are given in arcsec, and is given in Jy. These brightness temperatures can be converted to rest-frame observed brightness temperatures via
| (5) |
While CO(=10) images A+C and B are individually detected in our observations, their true size is likely smaller than our observing beam. The observed brightness temperatures thus are diluted by the beam (radius: ) and smaller than the true . The size of the lensed images can be expressed by an equivalent radius , which assumes that each image is a filled, circular lensed disk. Energy conservation then gives:
| (6) |
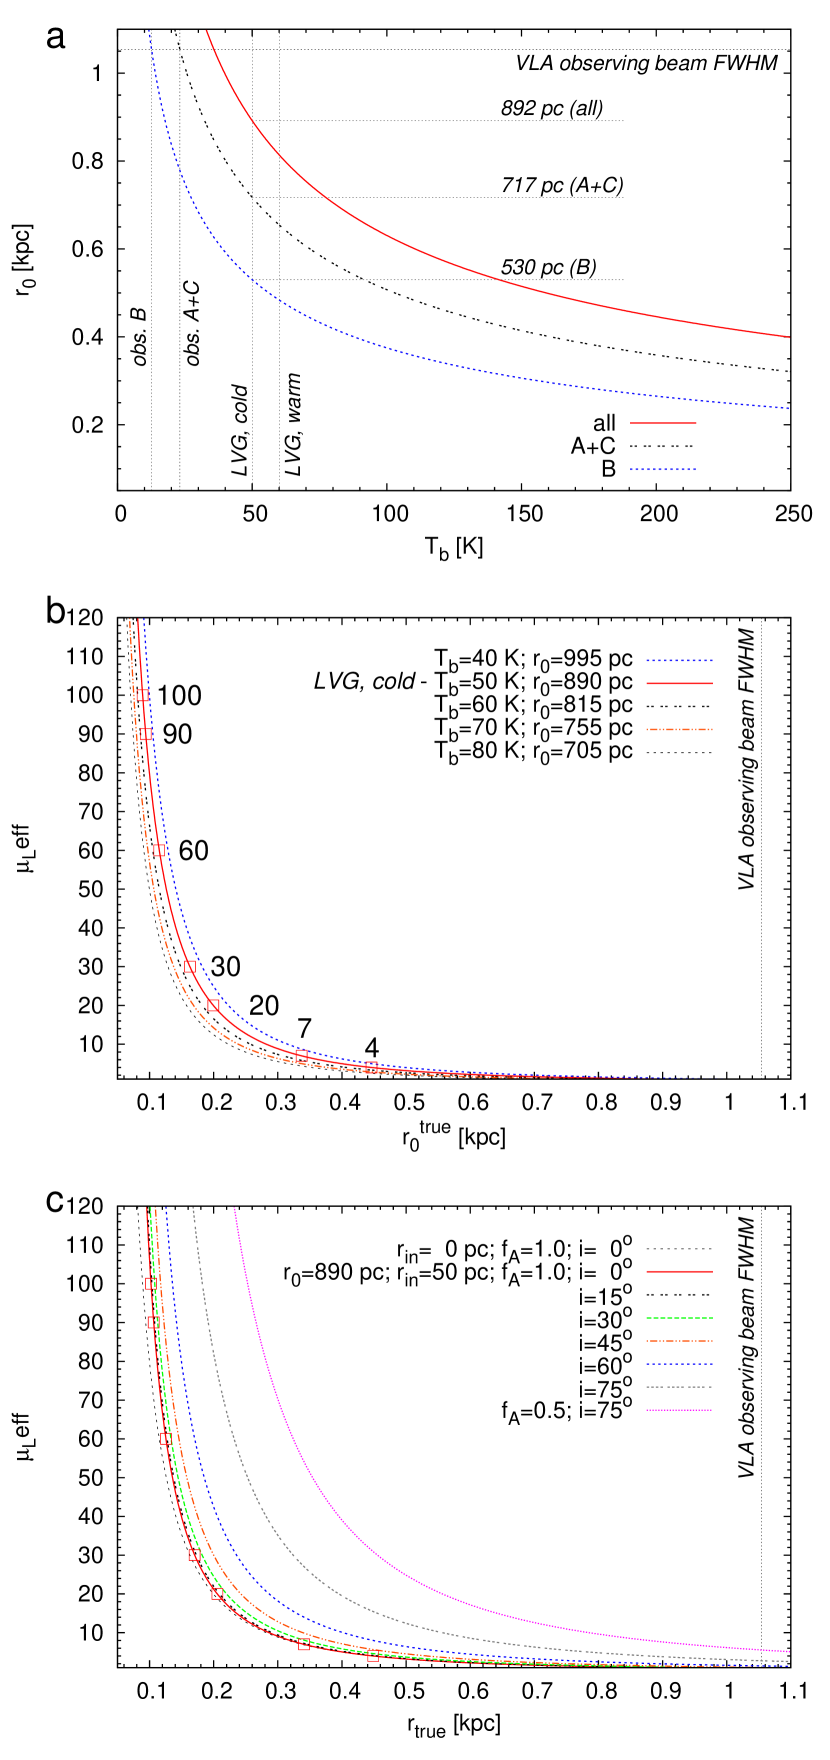
This relation is implied in the plot shown in Fig. 11a. The observed, beam-diluted (Rayleigh-Jeans) brightness temperatures of images A+C ( = 23.2 K) and B ( = 12.6 K) are indicated by vertical lines. The three curves indicate the beam-corrected brightness temperatures for different equivalent radii (which, by definition, cross with the observed rest-frame brightness temperatures at /, as indicated by the long horizontal line) for images A+C, B, and all images together. From Large Velocity Gradient (LVG) modeling of the CO(=10) to CO(=1110) SLED, Weiß et al. (2007) have derived that the molecular gas in APM 08279+5255 can be modeled with two gas components, a ‘cold, dense’ component with a H2 density of =105 cm-3 and a kinetic gas temperature of =65 K which contributes about 70% to the total CO(=10) luminosity, and a ‘warm’ component with a H2 density of =104 cm-3 and a kinetic gas temperature of =220 K which contributes about 30% to the total CO(=10) luminosity. For the ‘cold, dense’ component, their model predicts a true CO(=10) brightness temperature of =50 K, and for the ‘warm’ component, it predicts =60 K. Both are indicated in Fig. 11a by vertical lines. Assuming =50 K, as predicted by the LVG models for the dominant gas component, images A+C and B fill equivalent disks with radii of =717 pc and =530 pc. This corresponds to a total lensed equivalent disk with a radius of =892 pc, consistent with the results of Weiß et al. (2007) within the uncertainties. This also implies beam area filling factors of 46% and 25% for images A+C and B. These are significant fractions of the beam size, and may indicate that increasing the resolution by only a factor of 2–3 would be sufficient to detect substructure within the individual images. Assuming a 30% contribution of a warmer component with =60 K does not significantly alter any of these predictions. Even assuming much higher than typically observed in the central regions of nearby warm, ultra-luminous infrared galaxies (ULIRGs, e.g., Downes & Solomon 1998) of a few hundred Kelvins does not change the predicted by more than about a factor of 2. Also, the directly observed (beam-diluted) brightness temperatures limit the true to be at least 30 K considering that the contribution of image C to A+C is likely minor.
The effective lensing magnification is defined as the ratio between the observed apparent luminosity and the true luminosity. It thus is a direct measure for the ratio of the observed equivalent disk size and the true equivalent disk size via
| (7) |
This relation is displayed in Fig. 11b for a range of . The =50 K model discussed above is indicated by the solid line and the boxes (highlighting selected magnification factors). Using only the given constraints without modeling the system in more detail, a large range of magnification factors would be in agreement with the CO data. However, the impact of changing the intrinsic is relatively minor, as all curves occupy a narrow range in this plot.
The case of a completely filled, circular CO disk as discussed so far is a very particular solution, even appreciating the fact that the CO is likely situated in a relatively compact, rotating circumnuclear ring. In a more realistic approach, the CO disk has an inner boundary at a certain distance from the central hot nucleus, due to the simple fact that molecular gas cannot survive at distances where the ionizing radiation field is strong enough to dissociate the diatomic CO (and H2) molecules. It thus is a ring rather than a disk. Also, it is likely that we do not see this ring face-on, but at a certain inclination towards the line of sight (LOS). Also, the molecular material may be distributed in clouds and/or clumps rather than smoothly, and thus may have an area filling factor lower than 1. This can be expressed as (see also Weiß et al. 2007):
| (8) |
Note that =0∘ corresponds to face-on. Also, we use a thin disk approximation, neglecting the geometrical thickness of the CO ring. This simplification leads to an overprediction of for high inclinations. This approximation is justified, as the high observed optical brightness of the source in combination with the detection of large amounts of dust in its circumnuclear torus suggests that we have a relatively unobscured view on the AGN, and thus that we likely see the galaxy at a relatively low inclination (35∘).
In Fig. 11c, a range of inclinations is shown for the =50 K model in the – plane. An inner ring boundary of =50 pc is assumed unless stated otherwise. For comparison, a solution without an inner ring boundary is shown for =0∘. The change of the predicted is only minor, in particular for the solutions with low magnifications. In general, the figure shows that the range of solutions for high inclinations is significantly different from that for low inclinations. However, in the preferred range of , the solutions are fairly similar. While and can be constrained relatively well by existing observations, this is not at all true for . As an example, a solution with =75∘ and =0.5 is shown. The difference in area filling factor has a large impact on the predicted solutions. As another example, solutions for =0∘, =0.5 and =60∘, =1.0 are indistinguishable. The structure of the molecular ISM thus is an unknown in this discussion that has significant impact. There are two more interesting results to note: First, the resolution of our observations and A+C/B brightness ratio alone set a meaningful lower limit on the magnification of models with significantly lower than 1. Second, the models with close to 1 predict very compact CO rings for high magnifications (=80–125 pc).
Although the results presented in this subsection significantly constrain the allowed parameter space for potential lensing models, they do not allow to strongly constrain the actual magnification. In the following, we thus discuss existing lensing models in more detail, show their limitations, and suggest a new model which overcomes part of the problems of previous models.
5.2. Lens Modeling: Previous Models
In most classical lensing models, the surface density of the lensing galaxy is expressed by an ellipsoidal with a core of finite radius. However, high-resolution observations of the central regions of galaxies indicate that the luminosity profiles of some of the most massive galaxies appear to have central cusps rather than cores with finite radii (e.g., Faber et al. 1997). Such distributions are reminiscient of the cusp power-law density profiles with a break radius used for dark matter halos in cosmological simulations (e.g., Navarro, Frenk & White 1997, ‘NFW’), but, in these observations, are seen for the stellar component of the galaxies. The (baryonic) density profile of the lensing galaxy of APM 08279+5255 has been modeled with both core (Ibata et al. 1999; Egami et al. 2000) and cusp (Munoz et al. 2001; Lewis et al. 2002a) configurations previously.
5.2.1 Cored Singular Isothermal Ellipsoid Models
The model of Egami et al. (2000) is a modified singular isothermal ellipsoid (SIE) model with a finite core. Such models have six parameters: the Einstein radius, the core radius, the ellipticity of the lensing potential and its position angle, and the (2-dimensional) center position of the source. For a three image source like APM 08279+5255, observations offer six relevant constraints for the model: two relative image brightnesses, and two relative (2-dimensional) image positions. In addition, the fact that the three images are almost collinear requires the ellipticity to be close to zero, and thus predicts an almost circular lensing potential. The geometry of lensing systems requires that any non-singular mass distribution produces an odd number of lens images (Burke 1981). However, if the core is very small, one of the images is de-magnified, and thus unlikely to be observable (note that an even number of images is observed toward most lens systems). The fact that the third image of APM 08279+5255 is not strongly de-magnified thus also restricts the core to be non-singular, and thus to have a rather large radius within this model. Egami et al. (2000) find a core radius of 0.2′′, corresponding to 1.2–1.7 kpc at 0.53.5, the likely redshift range of the lensing galaxy, which appears extreme even for the most massive elliptical galaxies. In particular, quasar image C is located only 0.03′′ (180–250 pc) from the center of the lensing potential. As the authors already state themselves, one thus might expect differential reddening of image C in this configuration, which is not observed. However, the most problematic point of the Egami et al. (2000) model is that it predicts a rapid change of morphology with source size (their Fig. 7). For the X-ray to near-infrared observations, where most of the emission likely comes from the central 0.1–1 pc region, their model correctly predicts a three image configuration. This even holds true for a source size of 20 pc, where the images are elongated, but still clearly seperated, and thus would be picked up as three pointlike images by observations at a resolution of, e.g., 0.3′′. However, for source sizes of 50 pc and larger, the images start to form arcs and rings, and ultimately at 220 pc, a filled sphere. However, in our CO(=10) observations, we probe scales of 100–500 pc (see above), depending on the lensing magnification, but still see the 3-image structure as observed in the X-ray-to-NIR wavelength regime. Moreover, the extended components seen in radio continuum emission, which likely probes few 100 pc to kpc scales, gets lensed into an arc-like structure rather than a filled sphere (see Fig. 1, right). While this model predicts high effective lensing magnifications of 100 (and thus a plausible explanation for the extreme observed properties of APM 08279+5255), it is ruled out by the structure detected in our CO and radio continuum maps.
5.2.2 Cusp Models
As mentioned above, there is mounting evidence that galaxy cores are mostly very small, and that their mass distribution possesses a significant cusp (Rusin & Ma 2001; Winn et al. 2004). Munoz et al. (2001) thus suggested a model complementary to the one by Egami et al. (2000), assuming a cusp configuration for the lens in APM 08279+5255. Instead of a core radius, such models are parameterized by a cusp power-law index and a break radius, i.e., 7 parameters in total, and thus are underconstrained by a three-image lens without further assumptions. For APM 08279+5255, cusps with a small break radius are favoured, and lead to high magnification factors of 100, similar to the Egami et al. (2000) model. However, the source can only be modeled with relatively shallow cusps with a small power-law index (0.2–0.4 rather than 1–2 as observed toward most galaxies). Such shallow cusps are, indeed, relatively similar to cores with finite radii (corresponding to a power-law index of 0). The authors conclude that the lens may be a spiral galaxy, since some spiral galaxies appear to have finite central densities rather than steep cusps.
Keeton & Kochanek (1998) and Bartelmann & Loeb (1998) have shown that highly flattened, highly inclined potentials, as found, e.g., for disks of edge-on spiral galaxies, can form a ‘naked cusp’ caustic. In such a configuration, the inner diamond caustic extends outside the elliptical caustic, producing three roughly collinear images with similar brightness. The central third image is not strongly de-magnified, which is different from typical core and cusp models. However, a generic feature of such models with a naked cusp in an inclined spiral is that the overall magnification is significantly lower than in large core lenses. Such a peculiar lens configuration, however, is expected to be rare.
Lewis et al. (2002a) have developed a lensing model of the APM 08279+5255 system based on such a highly elliptical lens, where the quasar core of the lensed galaxy is situated in the direct vincinity of a naked cusp. In their model, the inclined disk of the lens has a projected axis ratio of 0.25, and a rotational velocity of 200 km s-1. It has a core radius of 0.065 kpc, and is truncated at an outer radius of 8 kpc. This truncated, flattened disk is assumed to sit in a spherical halo. Due to the possible detection of microlensing (Lewis et al. 2002b; Chartas et al. 2002), the observed optical and X-ray brightnesses of the individual images may not reflect the true relative macrolensing magnifications. Their brightness ratios thus are not considered a hard constraint for the lens mass model. Apart from the optical image positions, Lewis et al. (2002a) also considered the structure seen in their CO(=10) map a constraint for the lensing model. While the continuum emission underlying the CO(=10) emission in their maps is lensed into an arc and aligned with the optical emission, the CO(=10) emission appears significantly more extended. They thus assumed that the CO disk in APM 08279+5255 has to be large enough to reach out beyond the naked cusp and into the 5-image central caustic structure. The resulting lensing magnification of the optical emission is =7, and image brightness ratios of (A,B)=0.75 and (A,C)=0.75. The model reproduces the brightness ratio between images A and B (which is not subject to extreme changes) relatively well, while image C is significantly brighter than observed. The lensing magnification of the CO emission in their model is only =2.5–3. The true size of the CO disk thus is 400–1000 pc, and the CO becomes the dominant contributor to the total mass within the central kpc of the QSO. Due to the significantly lower lensing magnification factor compared to previous studies, this model predicts that APM 08279+5255 is intrinsically an extremely bright source at X-ray-to-FIR wavelengths, rather than being modestly bright.
Our new, improved high-resolution CO(=10) maps have revealed that the extended CO arc found by Lewis et al. (2002a) is a noise artifact, and that the lensed CO emission is coincident with the optical images. In contrast to the underlying, slightly more extended continuum emission, it even shows the image structure seen in the optical. Assuming that the CO emission is more compact than assumed by Lewis et al. (2002a) and lies within the region of the naked cusp, their model describes these new observations quite well. Their model then suggests that the CO-emitting region has a true radius of 350 pc or less, and has a larger magnification factor close to that of the optical emission. However, this model was derived taking the extended CO structure found by Lewis et al. (2002a) as a constraint. To find the best-fitting model to existing observations, it thus is desirable to perform a new parameter study.
5.3. Lens Modeling: New Model
In light of our new observations of APM 08279+5255, we have conducted an extensive, systematic parameter study of the lensing configurations allowed within the constraints of its observed properties. All considered models assume lensing by an inclined spiral galaxy.
As described above, multiwavelength observations of APM 08279+5255 at different epochs appear to indicate that the image ratios change, possibly due to microlensing. Thus, they cannot be considered hard constraints for the primary lens. Leaving the relative image brightnesses as free parameters, however, would sacrifice two observational constraints, and, in fact, would under-constrain most lens models. Models considered good thus are required to reproduce (A,B) relatively well (due to the relatively minor observed fluctuations), and to reproduce C as the faintest image.
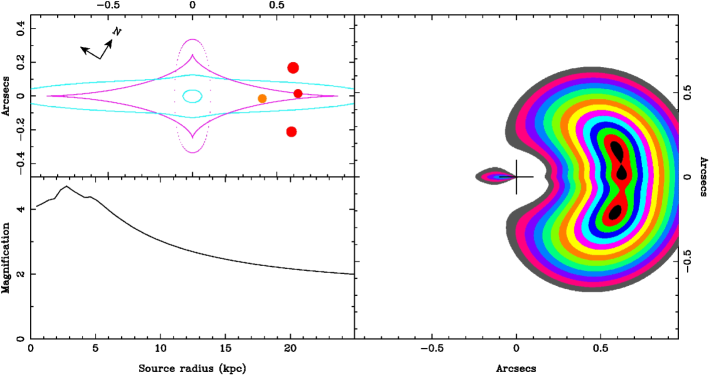
In Fig. 12, we show the model that gives the overall best fit to the observed properties at different wavelengths within our study. The highly inclined disk of the lens in this model has a projected axis ratio of only 0.09. It is truncated at an outer radius of 15 kpc, and has a rotational velocity of 140 km s-1. The top left panel of Fig. 12 shows the caustic and critical line structure, as well as the position of APM 08279+5255 in the source and image planes. The model predicts (A,B)=0.84, and (A,C)=0.57, respectively. The brightness ratio of images A and B is close to the observed value. The total magnification of a point-like source in this model is only 4.15, and thus relatively modest. The bottom left panel shows the differential total magnification as a function of the source radius. The total magnification scales down by only a factor of 2 from source radii of few pc out to 20 kpc, showing that differential lensing effects do not strongly influence the observed flux ratios. Out to 5 kpc, it varies by less than 20%. The SED shown in Fig. 8 thus is predicted to not be strongly distorted by differential lensing effects over the whole spectral range. The right panel of Fig. 12 shows the observed image configuration and overall morphology for a range of source sizes. The morphology of the CO(=10) observations is consistent with having a true source radius of 500 pc or less in this model. This is consistent with a lensing factor of 4 in Fig. 11, assuming an inclination of 30∘ and a high CO area filling factor. In the following, we will assume =550 pc and =4 for the CO(=10)-emitting region, consistent with both observations and the lensing model. The model also correctly reproduces the 2.6 mm continuum emission underlying the CO line emission, assuming that the extended continuum emission component comes from a region of about 1 kpc size. A more detailed description and analysis of the uncertainties within this model of the gravitational lensing in APM 08279+5255 will be described by G. Lewis et al. (2007, in prep.).
6. Black Hole, Gas and Dynamical Masses
6.1. Black Hole Mass
The enormous energy output that powers the huge bolometric luminosity of APM 08279+5255 is produced by a central super-massive black hole (SMBH) that is fed through an accretion disk. There are several ways to constrain the SMBH mass from observations. The most basic approach is to assume that the gradient of the radiation pressure driving gas out of the central region is exactly counterbalanced by the gravitational force attracting infall of the same material. This equality of forces provides a limiting mass for the SMBH. Assuming that dominant mechanism contributing to the opacity is Thomson scattering off free electrons (Eddington 1921) leads to:
| (9) |
Assuming = gives =2.1 10 M⊙.
Another, perhaps better constrained estimate is provided by observations of the 2–2 resonance transitions of the C3+ ion (C IV1548,1550). From reverberation mapping of nearby active galactic nuclei, Vestergaard & Peterson (2006) have found an empirical relation between the C IV1548,1550 FWHM linewidth , the rest-frame UV continuum luminosity at 1350 Å, and the mass of the central black hole:
| (10) |
From the spectrum by Irwin et al. (1998), we thus derive =9.0 10 M⊙, or about half of the Eddington limit. However, note that the reverberation-based masses underlying this equation are uncertain by a factor of about 3 (Vestergaard & Peterson 2006). Also, part of the wings of the C IV line in APM 08279+5255 are subject to strong absorption, making the derivation of the linewidth somewhat uncertain. However, the estimated width of the C IV line is similar to that of the Pa and Pa lines of hydrogen (Soifer et al. 2004). Finally, the accretion disk may be inclined toward the line of sight, which would also influence this result.
6.2. Molecular Gas Mass
To derive molecular gas masses from CO luminosities in high redshift quasars, it currently is the most common approach to adopt a well-established conversion factor for nearby ULIRGs (=0.8 M⊙(K km s-1 pc2)-1; Downes & Solomon 1998). This is justified by the fact that the observed brightness temperatures in distant quasars appear to be similar to those of local ULIRGs. However, also depends on the gas density, which appears to be much higher in APM 08279+5255. Weiß et al. (2007) thus re-derive a much higher conversion factor of 5 M⊙(K km s-1 pc2)-1 for this source. From our CO(=10) luminosity, we thus derive =5.3 10 M⊙. This corresponds to about six times (based on the C IV estimate), assuming that no significant differential lensing effects act between the scales of the SMBH and of the molecular gas reservoir. This is somewhat lower than the factor of roughly ten found by Shields et al. (2006) for a larger sample of distant gas-rich quasars, but in agreement within the large spread of observed values.
6.3. Dynamical Mass
From Newtonian mechanics, a dynamical mass can be derived for the rotating molecular disk in APM 08279+5255 (e.g., Solomon & Vanden Bout 2005):
| (11) |
where is the observed CO linewidth, and is the derived true radius of the CO disk. Using the observed CO(=10) linewidth of 556 55 km s-1 (Riechers et al. 2006), and using =550 pc, we derive sin = 4.0 1010 M⊙. This dynamical mass of the central region of APM 08279+5255 corresponds to the sum of black hole mass, gas mass, dust mass and stellar mass (plus dark matter). Assuming a gas-to-dust ratio of 150 (Weiß et al. 2007), the contribution of dust to the total mass budget is negligible. For the moment, we will also assume that the mass fraction of the stellar bulge in the central 550 pc is small, i.e., that sin(+). Assuming a face-on, unlensed disk, + would exceed the dynamical mass by a factor of 15.5, and thus is ruled out by the observations. Assuming =4, we thus find that the CO disk in APM 08279+5255 can be inclined by at most =30∘ to not exceed the dynamical mass. With = sin, this implies a rotational velocity of 1095 km s-1.
6.4. Stellar Bulge Mass Limit
As mentioned in the previous section, there is a third important constituent to the dynamical mass, i.e., the mass of the stellar bulge. This is a quantity that currently cannot be observed in the highest redshift galaxies (particularly in quasars, where the AGN outshines any stellar light from the host). However, from our observations and theoretical considerations, we can derive a limit for the mass fraction of the stellar bulge within . Carilli & Wang (2006) find that high-redshift gas-rich QSOs have a median of 300 km s-1, at a mean inclination of =13∘ (see their erratum). This corresponds to a mean rotational velocity of =1335 km s-1. Assuming that this value applies to APM 08279+5255, we derive an inclination of =25∘. Assuming sin=(+++), and a gas-to-dust ratio of 150, this corresponds to a bulge mass of =3.0 10 M⊙, or =3.4 (0.57 ; see also Tab. 6) for =4. For comparison, if a model with =100 (and thus =125 pc) that fits the data were to exist, it would give =4.4 10 M⊙, or =50 (8.4 ). This means that for low- models, the gas component dominates the total baryonic mass budget in the central region of APM 08279+5255, while for high- models, the stellar bulge is the dominant contributor.
| Component | Mass | Mass Fraction | |
|---|---|---|---|
| lensed | unlensed | ||
| [1010 () M⊙] | [1010 M⊙] | [%] | |
| Molecular Gas | 53 | 13 | 57.4 |
| Dust | 0.35 | 0.09 | 0.4 |
| Black Hole | 9.0 | 2.3 | 9.7 |
| Stellar BulgeaaFraction within the radius of the CO disk. | 30 | 7.5 | 32.5 |
Note. — Here, we assume =25∘, =550 pc, and =4. Masses are uncorrected/corrected for lensing, assuming =4.
6.5. Limitations of this Analysis
The maximum CO velocity widths predicted by the Carilli & Wang (2006) unified model exceed the rotational velocities of the most rapidly rotating nearby giant ellipticals by about a factor of 2. This may suggest that the observed linewidths in the systems with broader but not multiply peaked CO lines are not due to rotationally supported disks, but possibly in a later stage of a major merger where the disk is not self-gravitating yet. In that case, the mean inclination of quasar host galaxies derived by Carilli & Wang may overpredict the rotational velocities for gravitationally bound molecular disks. This is of particular concern for APM 08279+5255, as its CO velocity width is already the highest observed among the distant quasars. If the measured CO linewidth was that of a gravitationally bound disk and representative for the rotational velocity inside a present day giant elliptical, the inclination could not be much lower than =60∘. This leaves a factor of 2–3 discrepancy in the estimate relative to the =30∘ solution.
The uncertainties in the luminosity-based mass estimates are a factor of a few. Together with the uncertainties in disk size and lensing factor, and the contribution of dark matter to the mass budget, the real inclination of the molecular disk remains uncertain (as only a factor of 3–4 difference exists between high and low inclination solutions). Due to the degeneracy of area filling factor and inclination, our results thus are still in agreement with those of Weiß et al. (2007) within conservative error estimates, even with the new morphological constraints.
7. On the Radio–Far-Infrared Correlation
In the local universe, star-forming galaxies follow a tight correlation between the monochromatic radio continuum luminosity at 1.4 GHz and the far-infrared luminosity (), which holds over more than 4 orders of magnitude (e.g., Condon et al. 1991; Condon 1992; Yun et al. 2001; Bell 2003). This correlation is probably due to coupling between infrared thermal dust emission due to heating by young stars and non-thermal radio synchrotron emission from supernova explosions and SNRs (e.g., Helou et al. 1985), and constitutes the basis for the Condon model described above. The radio–FIR correlation can be expressed via the so-called -parameter (Helou et al. 1985):
| (12) |
The apparent FIR luminosity of APM 08279+5255 is =(2.0 0.5) 10L⊙ (Beelen et al. 2006; Weiß et al. 2007). We thus obtain =2.03, a value which falls well within the range of values found for IRAS galaxies (Yun et al. 2001), and consistent with the values found for other dust and gas-rich high- quasars (Carilli et al. 2004; Beelen et al. 2006; Wang et al. 2007). A common interpretation of a value close to the radio-FIR correlation is that star formation is the dominant process to power both the radio and FIR emission. However, using the dust model of Weiß et al. (2007), our analysis of APM 08279+5255 has shown that the AGN may power the dominant fraction of both the FIR and the radio emission. We obtain this conclusion based on the fact that the SED of APM 08279+5255 cannot be fitted with a simple Condon model (which motivates the star formation interpretation of the radio-FIR correlation). We thus conclude that caution has to be used when interpreting the properties of dust and gas-rich high- quasars based on the radio-FIR correlation alone.
8. Discussion
The observed properties of APM 08279+5255 are undoubtedly peculiar. It thus is important to understand whether this peculiarity is due to a rare lens configuration, possibly leading to very high lensing magnification factors and significant differential lensing effects, or whether APM 08279+5255 is a source that is just moderately magnified by gravitational lensing and thus intrinsically extreme.
8.1. Multiwavelength Properties of APM 08279+5255
APM 08279+5255 shows broad absorption lines in the optical/UV, and emission from high excitation lines like C IV and N V close to the central nucleus (Irwin et al. 1998), kinematically blueshifted relative to the molecular gas and C I emission by about 2500 km s-1 (Downes et al. 1999; Wagg et al. 2006). The quasar also shows relativistic X-ray broad absorption lines from even higher emission lines of iron from gas situated within the UV BAL region (Chartas et al. 2002; Hasinger et al. 2002). The BALs come from an outflow of highly ionized gas from the accretion disk, mostly driven by radiation pressure. This outflow distributes the accretion disk material over the central region of the quasar, and out into the host galaxy. The X-ray BAL region is likely a dust-free, high column density absorber responsible for shielding, as indicated by the detection of an iron K-shell absorption edge (Hasinger et al. 2002). This shielding is responsible for the typical X-ray faintness of BAL QSOs. The X-ray luminosity alone thus is not a good measure for the energy output of APM 08279+5255. The detection of strong iron lines also indicates that the X-ray BAL emission comes from significantly metal-enriched gas with possibly super-solar metallicities. While this strongly indicates that the gas has already been processed in a starburst cycle, it is biased toward the very central region (possibly 0.1 pc). It thus cannot be assumed ad hoc that the metallicity is super-solar over the whole scale of the galaxy. The continuum X-ray emission in APM 08279+5255 has a photon index that is in qualitative agreement with a radio-quiet quasar (RQQ). The optical/IR shape of the SED is also consistent with APM 08279+5255 being a RQQ. Even more so, it follows the radio-quiet locus of the radio–FIR correlation, which indicates that the copious amounts of dust in this source may be heated to a significant fraction by newly formed young stars, while the radio synchrotron emission may originate from supernova remnants (Irwin et al. 1998; Beelen et al. 2006). However, our analysis of the radio and dust properties indicates that most of the radio/FIR emission may well be AGN-related. Within the unified theory of AGN galaxies, the smoothness of the IR spectrum, in particular the lack of a pronounced IR peak, indicates that the accretion disk in this radio-quiet quasar is seen close to face-on (Soifer et al. 2004). This agrees well with the enormous optical brightness and the flatness of the optical spectrum (Irwin et al. 1998; Egami et al. 2000), indicating a lack of obscuration and thus an angle of view which clearly lies within the ionization cone. The hot dust in the parsec-scale accretion disk is heated by the central AGN, and extends outwards into a warm dusty torus, extending out to 100 pc scales.
The luminous AGN in APM 08279+5255 is the dominant power source out to large scales, which even may generate a large fraction of the huge (far-)infrared luminosity in this source by heating the dust.131313It is important to note that, due to the unique properties of APM 08279+5255, additional diagnostics are desirable to undoubtedly disentangle the heating sources of the gas and dust. The apparent FIR luminosity of APM 08279+5255 is =(2.0 0.5) 10L⊙ (Beelen et al. 2006; Weiß et al. 2007). Weiß et al. (2007) have found that about 90% of the FIR luminosity are due to emission from warm 220 K dust which may be powered by the AGN, while only 10% are due to colder 65 K dust that is likely heated by star formation. This would explain why a significant fraction of the dust in APM 08279+5255 on extended (100s pc) scales is warmer than in typical ULIRGs, or even other high-, dust-rich QSOs. It would also explain why APM 08279+5255 is an outlier on the – relation (Riechers et al. 2006), which is set by galaxies where the FIR luminosity is dominated by heating from star formation. Subtracting the 90% of that may be powered by the AGN, APM 08279+5255 follows the – relation quite well. However, note that even though the apparent FIR luminosity of APM 08279+5255 is extreme, this would indicate that only 3% of the total quasar power (as measured by ) are re-emitted in the FIR wavelength regime (assuming no differential lensing effects play into the ratio). We find that up to 80–90% of the radio luminosity in APM 08279+5255 may be powered by the AGN, and only 10–20% by the starburst. Due to the fact that this ratio is similar to that found for the FIR luminosity, APM 08279+5255 still follows the radio–FIR correlation for star-forming galaxies.
APM 08279+5255 thus is a radio-quiet, optically luminous dust-rich quasar in which the central accretion disk and dust torus are likely seen close to face-on (note however the above concern about the inclination). Its high FIR luminosity can be explained by dust heating of the AGN, as can be the high temperature of the dust. It even explains the high CO excitation if the molecular gas is situated in a rather compact (and thus dense) circumnuclear ring seen at a low inclination toward the line of sight, just like the central region. The high dust and gas temperatures and relatively high densities also explain the exceptional HCN (and HCO+) excitation in this system, as IR-pumping via the =1 vibrational bending mode becomes efficient at such high temperatures (Weiß et al. 2007). Without shielding and self-shielding, the gas and dust would be even warmer than observed. Assuming that only the fraction of re-radiated in the FIR reaches out to the molecular regions, the temperature at a radius of 125 pc would still be 200 K. Even at 550 pc, the temperature would not drop significantly below 100 K. The LVG-predicted temperatures for the cool, dense gas component ( K) thus require self-screening if the gas is indeed located in a 550 pc region around the AGN.141414Due to the fact that and , the =4 model requires more screening than the previous =100 models. Note that all the above may be considered extreme (i.e., rarely observed). However, all of these effects can be explained physically without assuming extreme and/or differential lensing effects. The CO luminosity in APM 08279+5255 is relatively modest (compared to other high- sources) even without correcting for lensing. If is corrected assuming a lensing magnification factor of only 4, as suggested by our new model, it is not the highest observed value even without correcting for AGN heating. Both and are higher for the =4.7 quasar BR 1202-0725, which is thought to be unlensed, but undergoing a massive, gas-rich merger event151515Both the CO and FIR emission in BR 1202-0725 are however distributed over at least two distinct components, which then each have comparable but lower luminosities than APM 08279+5255. (Carilli et al. 2002; Riechers et al. 2006).
8.2. The Black Hole in APM 08279+5255
Correcting for =4 predicts =2.3 1010 M⊙ for APM 08279+5255. This appears to be extreme compared to more typical SMBH masses of a few times 109 M⊙ of high- quasars. However, comparable or even higher black hole masses are found for BRI 1335-0417 (=4.41) and BR 1202-0725 (however, the estimates for these sources are based on strongly absorbed C IV emission lines; Storrie-Lombardi et al. 1996; Shields et al. 2006). Moreover, Vestergaard (2004) has found that for the range of black hole masses, an upper envelope of 1010 M⊙ is observed over a large range in redshift (46 for her sample). So, again, while APM 08279+5255 appears relatively extreme, even its AGN properties are far from being unique in a scenario assuming only =4. The extreme optical luminosity may then be explained by a luminous AGN episode of such a few times 1010 M⊙ SMBH, which accretes at (super-)Eddington rates (within the uncertainties of the BH mass estimators). Also, the formation of such a SMBH at the high mass end of the BH mass function by a redshift of 4 is consistent with ‘downsizing’, which predicts that such high mass black holes form at the high density peaks at high redshift, and are built up rapidly by vigorous accretion (e.g., Di Matteo et al. 2007). Due to the fact that the SMBH in APM 08279+5255 is among the most massive black holes that are observed, it is likely to end up as a central cD galaxy of a massive cluster. For such galaxies, recent cosmological simulations suggest that a large fraction of the mass of the black hole grows from mergers with other black holes rather than being accreted by a single progenitor black hole (Sijacki et al. 2007).
8.3. The Stellar Bulge of APM 08279+5255
In addition to , we were also able to derive a limit on the mass of the stellar bulge () for APM 08279+5255. However, our dynamical mass estimate, which is used as the predictor for , is only valid for the inner region of the galaxy where the bulk of the molecular gas is found. For the =4 model, this describes a region with a radius of 550 pc. For galaxies with 109 M⊙ used in local studies of the – relation, it has been found that the host galaxies are typically giant elliptical galaxies with effective radii of 1.5–8 kpc (Tremaine et al. 2002; Faber et al. 1997). Assuming that the volume density of stellar luminosity (and thus mass) flattens with radius from to in the inner region of the elliptical host galaxy (Gebhardt et al. 1996), or even that it flattens into a ‘core’, a significant fraction of the bulge mass is expected to be found inside the inner 550 pc. From the local – relationship, it is expected that 700 . For the inner region of APM 08279+5255, we have found =3.4 . Although uncertain within a factor of a few, this value falls short by more than two orders of magnitude compared to the local estimate. Even if corrected for a 10 kpc radius host galaxy, a clear offset from the local – relationship remains161616Note that the local – relationship is difficult to reconcile even with a =100 model, which leaves more room for within (i.e., =50 ), but also has to assume host galaxy size relations for less massive black holes.. This is consistent with what is found for other quasars at even higher redshift studied with the same technique (Walter et al. 2004; Riechers et al. 2008a, 2008b; see also discussions by Shields et al. 2006; Ho 2007). Based on different techniques, similar trends are found for various galaxy samples at low and intermediate redshift (e.g., Peng et al. 2006; McLure et al. 2006; Woo et al. 2006; Salviander et al. 2007). This may indicate a breakdown of the local – relationship toward high redshift, and that the mass correlation between SMBHs and their stellar bulges is not a universal property, but rather an endpoint of a long-lasting evolutionary process throughout cosmic times. We thus conclude that the SMBH in APM 08279+5255 appears to already be largely in place, while the buildup of the stellar bulge is still in progress.
8.4. A Possible Evolutionary Scenario for APM 08279+5255
If the assumptions made to derive the properties of APM 08279+5255 are correct, this result has several interesting implications. It appears as if SMBH growth and formation through gas dissipation and accretion (and possibly mergers) was the main characteristic during the early formation of this source (even relative to star formation). Since the SMBH in APM 08279+5255 is already found at the high mass end of the black hole mass function, it is expected that most of the molecular gas present at =3.9 is either blown out or formed into stars by =0, while only a minor fraction is accreted onto the black hole. Moreover, if APM 08279+5255 is to evolve into a galaxy that fulfills the – relation by =0, a significant fraction of the molecular gas has to actually end up in stars. In fact, even if the whole amount of molecular gas that is currently present in the host galaxy of APM 08279+5255 were to be converted into stars by =0, it would not be sufficient to reach the local – relation. If our picture of this galaxy is correct, this result implies that the buildup of the stellar bulge cannot be accomplished by only converting the observed molecular gas reservoir into stars, but relies to a significant part on the accumulation of stellar matter via other mechanisms, and/or the the accretion of additional star-forming material. Although further details are difficult to quantify at present, it thus is likely that a significant fraction of the spheroid will be produced via major and minor mergers (which are also required for the re-distribution of angular momentum). It has been suggested that a common, growth-limiting feedback mechanism acting on both star formation and black hole assembly is the physical explanation for the local – relation. Assuming that such a mechanism exists, quasar winds as a form of AGN feedback would be an obvious candidate for a system like APM 08279+5255 (Silk & Rees 1998). One difficulty with this assumption would then be that the SMBH in this source already accretes radiatively highly efficiently at (super-)Eddington rates (see above), where such feedback effects to regulate the further growth of the SMBH are expected to be very strong. If this effect were to also regulate star formation in the host galaxy, it would be expected to shut off both on a relatively short timescale by pushing the remaining gas outwards. The build-up of the stellar bulge then can only proceed further through hierarchical merging and/or accretion of additional gas, which is expected to again feed both the SMBH and star formation. To end up anywhere near the local – relation through a self-regulated mechanism, APM 08279+5255 thus is required to form and/or accumulate stars more efficiently (relative to the black hole feeding/merger rate) than in the past. One possibility to build up stellar mass while avoiding significant SMBH growth may be through subsequent ‘dry’ mergers (e.g., Rines et al. 2007), which may act in combination with other processes to assemble the massive host of APM 08279+5255 by =0.
8.5. Our Current Picture of APM 08279+5255
There are two main points that support the =4 lensing model proposed for APM 08279+5255. First, the observed CO(=10) properties give rather tight constraints on the allowed combinations of intrinsic CO disk size and magnification strength for the favoured range of low disk inclinations, assuming a relatively high CO area filling factor. The =4 model lies well within the range of these constraints. Second, the spatially resolved multiwavelength observations of APM 08279+5255 show similar morphologies of the lensed source from the X-ray to radio wavelength regime, probing sub-pc to hundreds of pc scales, while showing a different morphology out to kpc scales. The =4 model produces this quite naturally, predicting modest effects of differential lensing. The high lensing magnification models suggested so far do not reproduce the second characteristic. Also, for low inclinations, they predict a very compact CO disk of only about 100 pc radius. This is by a factor of a few less than in typical ULIRGs (Downes & Solomon 1998). The =4 model, on the other hand, produces a CO disk of 550 pc radius, which is in a more typical regime.
While some properties of APM 08279+5255, like the optical luminosity and expected strong tidal forces from the black hole, as well as the requirement of significant shielding of the molecular gas, may still favour a scenario in which the source is highly magnified by gravitational lensing, there thus are several arguments that favour models with low . It however is important to note that, if a high- model was to be found that fits the observed morphological properties of APM 08279+5255 (see Krips et al. 2007 for a recent attempt), further studies would be necessary to exclude one scenario or the other. Based on the existing observations, no definitive conclusion can be drawn – the final decision can only be made by detecting the lens itself. The lensing model presented in this paper aids in developing a quite consistent picture of APM 08279+5255 based on the existing observations, describing the source as a dust and gas-rich galaxy with a very massive, active black hole. The deep gravitational potential of the central region of this source causes the molecular gas to be rather dense, while the strong, penetrating AGN radiation causes it (and the dust) to be rather warm. The whole system may be seen relatively close to face-on (the inclination is however difficult to constrain). It has a co-eval starburst which only contributes about 10% to the FIR dust heating, but still produces more than 500 M⊙ yr-1 (Weiß et al. 2007, correcting for =4). The star formation in this galaxy takes place far off the black hole mass–bulge mass scaling relation of nearby galaxies, suggesting that the latter may be subject to significant evolution throughout cosmic times.
9. Summary
In this paper, we present improved, high resolution CO(=10) observations toward the =3.9 BAL quasar APM 08279+5255 with the VLA. We also present multiwavelength radio continuum observations, and a search for CN(=10) emission. The source’s properties are investigated based on a revised model of the gravitational lensing in this system.
From our comprehensive analysis, we obtain the following main results:
1. The CO(=10) emission is resolved and has a (lensed) source size of 0.3′′. The structure shows a morphology that is very similar to the X-ray/optical/NIR morphology, indicative of three images of a compact, gravitationally lensed source (of which two are blended in the CO maps). In particular, we do not find any evidence for extended CO(=10) emission over a scale of several arcseconds, in contrast to previous reports (cf. Papadopoulos et al. 2001). The whole single-dish CO(=10) flux found by Riechers et al. (2006) is recovered from the compact structure detected in our VLA maps. The rest-frame 2.6 mm continuum emission underlying the CO(=10) line is slightly more extended than the CO source, and may correspond to differentially lensed emission either due to free-free radiation from the starburst or extended AGN-related emission (in agreement with the overall steep spectral index). A radio source is detected 3′′ south of APM 08279+5255 in two out of six radio continuum bands (see also Ibata et al. 1999), but probably not related to the high redshift quasar.
2. We derive an apparent CO(=10) luminosity of K km s-1 pc2. This is by about 20% lower than the re-derived CO(=21) luminosity, and even by 40% lower than the CO(=43) luminosity. This may indicate that the optical depth in the lower CO transitions is only modest, as already indicated by previous studies (Riechers et al. 2006; Weiß et al. 2007). Due to the high gas density, the CO(=10) luminosity corresponds to a total apparent H2 molecular gas mass of =5.3 10 M⊙.
3. We set a limit on the CN(=10) luminosity in this source (based on GBT spectroscopy), which is 37% of the CO(=10) luminosity.
4. The radio continuum SED of APM 08279+5255 is likely dominated by AGN emission. Based on a starburst galaxy model (Condon 1992), we conclude that free-free and synchrotron emission from the host galaxy contribute 20% to the radio continuum emission (note that this fraction is clearly model-dependent). We also find that the AGN lies in the transition region between radio-quiet and radio-loud quasars, and is in overall agreement with being radio-quiet. The low frequency part of the radio SED is (ultra-)steep, which is commonly found in high- quasars with extended radio emission. The overall spectral slope of the radio SED is in agreement with synchrotron emission that may originate from both the starburst and the AGN.
5. In spite of the fact that both the FIR (Weiß et al. 2007) and radio continuum emission in APM 08279+5255 appear to be dominantly powered by the AGN, it follows the radio–FIR correlation for star-forming galaxies without correcting for the AGN contribution to the radio/FIR luminosities (80–90% in both cases). This may indicate that loyalty to the radio–FIR correlation does not necessarily imply that a galaxy’s emission is star formation dominated on an object-to-object basis.
6. From our CO maps, we derive observed brightness temperatures of 23 K for the blend of optical quasar images A+C and 13 K for quasar image B. Assuming a true brightness temperature of 50 K as predicted by LVG models of the CO excitation (Weiß et al. 2007), this corresponds to a lensed CO equivalent disk with a radius of 900 pc.
7. Our revised lensing model of APM 08279+5255 predicts that the luminosity is only enhanced by a lensing magnification factor of about =4 over the whole observed wavelength range. Assuming that the CO disk is seen relatively close to face-on (30∘) and has a large area filling factor, this model is consistent with a CO ring that has an unlensed radius of about 550 pc.
8. From C IV observations of APM 08279+5255 and a scaling relation of nearby galaxies from the literature, we derive an apparent black hole mass of =9.0 10 M⊙, which corresponds to about half of the Eddington limit. This also corresponds to about 17% of the molecular gas mass.
9. From our CO maps and model, we derive a dynamical mass of sin = 4.0 1010 M⊙ for APM 08279+5255. Assuming =4, this indicates an inclination of 30∘, consistent with observations at all wavelengths within a (limited) unified scheme. Assuming an average rotational velocity for high- quasars, this even sets a limit on the mass of the stellar bulge within the central 550 pc of =3.4 , which falls by almost two orders of magnitude short of the – relation observed for nearby galaxies (see also discussion by Weiß et al. 2007). We thus conclude that the SMBH in this distant quasar is already in place, while the buildup of the stellar bulge is still in progress. A similar indication was found for the =6.4 quasar SDSS J1148+5251 (Walter et al. 2004), the =4.1 quasar PSS J2322+1944 (Riechers et al. 2008a), and the =4.4 quasar BRI 1335-0417 (Riechers et al. 2008b), and thus suggests a breakdown of this relation at early cosmic times and/or toward the high mass end.
The observations presented herein highlight the importance of spatially and dynamically resolved studies of molecular gas in galaxies at 4 for our general picture of galaxy formation and evolution. In the next decade, the Expanded Very Large Array (EVLA) will enable us to commence such studies at improved sensitivities and spectral resolution. The low transition studies of molecular gas with the EVLA will be complemented by observations of the higher transitions with the Atacama Large (sub-)Millimeter Array (ALMA) at even higher spatial resolution. Both instruments will allow us to probe significantly deeper down the luminosity function(s) of the different populations of high redshift galaxies using molecular gas studies, and thus largely improve our picture of galaxies in the early universe.
References
- Alloin et al. (1997) Alloin, D., Guilloteau, S., Barvainis, R., Antonucci, R., & Tacconi, L., 1997, A&A, 321, 24
- Athreya et al. (1997) Athreya, R. M., Kapahi, V. K., McCarthy, P. J., & van Breugel, W. 1997, MNRAS, 289, 525
- Baker et al. (2004) Baker, A. J., Tacconi, L. J., Genzel, R., Lehnert, M. D., & Lutz, D. 2004, ApJ, 604, 125
- Bartelmann & Loeb (1998) Bartelmann, M., & Loeb, A. 1998, ApJ, 503, 48
- Barvainis & Ivison (2002) Barvainis, R., & Ivison, R. 2002, ApJ, 571, 712
- Barvainis et al. (1994) Barvainis, R., Tacconi, L., Antonucci, R., Alloin, D., & Coleman, P. 1994, Nature, 371, 586
- Beelen et al. (2006) Beelen, A., Cox, P., Benford, D, J., et al. 2006, ApJ, 642, 694
- Bell (2003) Bell, E. F. 2003, ApJ, 586, 794
- Blain et al. (2003) Blain, A. W., Barnard, V. E., & Chapman, S. C. 2003, MNRAS, 338, 733
- Bondi et al. (2007) Bondi, M., Ciliegi, P., Venturi, T., et al. 2007, A&A, 463, 519
- Brown & Vanden Bout (1991) Brown, R. L., & Vanden Bout, P. A. 1991, AJ, 102, 1956
- Burke (1981) Burke, W. L. 1981, ApJ, 244, L1
- Carilli & Holdaway (1999) Carilli, C. L., & Holdaway, M. A. 1999, Radio Science, 34, 817
- Carilli et al. (2002) Carilli, C. L., Kohno, K., Kawabe, R., Ohta, K., et al. 2002, AJ, 123, 1838
- Carilli et al. (2003) Carilli, C. L., Lewis, G. F., Djorgovski, S. G., Mahabal, A., Cox, P., Bertoldi, F., & Omont, A. 2003, Science, 300, 773
- Carilli et al. (2004) Carilli, C. L., Walter, F., Bertoldi, F., et al. 2004, AJ, 128, 997
- Carilli & Wang (2006) Carilli, C. L., & Wang, R. 2006, AJ, 131, 2763
- Chartas et al. (2002) Chartas, G., Brandt, W. N., Gallagher, S. C., & Garmire, G. P. 2002, ApJ, 579, 169
- Condon et al. (1991) Condon, J. J., Anderson, M. L., & Helou, G. 1991, ApJ, 376, 95
- Condon (1992) Condon, J. J. 1992, ARA&A, 30, 575
- Coppin et al. (2007) Coppin, K. E. K., et al. 2007, ApJ, 665, 936
- Di Matteo et al. (2005) Di Matteo, T., Springel, V., & Hernquist, L. 2005, Nature, 433, 604
- Di Matteo et al. (2007) Di Matteo, T., Colberg, J., Springel, V., Hernquist, L., & Sijacki, D. 2008, ApJ, 676, 33
- Downes & Solomon (1998) Downes, D., & Solomon, P. M. 1998, ApJ, 507, 615
- Downes et al. (1999) Downes, D., Neri, R., Wiklind, T., Wilner, D. J., & Shaver, P. A. 1999, ApJ, 513, L1
- Downes & Solomon (2003) Downes, D., & Solomon, P. M. 2003, ApJ, 582, 37
- Eales et al. (1989) Eales, S. A., Alexander, P., & Duncan, W. D. 1989, MNRAS, 240, 817
- Eddington (1921) Eddington, A. S. 1921, Zeitschrift für Physik, 7, 351
- Egami et al. (2000) Egami, E., Neugebauer, G., Soifer, B. T., et al. 2000, ApJ, 535, 561
- Ellis (2007) Ellis, R. S., in ‘First Light in Universe’, Saas-Fee Advanced Course 36, Swiss Soc. Astrophys. Astron., in press (astro-ph/0701024)
- Elvis et al. (1994) Elvis, M., Wilkes, B. J., McDowell, J. C., et al. 1994, ApJS, 95, 1
- Faber et al. (1997) Faber, S. M., et al. 1997, AJ, 114, 1771
- Ferrarese & Merritt (2000) Ferrarese, L., & Merritt, D. 2000, ApJ, 539, L9
- Frayer et al. (1998) Frayer, D. T., Ivison, R. J., Scoville, N. Z., Yun, M., Evans, A. S., Smail, I., Blain, A. W., & Kneib, J.-P. 1998, ApJ, 506, L7
- García-Burillo et al. (2006) García-Burillo, S., Graciá-Carpio, J., Guélin, M., Neri, R., Cox, P., Planesas, P., Solomon, P. M., Tacconi, L. J., & Vanden Bout, P. A. 2006, ApJ, 645, L17
- Gebhardt et al. (1996) Gebhardt, K., et al. 1996, AJ, 112, 105
- Gebhardt et al. (2000) Gebhardt, K., Bender, R., Bower, G., et al. 2000, ApJ, 539, L13
- Genzel et al. (2003) Genzel, R., Baker, A. J., Tacconi, L. J., Lutz, D., Cox, P., Guilloteau, S., & Omont, A. 2003, ApJ, 584, 633
- Graham et al. (2001) Graham, A. W., Erwin, P., Caon, N., & Trujillo, I. 2001, ApJ, 563, L11
- Graham & Driver (2007) Graham, A. W., & Driver, S. P. 2007, ApJ, 655, 77
- Greve et al. (2005) Greve, T. R., et al. 2005, MNRAS, 359, 1165
- Guélin et al. (2007) Guélin, M., Salomé, P., Neri, R., García-Burillo, S., Graciá-Carpio, J., et al. 2007, A&A, 462, L45
- Häring & Rix (2004) Häring, N., & Rix, H.-W. 2004, ApJ, 604, L89
- Hasinger et al. (2002) Hasinger, G., Schartel, N., & Komossa, S. 2002, ApJ, 573, L77
- Helou et al. (1985) Helou, G., Soifer, B. T., & Rowan-Robinson, M. 1985, ApJ, 298, L7
- Ho (2007) Ho, L. C. 2007, ApJ, 669, 821
- Ibata et al. (1999) Ibata, R. A., Lewis, G. F., Irwin, M. J., et al. 1999, AJ, 118, 1922
- Irwin et al. (1998) Irwin, M. J., Ibata, R. A., Lewis, G. F.; Totten, E. J. 1998, ApJ, 505, 529
- Ivezic (2002) Ivezić, Ž., Menou, K., Knapp, G. R., et al. 2002, AJ, 124, 2364
- Ivison (2006) Ivison, R. J. 2006, MNRAS, 370, 495
- Keeton & Kochanek (1998) Keeton, C. R., & Kochanek, C. S. 1998, ApJ, 495, 157
- Kellerman et al. (1989) Kellermann, K. I., Sramek, R., Schmidt, M., Shaffer, D. B., & Green, R. 1989, AJ, 98, 1195
- Klamer et al. (2006) Klamer, I. J., Ekers, R. D., Bryant, J. J., Hunstead, R. W., Sadler, E. M., & De Breuck, C. 2006, MNRAS, 371, 852
- Kneib et al. (2005) Kneib, J.-P., Neri, R., Smail, I., Blain, A., Sheth, K., van der Werf, P., & Knudsen, K. K. 2005, A&A, 434, 819
- Krips et al. (2007) Krips, M., Peck, A. B., Sakamoto, K., Petitpas, G. B., Wilner, D. J., Matsushita, S., & Iono, D. 2007, ApJ, 671, L5
- Laing & Peacock (1980) Laing, R. A., & Peacock, J. A. 1980, MNRAS, 190, 903
- Lewis et al. (1998) Lewis, G. F., Chapman, S. C., Ibata, R. A., Irwin, M. J., & Totten, E. J. 1998, ApJ, 505, L1
- Lewis et al. (2002a) Lewis, G. F., Carilli, C., Papadopoulos, P., & Ivison, R. J. 2002a, MNRAS, 330, L15
- Lewis et al. (2002b) Lewis, G. F., Ibata, R. A., Ellison, S. L., Aracil, B., Petitjean, P., Pettini, M., & Srianand, R. 2002b, MNRAS, 334, L7
- Magorrian et al. (1998) Magorrian, J., et al. 1998, AJ, 115, 2285
- McLure et al. (2006) McLure, R. J., Jarvis, M. J., Targett, T. A., Dunlop, J. S., & Best, P. N. 2006, MNRAS, 368, 1395
- Munoz et al. (2001) Muoz, J. A., Kochanek, C. S., & Keeton, C. R. 2001, ApJ, 558, 657
- Narayanan et al. (2006) Narayanan, D., Cox, T. J., Robertson, B., Davé, R., Di Matteo, T., Hernquist, L., Hopkins, P., Kulesa, C., & Walker, C. K. 2006, ApJ, 642, L107
- Navarro et al. (1997) Navarro, J. F., Frenk, C. S., & White, S. D. M. 1997, ApJ, 490, 493
- Oguri & Keeton (2004) Oguri, M., & Keeton, C. 2004, ApJ, 610, 663
- Papadopoulos et al. (2001) Papadopoulos, P., Ivison, R., Carilli, C. L., & Lewis, G. 2001, Nature, 409, 58
- Peacock et al. (1986) Peacock, J. A., Miller, L., & Longair, M. S. 1986, MNRAS, 218, 265
- Peng et al. (2006) Peng, C. Y., et al. 2006, ApJ, 640, 114
- Pentericci et al. (2000) Pentericci, L., Van Reeven, W., Carilli, C. L., Röttgering, H. J. A., & Miley, G. K. 2000, A&AS, 145, 121
- Pickett et al. (1998) Pickett, H. M., Poynter, R. L., Cohen, E. A., Delitsky, M. L., Pearson, J. C., & Müller, H. S. P. 1998, J. Quant. Spectrosc. Radiat. Transfer, 60, 883
- Richards et al. (2006) Richards, G. T., Lacy, M., Storrie-Lombardi, L. J., et al. 2006, ApJS, 166, 470
- Riechers et al. (2006) Riechers, D. A., Walter, F., Carilli, C. L., et al. 2006, ApJ, 650, 604
- Riechers et al. (2008a) Riechers, D. A., Walter, F., Brewer, B. J., et al. 2008a, ApJ, in press (arXiv:0806.4616)
- Riechers et al. (2008b) Riechers, D. A., Walter, F., Carilli, C. L., et al. 2008b, ApJL, in press (arXiv:0808.3774)
- Rines et al. (2007) Rines, K., Finn, R., & Vikhlinin, A. 2007, ApJ, 665, L9
- Rowan-Robinson (2000) Rowan-Robinson, M. 2000, MNRAS, 316, 885
- Rusin & Ma (2001) Rusin, D., & Ma, C.-P. 2001, ApJ, 549, L33
- Salviander et al. (2007) Salviander, S., Shields, G. A., Gebhardt, K., & Bonning, E. W. 2007, ApJ, 662, 131
- Schmidt (1963) Schmidt, M. 1963, Nature, 197, 1040
- Schmidt (1970) Schmidt, M. 1970, ApJ, 162, 371
- Schneider et al. (1992) Schneider, D. P., van Gorkom, J. H., Schmidt, M., & Gunn, J. E. 1992, AJ, 103, 1451
- Sheth et al. (2004) Sheth, K., Blain, A. W., Kneib, J.-P., Frayer, D. T., van der Werf, P. P., & Knudsen, K. K. 2004, ApJ, 614, L5
- Shields et al. (2006) Shields, G. A., Menezes, K. L., Massart, C. A., & Vanden Bout, P. 2006, ApJ, 641, 683
- Sijacki et al. (2007) Sijacki, D., Springel, V., Di Matteo, T., & Hernquist, L. 2007, MNRAS, 380, 877
- Silk & Rees (1998) Silk, J., Rees, M. J. 1998, A&A, 331, L1
- Skatrud et al. (1983) Skatrud, D. D., de Lucia, F. C., Blake, G. A., & Sastry, K. V. L. N. 1983, J. Mol. Spectrosc., 99, 35
- Soifer et al. (2004) Soifer, B. T., Charmandaris, V., Brandl, B. R., Armus, L., Appleton, P. N., Burgdorf, M. J., Devost, D., Herter, T., Higdon, J. L., et al. 2004, ApJS, 154, 151
- Solomon et al. (1992) Solomon, P. M., Radford, S. J. E., & Downes, D. 1992, Nature, 356, 318
- Solomon & Vanden Bout (2005) Solomon, P. M., & Vanden Bout, P. A. 2005, ARA&A, 43, 677
- Spergel et al. (2003) Spergel, D. N., Verde, L., Peiris, H. V., et al. 2003, ApJS, 148, 175
- Spergel et al. (2007) Spergel, D. N., Bean, R., Doré, O., et al. 2007, ApJS, 170, 377
- Springel et al. (2005) Springel, V., Di Matteo, T., & Hernquist, L. 2005, MNRAS, 361, 776
- Storrie-Lombardi et al. (1996) Storrie-Lombardi, L. J., McMahon, R. G., Irwin, M. J., & Hazard, C. 1996, ApJ, 468, 121
- Tacconi et al. (2006) Tacconi, L. J., Neri, R., Chapman, S. C., Genzel, R., Smail, I., Ivison, R. J., Bertoldi, F., Blain, A., Cox, P., et al. 2006, ApJ, 640, 228
- Tremaine et al. (2002) Tremaine, S., et al. 2002, ApJ, 574, 740
- Turner et al. (1998) Turner, J. L., Ho, P. T. P., & Beck, S. C. 1998, AJ, 116, 1212
- Vestergaard (2004) Vestergaard, M. 2004, ApJ, 601, 676
- Vestergaard & Peterson (2006) Vestergaard, M., & Peterson, B. M. 2006, ApJ, 641, 689
- Wagg et al. (2005) Wagg, J., Wilner, D. J., Neri, R., Downes, D., & Wiklind, T. 2005, ApJ, 634, L13
- Wagg et al. (2006) Wagg, J., Wilner, D. J., Neri, R., Downes, D., & Wiklind, T. 2006, ApJ, 651, 46
- Wang et al. (2007) Wang, R., Carilli, C. L., Beelen, A., et al. 2007, AJ, 134, 617
- Walter et al. (2004) Walter, F., Carilli, C., Bertoldi, F., et al. 2004, ApJ, 615, L17
- Weiß et al. (2007) Weiß, A., Downes, D., Neri, R., et al. 2007, A&A, 467, 955
- White et al. (1997) White, R. L., Becker, R. H., Helfand, D. J., & Gregg, M. D. 1997, ApJ, 475, 479
- Winn et al. (2004) Winn, J. N., Rusin, D., & Kochanek, C. S. 2004, Nature, 427, 613
- Woo et al. (2006) Woo, J. H., Treu, T., Malkan, M. A., & Blandford, R. D. 2006, ApJ, 645, 900
- Yun et al. (2001) Yun, M. S., Reddy, N. A., & Condon, J. J. 2001, ApJ, 554, 803
- Yun & Carilli (2002) Yun, M. S., & Carilli, C. L. 2002, ApJ, 568, 88