11email: eugeniadiazz@gmail.com, hernan@oac.uncor.edu 22institutetext: IAG, USP. Rua do Matão 1226, São Paulo. Brazil
22email: oliveira@astro.iag.usp.br
Fossil Groups in the Millennium Simulation
Abstract
Context.
Aims. We create a catalogue of simulated fossil groups and study their properties, in particular the merging histories of their first-ranked galaxies. We compare the simulated fossil group properties with those of both simulated non-fossil and observed fossil groups.
Methods. Using simulations and a mock galaxy catalogue, we searched for massive ( 5 10) fossil groups in the Millennium Simulation Galaxy Catalogue. In addition, attempted to identify observed fossil groups in the Sloan Digital Sky Survey Data Release 6 using identical selection criteria.
Results. Our predictions on the basis of the simulation data are: (a) fossil groups comprise about 5.5% of the total population of groups/clusters with masses larger than 5 x 10. This fraction is consistent with the fraction of fossil groups identified in the SDSS, after all observational biases have been taken into account; (b) about 88% of the dominant central objects in fossil groups are elliptical galaxies that have a median R-band absolute magnitude of , which is typical of the observed fossil groups known in the literature; (c) first-ranked galaxies of systems with 5 x 10, regardless of whether they are either fossil or non-fossil, are mainly formed by gas-poor mergers; (d) although fossil groups, in general, assembled most of their virial masses at higher redshifts in comparison with non-fossil groups, first-ranked galaxies in fossil groups merged later, i.e. at lower redshifts, compared with their non-fossil-group counterparts.
Conclusions. We therefore expect to observe a number of luminous galaxies in the centres of fossil groups that show signs of a recent major merger.
Key Words.:
Methods:N-body simulations– Methods:statistical– Galaxies:clusters:general– Galaxies:evolution1 Introduction
Jones et al. (2003) identified fossil groups as spatially extended X-ray sources with an X-ray luminosity whose optical counterpart was a bound system of galaxies with mag, where was the difference in absolute magnitude in R-band between the brightest and the second brightest galaxies in the system within half the projected virial radius (). The dynamical masses of the systems studied so far are comparable to those of rich clusters () (Mendes de Oliveira et al. 2006; Cypriano et al. 2006; Mendes de Oliveira & et al. 2008; Khosroshahi et al. 2006). Fossil groups may be of considerable importance as the place of formation of a significant fraction of all giant ellipticals. Beside minor differences in the definition of fossil groups, their incidence rate was estimated by observational, analytical, numerical, and semi-analytical analyses. Vikhlinin et al. (1999) and Jones et al. (2003) stated that fossil groups represent (8-20)% of observed systems in the same mass range. van den Bosch et al. (2007) used the 2dF Galaxy Redshift Survey data to measure a fossil fraction of 6.5% among groups with masses . Milosavljević et al. (2006) estimated analytically that fossil groups represent 5-40% of groups with masses in the range , while the percentage decreased to 1-3% for groups of mass larger than , the latter result having been confirmed using the photometric Sloan Digital Sky Survey Data Release 2 (SDSS DR2). Numerical simulations by D’Onghia et al. (2005) predicted a higher fraction of fossil systems (33%) amongst groups of mass . von Benda-Beckmann et al. (2007), also using numerical simulations, found that 24% of groups with masses in the range were fossil groups. From semi-analytical models, Sales et al. (2007) estimated that fossil groups represent of groups with masses , while Dariush et al. (2007) stated that of groups in that mass range were fossil systems and predicted that this percentage decreased to 3-4 % for X-ray rich systems.
A natural question is whether the large magnitude difference between the first and second ranked galaxies (M 2 in the R-band), characteristic of these groups, implies that they are a distinct class of objects or if they instead represent a tail of the cluster (hereafter non-fossil group) distribution. To investigate this question, D’Onghia et al. (2005) used high-resolution N-body/hydrodynamical simulations to compare four simulated fossil and eight non-fossil groups, all of virial masses close to . They found that the values of the magnitude gap, M12, for the 12 systems, were correlated with the halo assembly time, such that fossil groups assembled earlier than non-fossils. Similarly, Dariush et al. (2007) concluded, by the study of fossil groups in the Millennium Simulation, that fossils assemble a higher fraction of their masses at higher redshifts than non-fossil groups. The most accepted scenario for fossil groups is then that they are not a distinct class but, are instead, examples of groups/clusters that collapsed early.
Although fossil groups in general do not appear differ from galaxy clusters of similar masses, except for their earlier times of formation, it was realised, observationally, that the first-ranked galaxies in fossil and non-fossil groups differ in some respects. First, their shapes differ: while fossil, first-ranked, galaxies are often disky, brightest cluster galaxies are often boxy (Khosroshahi et al. 2006). Second, their stellar populations are dissimilar: fossil group first-ranked galaxies are not as old as brightest cluster galaxies (de la Rosa & et al. 2008). These findings motivated us to revisit the study of Dariush et al. (2007) of fossil groups in the Millennium Simulation, but now focusing on the properties of the first-ranked galaxies (as opposed to the complete system). By searching in the Millennium Simulation, we created two samples, one of fossil groups with M (in the R-band) and a second control sample of non-fossil groups with systems with M. Both the simulations themselves and a mock catalogue were used to complete these searches. In addition, we searched for fossil groups in the Sloan Digital Sky Survey Data Release 6 (SDSS DR6) (Adelman-McCarthy & et al. 2008) using the same criteria, to compare with the mock catalogue as a test of the semi-analytic model and also to examine observationally the results of our searching algorithm.
The layout of this paper is as follows. In Sect. 2 we briefly describe the galaxies in the Millennium Simulation, and the search for simulated fossil and non-fossil groups. Section 3 contains a comparison between fossil and non-fossil groups, and simulated and observed fossils. In particular, we discuss the implications of these results for the evolution of first-ranked galaxies in fossil groups. In Sect. 4 we describe the construction of a mock catalogue and the procedures of group identification. We also perform an identification of fossil groups in SDSS DR6 and compare the results with those obtained from the mock catalogue. Finally, we summarise the paper in Sect. 5.
2 Construction of the Simulated Fossil Group Sample
2.1 Dark Matter Particles and Galaxies
The Millennium Simulation is the largest completed cosmological Tree-Particle-Mesh (TPM, Xu (1995)) -body simulation (Springel et al. 2005), which evolved 10 billion () dark matter particles of mass within a periodic box of on a side, using a comoving, softening length of .111The Millennium Simulation, developed by the Virgo Consortium, is available at http://www.mpa-garching.mpg.de/millennium The cosmological parameters of this simulation correspond to a standard cosmological model (CDM): , , , and . The merging history trees were stored for 60 output times separated by time intervals given by . These are the basic inputs required by the semi-analytic model.
We use a run of De Lucia & Blaizot (2007)’s semi-analytic model to extract galaxies with positions, velocities, as well as absolute magnitudes (in five photometric bands, BVRIK) and stellar masses, among other quantities. In this model, the branches of the halo merger tree are followed forward in time, and several astrophysical processes are included such as gas infall and cooling, reionization of the Universe, star formation, black hole growth, AGN and supernova feedback, galaxy mergers, and spectro-photometric evolution. The final output at produced galaxies with absolute magnitudes and stellar masses larger than . This version of the semi-analytic model provides an improved fit to the bright end of the galaxy luminosity function, compared with former model developed by Croton et al. (2006). This sample is called Millennium Simulation Galaxy Catalogue (MSGC hereafter).
The cosmological parameter set used in the Millennium Simulation was that inferred from the first-year WMAP (Wilkinson Microwave Anisotropy Probe Observations, Spergel et al. 2003). Differences in the cosmological parameter sets corresponding to the and -year WMAP (Spergel et al. 2007) (mainly in , , ) produced a significant delay in structure formation in the WMAP3 case, and the number of halos drawn for the WMAP1 cosmology to be higher. However, Wang et al. (2008) investigated the implications of this delay for the observed properties of galaxies. They compared results obtained from a simulation for the cosmological parameters of WMAP1 plus a semi-analytic model (such as MSGC) with those for a simulation for the cosmological parameters of WMAP3 plus a semi-analytic model. They found that the luminosity functions, correlation functions, and Tully-Fisher relations were almost identical in both cases. They stated that the galaxy clustering and other observable properties were far more sensitive to the galaxy formation physics than to the cosmological parameters; the semi-analytic parameters then may be able to compensate for the delay in structure formation producing galaxy populations at z=0 that agree with observations. Wang et al. (2008) also concluded that substantial differences between the models appear at redshifts higher than 2, which are beyond the scope of this paper.
2.2 FoF galaxy halos
Since we were interested in studying fossil groups in the MSGC, we identified galaxy halos by using a standard method. Groups of galaxies in the MSGC were identified by using a Friends-of-Friends (FoF) algorithm in real space (Davis et al. 1985) with a linking length of 0.2 of the mean particle density, which corresponds to an overdensity of 200. We checked that all galaxies given in a galaxy halo belonged to the same DM halo.
Finally, only groups of galaxies with more than members were selected We refer to these groups hereafter as FoF galaxy groups (or halos).
For all FoF galaxy groups, we compute the velocity dispersion, virial radii, and virial theorem masses. The value of the virial theorem mass was computed to be:
| (1) |
where is the harmonic mean projected separation, given the projected separations (see eq. [10–23] of Binney & Tremaine 1987). The virial radius is and the 3-D velocity dispersions were calculated in the MSGC by using the peculiar velocities
2.3 The Sample of Fossil Groups
| Property | MSGC | Mock Catalogue | SDSS DR6 |
|---|---|---|---|
| # | |||
Notes: # number of fossil groups, : virial mass of the FoF galaxy group, : velocity dispersion of the FoF galaxy group, : virial radius of the FoF galaxy group, : rest frame R-band absolute magnitude of the brightest galaxy within of the FoF galaxy group, : stellar mass of the brightest galaxy.
In this case it is in the r-band. k+e corrections are computed from Blanton et al. (2003)
To represent fossil groups, we selected FoF galaxy groups with masses larger than , which contained galaxies with a magnitude distribution displaying a gap M 2 (in the R-band), when considering objects within a radius of . The adopted lower limit to the group mass () ensured that the fossil groups chosen were also X-Ray fossils, according to the work of Dariush et al. (2007).
In the MSGC, FoF galaxy halos satisfy the fossil criteria, which represent of the FoF galaxy groups in the studied mass range. The median properties of these groups are quoted in Table 1.
2.4 The Sample of Non-Fossil Groups
The principal aim of this paper is to compare the properties of fossil and non-fossil groups. Dariush et al. (2007) analysed the differences between fossil and non-fossil systems by concentrating on the global properties of the groups. In this work, we intend to go further to not only confirm their findings but also extend their analyses to the brightest galaxies in these systems. We constructed a control sample of non-fossil groups, using the similar criteria to that used for fossil groups in the MSGC but with the one difference that the magnitude gap between the brightest and second brightest galaxies within was less than (for the fossil groups this had to be larger than 2 magnitudes). The control sample comprises FoF galaxy halos.
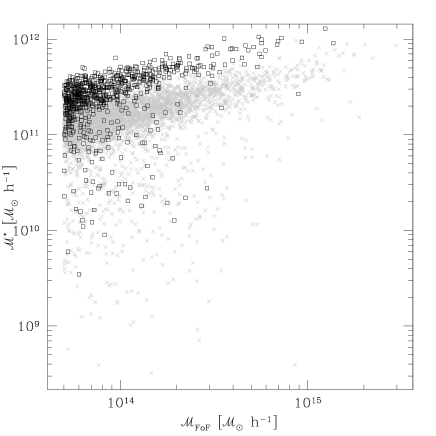
Figure 1 shows a plot of stellar masses versus FoF masses for both fossil (squares) and control (crosses) samples. To avoid inferring results dependent on the mass of the brightest galaxies (De Lucia et al. 2006) from the control and the fossil samples, we selected subsamples with approximately equal numbers of fossil and non-fossil groups, where the distribution of stellar masses of the central galaxies had been matched. This exercise provided two samples of fossil and non-fossil groups each with about 680 objects. We note that by insisting that the distributions of stellar masses of the central galaxies were identical for the two samples, the virial masses of the groups themselves were, on average, smaller for fossil than for non-fossil groups. This effect can be seen in Fig. 1 if we match the y-axis distributions. However, this procedure is justified since we were interested in the properties of the first-ranked galaxies only.
3 The brightest group galaxies
3.1 The formation and evolution
Given the availability of merger trees of galaxies in the Millennium Simulation, it is possible to study the formation and evolution of central galaxies in groups. De Lucia et al. (2006) and De Lucia & Blaizot (2007) studied the evolution of galaxies of different stellar mass. They defined a set of particular times related to formation and evolution of galaxies. Following their work, we analyse the properties of the central galaxies of fossil and non-fossil groups, both samples having the same stellar mass distributions. Briefly, the different times are defined as follows:
-
•
Assembly time () is the time when of the final stellar mass was already contained in a single galaxy.
-
•
Formation time () is the time when half of the mass of the stars contained in the final galaxy at redshift zero have already formed.
-
•
Identity time () is the time when the latest major merger occurred ( major merger is adopted as ( ) ).
-
•
Extended identity time () is the latest time when the sum of the masses of all progenitors merging at that time was greater than a third of the mass of the main progenitor (multiple simultaneous minor mergers).
| Fossil | Non-Fossil | K-S | |
|---|---|---|---|
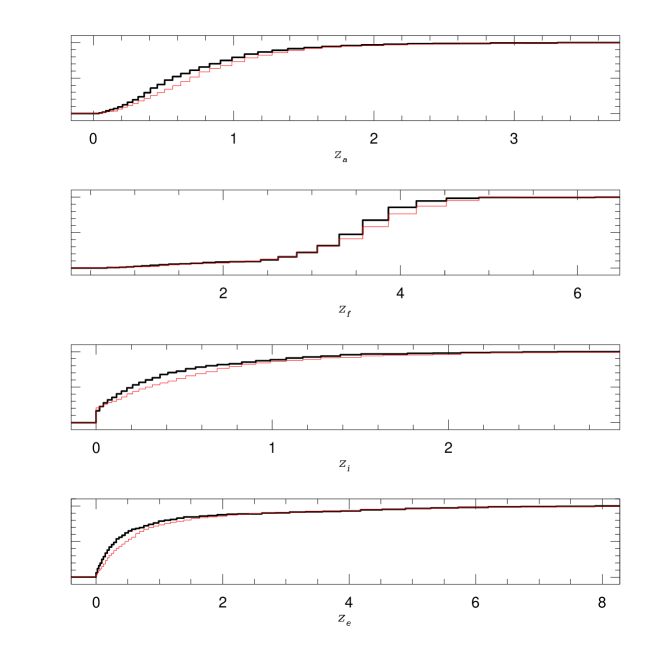
We compute all of these times for the brightest galaxies in fossil and non-fossil groups, and also the assembly time of the FoF halos. In Table 2, we show the median of the different characteristic times and also include the probabilities that both distributions, for fossil and non-fossil groups, are drawn from the same distribution (Kolmogorov-Smirnov test (K-S test)). K-S tests indicate significant differences in all cases. However, given the shape of the distributions, in some cases the median value is insufficient to show these differences (for instance, when the median of in both samples is the same), therefore, in Fig. 2, we show the cumulative distributions of times in Fig. 2. Thick lines correspond to fossil groups, while thin lines are for non-fossil groups. Brightest galaxies of fossil groups have (a) assembled, (b) formed their stars, (c) experienced their last major merger and (d) experienced multiple simultaneous mergers, all at lower redshifts than bright central galaxies in non-fossil groups. In addition, we confirm that the FoF halos of fossil groups assembled earlier than non-fossil groups.
To check if the fact that we are analysing fossil and non-fossil groups with different halo mass ranges could introduce any bias, we repeated the process described above by matching the distributions of group virial masses for fossil and non-fossil groups. We then succeeded in reproducing all of the results described by Dariush et al. (2007), in particular, that fossil groups in general, assembled earlier than non-fossil groups, for a given range of group virial masses. We also found that central galaxies in fossil groups have assembled, and experienced both their last major merger and multiple mergers all at lower redshifts than the central galaxies in non-fossil groups, but they have formed their stars at higher redshifts. This result resembles the analysis of De Lucia et al. (2006) since by matching the virial masses of the groups, the resulting sample of fossil groups have central galaxies with stellar masses typically larger than those of non-fossil groups.
Regardless of whether either the stellar masses of the central galaxies or the virial masses of the halos are matched, although the FoF galaxy halos of fossil systems have assembled earlier (Dariush et al. (2007); D’Onghia et al. (2005), confirmed in this work using an independent semi-analytic model), their central galaxies have, on average, assembled later and, even more importantly, first-ranked galaxies of fossil groups also continue to experience major mergers for a longer period of time than in non-fossil systems.
3.2 The morphologies and morphological mix during the last major merger
The criteria used to select fossil groups did not include any constraints on the morphological type of the first-ranked galaxy. However, it is interesting to study whether the first-ranked galaxy has any tendency to be an early-type galaxy.
We must consider the shortcomings of the semi-analytic models when we attempt this analysis given that, historically, most semi-analytic models have failed to reproduce some trends, although the new versions are fairly good at reproducing many observational results related to morphology (see Bertone et al. 2007). However, it is still interesting to observe general trends, defining morphology as completed by De Lucia et al. (2006). A galaxy is classified as elliptical if ( in the B-band), spiral if and S0 in between. These authors state that this morphological type determination is robust for galaxies with stellar masses larger than a few times . As can be observed from Table 1, we are dealing with galaxies beyond this limit. We find that of central galaxies of fossil groups in the MSGC are non-elliptical ( S and S0’s). Similar percentages are found in the control sample ( are S and are S0).
Regarding the luminosities of the first-ranked galaxies in fossil groups, we found that even when no specific selection criterion was used to select luminous, central, group galaxies, the final sample of fossil groups had quite a bright median magnitude of . We note that a search for fossil groups in the photometric SDSS (Santos et al. 2007), using similar selection criteria (but with no lower limit to the mass of the groups) produced a sample of groups with a mean absolute magnitude of
Khosroshahi et al. (2006) found that central galaxies of fossil groups are different in their isophotal shapes (which are often disky) compared with the central galaxies of non-fossil systems (which often have boxy shapes). They then suggested that the central galaxies of fossil groups could be the result of wet mergers (gas-rich mergers) unlike the galaxies in non-fossil groups. It is, therefore, interesting to study the morphologies of objects that represent the pre-merging subclumps that produces the central galaxy, after a major merger. We call the process a wet merger if at least one of the two subclumps is a spiral galaxy, a dry merger if both subclumps are elliptical galaxies and mixed if one of them is elliptical and the other is an S0 or both are S0s. Our results are quoted in Table 3. In contrast to expectations, we find that the vast majority of central galaxies in fossil groups in the MSGC are not produced by wet major mergers. In fact, central galaxies in both fossil and non-fossil groups appear to have undergone the same type of mergers, i.e. from the same morphological mix, and are mostly the result of gas-poor mergers. This analysis was repeated for the subsample of systems that have ellipticals at their centres (88% of the total sample) and similar results were found (values are also quoted in Table 3).
On the other hand, Khochfar & Burkert (2005) investigated whether the observational isophotal shape distribution of elliptical galaxies could be reproduced in semi-analytic models by using both the morphology of galaxies that merge in the last major merger and their mass ratio. Following their work, we classified the central elliptical galaxies that have had a major merger into “boxy” or “disky” according to the following criteria:
-
•
Ellipticals that experience last major mergers between two bulge-dominated galaxies () produce “boxy” remnants independently of the mass ratio
-
•
Last major mergers with mass ratio produce “boxy” ellipticals.
-
•
Last major mergers with mass ratio produce “disky” ellipticals.
Our results for the sample with elliptical galaxies at their centres that have had a major merger are quoted in Table 3. This result disagrees with the predictions of Khosroshahi et al. (2006) based on 7 elliptical galaxies in fossil groups. We found no differences between the isophotal shapes of elliptical galaxies in fossil or non-fossil systems, and in both the likelihood of being boxy was higher than being disky. However, the particular semi-analytic model used in this work (De Lucia & Blaizot 2007) could produce a slightly higher fraction of boxy ellipticals than observations (for instance, for non-fossil groups we found that for a median B-absolute magnitude of , the ratio is around while the observations of Bender et al. (1992) and the predictions of Khochfar & Burkert (2005) are close to (see Fig. in Khochfar & Burkert (2005)).
| Full Sample | ||
| Fossils | non-Fossils | |
| DRY (E+E) | ||
| Mixed (E+S0 or S0+S0) | ||
| WET (S+E or S+S0 or S+S) | ||
| No major merger | ||
| E galaxy at the centre | ||
| Fossils | non-Fossils | |
| DRY | ||
| Mixed | ||
| WET | % | |
| No major merger | ||
| boxy | ||
| disky | ||
4 Mock galaxy catalogue and observations
Although the principal aim of this paper is to study the brightest galaxies of fossil groups identified in the Millennium Simulation, a direct comparison of the fossil groups identified in the both simulations and observational catalogues can be used as a powerful test. We have particular interest to compare the fraction of FoF systems that are fossil groups in both a mock catalogue constructed from the MSGC and the Sloan Digital Sky Survey.
To derive results that can be compared directly with observations, we construct a mock catalogue in redshift space using a snapshot at of the MSGC. We compute observer frame galaxy apparent magnitudes from the rest-frame absolute magnitudes provided by the semi-analytical model and tabulated (k+e)-corrections from Poggianti (1997), where the corrections were calculated according to an evolutionary synthesis model that reproduces the integrated galaxy spectrum in the range . Distorted redshifts are computed using the peculiar velocities of each galaxy. The mock catalogue comprises galaxies with apparent magnitudes lower than within the volume of one simulation box (, ).
Groups of galaxies in the mock catalogues (FoF galaxy halos) were identified by using an algorithm similar to that developed by Huchra & Geller (1982), which is an adaptation of the FoF algorithm that takes account of the distortion caused by peculiar motions (redshift space) and the apparent magnitude cut-offs. As performed in real space, groups were identified as clusters with an overdensity of 200 and above. Particular care was taken in estimating the group centres. We used a method that computed the projected centre positions by weighting appropriately the positions by the local densities and luminosities (Díaz et al. 2005).
The masses, virial radii, and velocity dispersions of the FoF galaxy group were computed using Equation 1, although the radial velocity dispersions () where then calculated using the biweight estimator described by Beers et al. 1990 (). Only FoF galaxy halos with more than ten members were considered.
4.1 Fossil Groups in a mock catalogue
The criteria used to select fossil groups was described in Sect. 2.3. Besides considering only groups with masses larger than , we also restricted the depth of the FoF galaxy halos by selecting groups with redshifts lower than . This restriction was based on statistical analyses that revealed that the reliability of the identification algorithm in redshift space increases for groups at redshifts below .
We found a comparatively low number of fossil groups: FoF galaxy halos were classified as fossils, which represented of the FoF galaxy groups in the mock catalogue. Median properties of these groups were also quoted in Table 1. For the mock sample, we estimated the mean density of fossil groups up to the median redshift of the sample, which is a fairly robust measure of density. We measured .
It can be observed that the fraction of groups that satisfy the fossil criteria in the mock catalogue is lower than the found in MSGC. This discrepancy occurs for the following reason. In real space (MSGC) the search for galaxies whose magnitudes respect the M selection criterion is completed within a sphere, which cannot be replicated for the mock catalogue given that we operate in redshift space, and by then measuring projected distances. When considering projected distances in the selection of fossil groups, bonafide members in the outskirts of the groups may fail to satisfy the M12 magnitude criterion, which then produces a smaller fraction of fossil groups (a similar effect is seen when fossil groups are defined to be within instead of ). This hypothesis was tested in the mock catalogue by reidentifying fossil groups in the mock catalogue, but, instead of using redshift space information, we used the available real space information to search for galaxies within a sphere of radius . The percentages that we found in this simple test were far more similar to those drawn from MSGC.
We note that in observational catalogues the entire identification procedure will be affected in a similar way as that of our mock catalogue. We must therefore recall that percentages or number densities drawn from observations will be underestimated. In particular, in our study case, we derived 3% from the mock catalogue (which should be equivalent to the observations) but the real number should be closer to 5.5% for the fraction of groups that are fossils, from the entire population of groups/clusters with masses larger than .
4.2 Comparison with SDSS
We used the main galaxy sample with spectroscopic redshifts of the SDSS DR6 to identify observational fossil groups by using the same methodology applied in our mock catalogue. This sample consisted of galaxies with apparent magnitudes in the r-band lower than and a median redshift of . Briefly, FoF galaxy halos were identified by using an algorithm similar to that of Huchra & Geller (1982) (see Merchán & Zandivarez 2005 for further details of the procedure) with an overdensity contrast of 200. Then, halos with more than 10 members, masses larger than and redshifts lower than 0.1 were selected. Within this sample, we searched for fossil groups, i.e. groups with a magnitude gap of larger than 2 magnitudes in the r-band when considering galaxies within . We found 6 fossil groups in this sample, which represented a fraction of of all groups with more than 10 members and masses larger than . Median properties of these fossil groups are quoted in Table 1.
At first sight, this result is surprising, given that we predicted in the previous section that this fraction should be close to 3%. To understand this low percentage of fossil groups in the SDSS, we carefully considered the causes of incompleteness in the SDSS and we then reproduce these incompleteness in our mock catalogue. Two problems were quickly identified: 1) the incompleteness caused by fibre collisions and 2) the incompleteness caused by the fibre magnitude limits and the image deblending software. The former meant that a fraction of of galaxies that have a neighbour closer than were missing. The latter caused the spectroscopic sample to become noticeably incomplete for galaxies brighter than . We then performed four different mock catalogues considering different combinations of these incompleteness, and we report in Table 4 the percentages of groups considered to be fossils. It can be seen that the fibre collision effect introduces a small bias in the percentages of fossil groups identified (which can be noted by comparing columns “with close pairs” and “without close pairs”, in Table 4) but, in contrast, the lack of galaxies brighter than 14.5 strongly bias the results, causing the fractions to be far lower than the expected 3-4% predicted from the full mock catalogue. Taking the incompleteness into account, the mean density of mock fossil groups up to the median redshift of the sample is
To check this result, we repeated our search for groups in the SDSS, completed above, but now considering only galaxies in the magnitude range . We found exactly what we expected from the simulations: of the FoF galaxy halos were fossil systems (this number can be directly compared with the final line in the final column of Table 4). For the remaining fossil groups, the mean density up to the median redshift was , which was quite similar to that obtained in the mock catalogue after all biases were considered.
The lack of bright galaxies also caused the few fossil groups that we identified in the SDSS DR6 to have first-ranked galaxies that were not as bright as those found in the semi-analytical model.
| with close pairs | without close pairs | |
|---|---|---|
Notes: Mock with close pairs: described in sect 4. Mock without close pairs: reproducing the fibre collision effect. Both were performed with different magnitude cut-offs.
| name | |||||||||||
|---|---|---|---|---|---|---|---|---|---|---|---|
| [h:m:s] | [d:m:s] | [] | [] | [] | [h:m:s] | [d:m:s] | [r-band] | ||||
| I | 07:35:29.04 | 39:45:21.6 | 0.0866 | 11.3 | 797 | 0.86 | 07:35:36.46 | 39:45:53.57 | 0.0874 | -22.43 | -0.190478 |
| II | 07:58:34.32 | 37:46:12.0 | 0.0406 | 7.5 | 563 | 1.01 | 07:58:28.11 | 37:47:11.87 | 0.0408 | -22.29 | -0.151681 |
| III | 15:19:02.64 | 04:17:49.2 | 0.0466 | 8.1 | 579 | 1.04 | 15:19:03.52 | 04:20:01.14 | 0.0468 | -22.09 | -0.177914 |
| IV | 07:34:33.84 | 26:53:56.4 | 0.0796 | 7.9 | 551 | 1.12 | 07:34:22.22 | 26:51:44.93 | 0.0797 | -22.35 | -0.197101 |
| V | 14:38:55.68 | 10:08:16.8 | 0.0552 | 7.7 | 523 | 1.21 | 14:38:47.60 | 10:07:17.26 | 0.0553 | -21.70 | -0.158786 |
| VI** | 08:56:37.44 | 21:52:51.6 | 0.0823 | 9.9 | 544 | 1.43 | 08:56:51.80 | 21:49:49.44 | 0.0827 | -22.17 | -0.175508 |
Notes: ,: equatorial coordinates of the centre of mass of the group; : spectroscopic redshift of the centre of mass; : virial mass of the group; : 3-D velocity dispersion of the group; : virial radius of the group; , , equatorial coordinates and spectroscopic redshift of the brightest galaxy; : rest frame absolute magnitude of the brightest galaxy. k+e corrections from Blanton et al. 2003; : spectral type parameter of the brightest galaxy, provided by SDSS.
It is not a fossil group (see text)
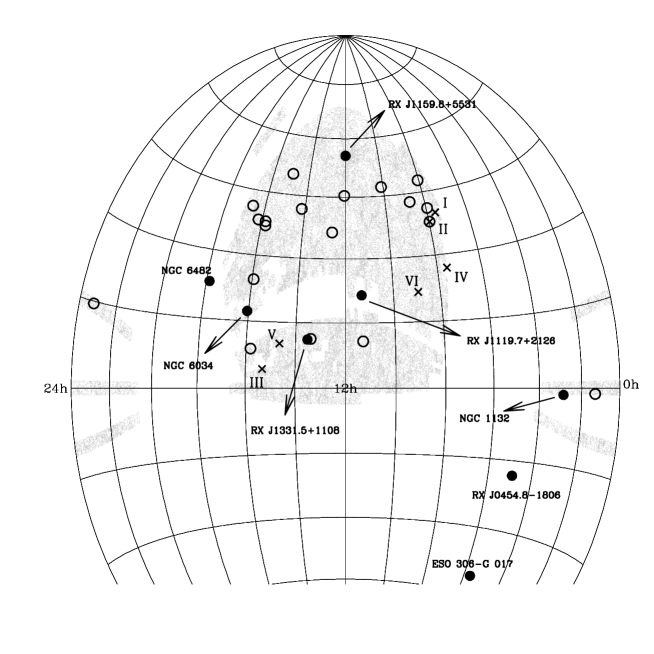
Despite the small number of fossil groups identified in the main spectroscopic galaxy sample of SDSS, we attempted to analyse their main properties. In Table 5, the properties of each of the six groups are quoted. Figure 3 shows the angular distribution of the equatorial coordinates versus for all known fossil groups. Grey points are the galaxies in the main sample of the SDSS. Crosses are the six fossil groups presented in this work. Filled circles are the fossil groups listed in Mendes de Oliveira et al. (2006) with and empty circles are the fossil groups identified by Santos et al. (2007) in the photometric sample of SDSS with . There are three filled circles in the SDSS area that we failed to identify. Using the SDSS DR6 Finding Chart Tool 222http://cas.sdss.org/dr6/en/tools/chart/chart.asp, we analysed a field about the centre of those fossil groups and realised that they could not be identified because of different reasons. RX J1331.5+1108 could not be identified because its main galaxy could not be observed due to possible fibre collisions. We failed to identify RX J1159.8+5531 as a fossil group because the two-magnitude gap was not present in this group. We identified this group instead to be massive and containing numerous galaxies, but the two-magnitude criterion caused us to reject this halo (the absolute magnitude difference in R-band between the first and second ranked galaxy is ). Finally, NGC 6034 was not detected since we did not identify a massive and numerous halo in its position. Instead, we identified the central galaxy to be part of the outskirts of a larger group. A closer inspection also indicated that this galaxy also had a close bright neighbour in the same large group, causing the magnitude gap to be and not 2, as the strict definition of fossil groups requires.
It is also interesting to compare the fossil groups identified by Santos et al. (2007) and ourselves. Only one of six groups (number II in our Table 5) was in their catalogue. One reason for these differences is that Santos et al. (2007) insisted that all fossil groups had extended X-ray emission in the ROSAT all-sky catalogue. For our six groups, one has extended X-ray emission (group II) and one has point source X-ray emission (as detected by XMM, group number IV) and four do not have any detectable ROSAT emission (and have not been observed by other satellites). Given that the sensitivity of ROSAT is quite low, these groups should be studied again with deeper X-ray observations to confirm their nature as fossil groups. Another important discrepancy between the two works is the way in which a fossil-system is defined. Differences in the radii used to test the magnitude gap criterion (virial radius or fixed radius in kpc) and the way of defining the group membership may cause each study to select different systems.
By using the NASA/IPAC Extragalactic Database 333http://nedwww.ipac.caltech.edu, we also analysed whether the SDSS fossil groups presented in this work had been previously identified as groups or clusters of galaxies. Fossils I, IV, V, and VI did not have previous identifications as systems of galaxies. Fossil II corresponded to the X-ray cluster NGC 2484 GROUP (Popesso et al. 2004) and fossil III was previously identified as the cluster CAN 245 (Wegner et al. 1999).
We also tested the possibility that our fossil groups were spurious identifications due to the incompleteness caused by the fibre collisions or the fibre magnitude limit that affect the spectroscopic sample of the SDSS. Using the SDSS DR6 Finding Chart Tool, we analysed a field of 0.5 around the centre of each fossil group and found that in fossil VI the brightest galaxy of this group has a close neighbour that is a spectroscopic target not observed due to the fibre collision problem. The magnitude gap between these two galaxies is less than two magnitudes (). Although the redshift of the second-ranked galaxy is unknown, we note that it is likely that this is not a fossil group. This is one of the groups that are not detected in X-rays. A similar situation applies to fossil group III, since in the area corresponding to half the virial radius there is a galaxy whose (apparent) magnitude differs by less than 2 from the (apparent) magnitude of the brightest galaxy, but this galaxy was missing from the SDSS survey because it has a very close neighbour. However, in this case, the visual inspection is insufficient to confirm whether this galaxy belongs to the same group.
In summary, the spectroscopic sample of SDSS DR6 is ,probably, not the most appropriate for the of study observational fossil groups due to its inherent incompleteness, which means that we are often unable to or falsely identify groups. The enormity of this galaxy data set is still however a useful guide for deeper optical observational studies or even X-ray observations, which are beyond the scope of this paper.
5 Conclusions
To help interpret observations, we have analysed the properties of the first-ranked galaxies of simulated fossil groups and their main differences with respect to the brightest galaxies of non-fossil systems. To perform this analysis, we have studied a sample of fossil groups obtained from the largest simulated galaxy catalogue at present, the Millennium simulation combined with a semi-analytic model of galaxy formation (De Lucia & Blaizot 2007). The sample of fossil groups identified was sufficiently large to enable robust statistical analyses to be completed. A control sample of non-fossil groups was also selected. The goal of this research was twofold: to predict results based on semi-analytical models about fossil groups and test the semi-analytical model of formation and evolution by comparing with observational results.
Our analysis was performed in both the Millennium Galaxy Catalogue (MSGC) and a mock catalogue. The fraction of fossils predicted by the mock catalogue was compared with the fraction of fossils found in the SDSS data set by applying the same algorithm of identification. If the two main sources of incompleteness affecting the spectroscopic sample of SDSS were taken into account, the fraction of fossil groups found in the mock catalogue was consistent with that observed in the SDSS. We have presented six candidate fossil systems in SDSS DR6. One has been rejected after visually analysing the surroundings of the brightest galaxy. The remaining groups await X-rays observations or deeper photometric studies to confirm their nature as fossil groups.
Our main results can be summarised as follows: we confirm the old age feature of fossil systems and that fossil groups with masses larger than represent of massive systems in the same mass range, in the Millennium Galaxy Catalogue and a lower percentage (of 3%) of similar systems in a mock galaxy catalogue. Fossils in the Mock Catalogue were identified in redshift space (just as achieved in observations), where galaxies from the outskirts of the groups affect the selection criterion and reduce the resulting number of fossils. We found that of fossil systems have central galaxies that are ellipticals. In addition, we found that the first-ranked galaxies of fossil groups and non-fossil groups have the same morphological mixtures, which can be considered to be the results of gas poor mergers. If the central galaxy of a fossil group is always elliptical, the likelihood that its progenitor galaxies merge in a dry merger is higher. Although this result disagrees with the observational studies of Khosroshahi et al. (2006) for seven elliptical galaxies in fossil groups, further observational data is required to fully resolve this issue. Finally, we investigated the nature of the central galaxies by keeping track of their merging histories. On the one hand, the fossil groups in general assembled earlier than non-fossil groups, whilst their central galaxies assembled later. We also found that first-ranked galaxies in fossil groups have undergone a major merger later than their counterparts in non-fossil systems. We expect this result to be confirmed by future observational catalogues.
Acknowledgements.
We thank the anonymous referee for comments that helped to improve this work. We thank Dr. Laerte Sodré Jr., Walter dos Santos and Dr. Ariel Zandivarez for many useful discussions in all phases of this project. This work was partially supported by the European Commission’s ALFA-II programme through its funding of the Latin-American European Network for Astrophysics and Cosmology (LENAC), Consejo de Investigaciones Científicas y Técnicas de la República Argentina (CONICET) and Secretaría de Ciencia y Técnica, UNC (SeCyT). CMdO acknowledges financial help from FAPESP through the thematic project 01/07342-7. The Millennium Simulation databases used in this paper and the web application providing online access to them were constructed as part of the activities of the German Astrophysical Virtual Observatory.References
- Adelman-McCarthy & et al. (2008) Adelman-McCarthy, J. & et al. 2008, ApJS, 175, 297
- Beers et al. (1990) Beers, T. C., Flynn, K., & Gebhardt, K. 1990, AJ, 100, 32
- Bender et al. (1992) Bender, R., Burstein, D., & Faber, S. M. 1992, ApJ, 399, 462
- Bertone et al. (2007) Bertone, S., De Lucia, G., & Thomas, P. 2007, MNRAS, 379, 1143
- Binney & Tremaine (1987) Binney, J. & Tremaine, S. 1987, Galactic Dynamics (Princeton, NJ, Princeton University Press, 1987)
- Blanton et al. (2003) Blanton, M. R., Brinkmann, J., Csabai, I., et al. 2003, AJ, 125, 2348
- Croton et al. (2006) Croton, D. J., Springel, V., White, S. D. M., et al. 2006, MNRAS, 365, 11
- Cypriano et al. (2006) Cypriano, E. S., Mendes de Oliveira, C., & Sodré, L. J. 2006, AJ, 132, 514
- Dariush et al. (2007) Dariush, A., Khosroshahi, H., Ponman, T., et al. 2007, MNRAS, 382, 433
- Davis et al. (1985) Davis, M., Efstathiou, G., Frenk, C. S., & White, S. D. M. 1985, ApJ, 292, 371
- de la Rosa & et al. (2008) de la Rosa & et al. 2008, in preparation
- De Lucia & Blaizot (2007) De Lucia, G. & Blaizot, J. 2007, MNRAS, 375, 2
- De Lucia et al. (2006) De Lucia, G., Springel, V., White, S., Croton, D., & Kauffmann, G. 2006, MNRAS, 366, 499
- Díaz et al. (2005) Díaz, E., Zandivarez, A., Merchán, M., & Muriel, H. 2005, ApJ, 629, 158
- D’Onghia et al. (2005) D’Onghia, E., Sommer-Larsen, J., Romeo, A., et al. 2005, ApJ, 630, L109
- Huchra & Geller (1982) Huchra, J. & Geller, M. 1982, ApJ, 257, 423
- Jones et al. (2003) Jones, L. R., Ponman, T. J., Horton, A., et al. 2003, MNRAS, 343, 627
- Khochfar & Burkert (2005) Khochfar, S. & Burkert, A. 2005, MNRAS, 359, 1379
- Khosroshahi et al. (2006) Khosroshahi, H. G., Ponman, T. J., & Jones, L. R. 2006, MNRAS, 372, L68
- Mendes de Oliveira et al. (2006) Mendes de Oliveira, C., Cypriano, E., & Sodré, L. J. 2006, AJ, 131, 158
- Mendes de Oliveira & et al. (2008) Mendes de Oliveira, C. & et al. 2008, submitted to AJ
- Merchán & Zandivarez (2005) Merchán, M. & Zandivarez, A. 2005, ApJ, 630, 759
- Milosavljević et al. (2006) Milosavljević, M., Miller, C. J., Furlanetto, S. R., & Cooray, A. 2006, ApJ, 637, L9
- Poggianti (1997) Poggianti, B. M. 1997, A&A, 122, 399
- Popesso et al. (2004) Popesso, P., Böhringer, H., Brinkmann, J., Voges, W., & York, D. G. 2004, A&A, 423, 449
- Sales et al. (2007) Sales, L., Navarro, J., García Lambas, D., White, S., & Croton, D. 2007, MNRAS, 382, 1901
- Santos et al. (2007) Santos, W., Mendes de Oliveira, C., & Sodré Jr, L. 2007, AJ
- Spergel et al. (2007) Spergel, D. N., Bean, R., Doré, O., et al. 2007, ApJS, 170, 377
- Spergel et al. (2003) Spergel, D. N., Verde, L., Peiris, H. V., et al. 2003, ApJS, 148, 175
- Springel et al. (2005) Springel, V., White, S. D. M., Jenkins, A., et al. 2005, Nature, 435, 629
- van den Bosch et al. (2007) van den Bosch, F. C., Yang, X., Mo, H. J., et al. 2007, A&A, 376, 841
- Vikhlinin et al. (1999) Vikhlinin, A., McNamara, B., Hornstrup, A., et al. 1999, ApJ, 520, L1
- von Benda-Beckmann et al. (2007) von Benda-Beckmann, A. M., D’Onghia, E., Gottloeber, S., et al. 2007, MNRAS
- Wang et al. (2008) Wang, J., De Lucia, G., Kitzbichler, M., & White, S. D. M. 2008, MNRAS, 384, 1301
- Wegner et al. (1999) Wegner , G., Colless, M., Saglia, R. P., et al. 1999, MNRAS, 305, 259
- Xu (1995) Xu, G. 1995, ApJS, 98, 355