Discovery in IC10 of the farthest known symbiotic star ††thanks: Based on observations obtained at the Gemini Observatory, which is operated by the Association of Universities for Research in Astronomy, Inc., under a cooperative agreement with the NSF on behalf of the Gemini partnership. We also retrieved UBVRI images of the “Survey of Local Group Galaxies Currently Forming Stars”, Massey et al. (2007).
Abstract
We report the discovery of the first known symbiotic star in IC10, a starburst galaxy belonging to the Local Group, at a distance of 750 kpc. The symbiotic star was identified during a survey of emission-line objects. It shines at =24.620.04, =2.770.05 and =2.390.02 and suffers from =0.850.05 reddening. The spectrum of the cool component well matches that of solar neighborhood M8III giants. The observed emission lines belong to Balmer series, [SII], [NII] and [OIII]. They suggest a low electronic density, negligible optical depth effects and 35,00090,000 K for the ionizing source. The spectrum of the new symbiotic star in IC10 is an almost perfect copy of that of Hen 2-147, a well known Galactic symbiotic star and Mira.
keywords:
galaxies: Local Group; galaxies: individual: IC10; stars: binaries: symbiotic1 Introduction
The importance of symbiotic stars to understand stellar evolution in binary systems and the origin of type Ia supernovae is widely recognized (eg. Corradi, Mikołajewska & Mahoney 2003). However, so far only a few symbiotic stars are known in external galaxies, all belonging to the inner Local Group: eight in the LMC, six in the SMC and one in Draco (Belczyński et al. 2000). The vast majority of symbiotic stars known in our Galaxy has been discovered during objective prism surveys. The need of spectroscopy to identify them helps to explain the paucity of discoveries outside our Galaxy. In this Letter we report our spectroscopic discovery of the first symbiotic star known in IC10, a dwarf starburst galaxy belonging to the Local Group. The partnership with IC10 makes this symbiotic star, named hereafter IC10 SySt-1, the most distant one known at this time, at a distance 750 kpc (the most recent estimate of the distance to IC10 is 690 to 790 kpc by Kniazev, Pustilnik & Zucker 2008).
In a typical symbiotic star, matter is transferred from a cool giant to a white dwarf companion, and stable H-burning at the surface of the latter (Sokoloski 2003) provides the energy input to ionize some fraction of the circumstellar gas. The stable H-burning processing of the accreted matter turns symbiotic stars into a viable progenitor channel for the type Ia supernovae (Munari and Renzini 1992). The importance of such a channel depends on several factors, like the efficiency in mass growth of the white dwarf, the mass reservoir in the donor star and the efficiency of the mass transfer, the partnership with the old population, and the number of symbiotic stars per unit mass. The total number of symbiotic stars in our Galaxy has been variously estimated as 4105 by Magrini et al. (2003), 3105 by Munari and Renzini (1992), 3104 by Kenyon et al. (1993) and 3103 by Allen (1984). The large differences among them arise mainly in the way the incompleteness discovery fraction is computed starting from the small observed sample (2102, Belczynski et al. 2000). Surveys for and discovery of symbiotic stars in other galaxies should help to better evaluate the incompleteness discovery fraction in our own Galaxy.
We performed a survey of emission-line populations in IC10, to search for and to study the spectroscopic properties of planetary nebulae and HII regions. This was made with the Gemini North telescope, by means of H narrow-band continuum-subtracted imaging and followup spectroscopy. During this survey we discovered the new symbiotic star whose basic properties are described in the following sections.
2 Observational data
2.1 Imaging
IC10 StSy-1 was identified as an H emitter in images obtained with the 8.1-m Gemini North Telescope and its Multi-Object Spectrograph (GMOS-N). Images were taken in queue mode on August 08, 2007. The field of view was 5′5′, centered at .
A continuum-subtracted H image was built using two narrow-band frames, one taken with the H filter Ha-G0310 centered at 6550 Å and 70 Å wide, and the other with the H-continuum filter HaC-0311, centered at 6620 Å and 70 Å wide. The exposure times were 400 s, split in two sub-exposures, through both filters.
2.2 Spectroscopy
Spectra of IC10 StSy-1 were obtained in queue mode with GMOS-N at Gemini North, using two different gratings: R400+G5305 (‘red’), with 3 exposures of 1,700s each, on October 11, 2007, and B600+G5303 (‘blue’) with 41,700s exposures, on October 14 and 18, 2007. The slit width was 1 arcsec, and the pixel binning were 22 (spectralspatial). The spatial scale and reciprocal dispersions of the spectra were as follows: 0094 and 0.3 nm per binned pixel, in ‘blue’; and 0134 and 0.8 nm per binned pixel, in ‘red’. Seeing varied from 0.5′′ to 0.6′′ for the R400 spectra, and it was 0.6′′ for the two runs in which B600 spectra were taken. CuAr lamp exposures were obtained with both gratings for wavelength calibration. The effective ‘blue’ plus ‘red’ spectral coverage of the IC10 StSy-1 spectrum was from 3700 Å to 9500 Å.
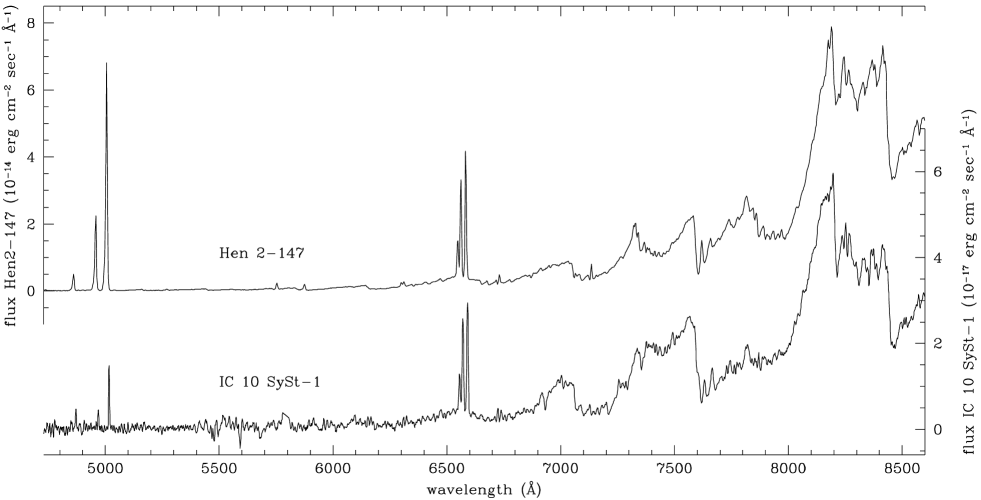
The data were reduced and calibrated using the Gemini gmos data reduction script and long-slit tasks, both being part of IRAF. Spectra of the spectrophotometric standard Wolf1346 (Massey et al. 1988, Massey and Gronwall 1990), obtained with the same instrumental setups as IC10 SySt-1 on two different nights (September 17 and October 5, 2007), were used to calibrate our spectra of IC10 SySt-1. This allowed to recover the actual slope of the spectrum, although not its flux zero point. The latter was obtained by imposing that the -band flux integrated over the spectrum would match the =21.85 mag we measured from direct VRCIC photometry of IC10 SySt-1 (see next sect. 3.1). The spectrum of IC10 SySt-1 so calibrated is presented in Figure 1.
3 Discussion
3.1 Astrometric position and VRCIC magnitudes
Massey et al. (2007) obtained, with the Kitt Peak National Observatory and Cerro Tololo Inter-American Observatory 4-m telescopes and Mosaic cameras, UBVRCIC photometry of the resolved stellar population of several dwarf galaxies with active star formation, including IC10. Massey et al. (2007) did not provide photometry for IC10 StSy-1. We have used their source observations (accessible via ftp111ftp://ftp.lowell.edu/pub/massey/lgsurvey), and derived for IC10 StSy-1 =24.620.04, =2.770.05 and =2.390.02 via aperture photometry. The symbiotic star is below detection threshold both in - and -band frames.
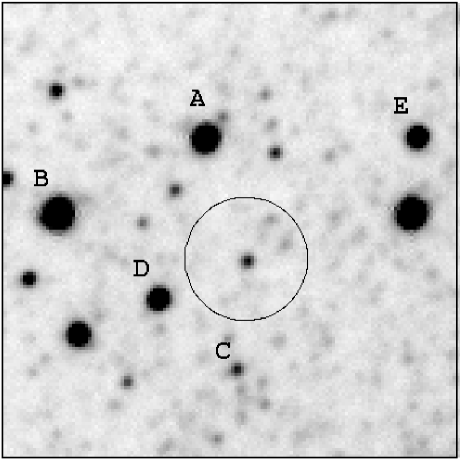
The position we derived for IC10 SySt-1 on Massey et al. (2007) astrometrically calibrated frames is RA=00:20:33.59 and DEC=+59:18:45.9 (J2000.0), with an error smaller than 1 arcsec. This position is marked on the -band finding chart presented in Figure 2. It covers a field of view of 3737 arcsec and shows stars down to =20 mag. We also marked on Figure 2 a few field stars suitable to serve as local photometric standards, whose photometry is given in Table 1.
| V | B-V | V-RC | R-IC | |
| A | 17.5090.005 | 0.9920.005 | 0.5870.005 | … |
| B | 16.9830.005 | 1.2000.005 | 0.6880.005 | … |
| C | 22.1850.012 | 1.9200.020 | 1.2430.014 | 1.4250.008 |
| D | 18.9090.005 | 1.2740.005 | 0.7940.005 | 0.8220.005 |
| E | 18.5750.005 | 1.1100.005 | 0.6520.005 | 0.6060.005 |
3.2 Classification
The spectrum of IC10 SySt-1 presented in Figure 1 is that of a symbiotic star: strong molecular TiO absorption bands from a cool giant with superimposed emission lines tracing the presence of a hot companion that ionizes the circumstellar nebula fed by the mass loss from the giant. The presence of [OIII] requires a temperature of the photo-ionization source in excess of 35,000 K, which satisfy the classification criteria for symbiotic stars adopted by Belczyński et al. (2000). Our spectrum is too underexposed at the shortest wavelengths to distinguish between absence or presence of HeII 4686 emission line, which would be required for the more stringent classification criteria among symbiotic stars adopted by Allen (1984) and that would trace ionization temperatures in excess of 55,000 K.
The partnership of IC10 SySt-1 with symbiotic stars is reinforced by the comparison, carried out in Figure 1, with He 2-147. This is a bona fide symbiotic star containing a long period Mira and a toroidal expanding circumstellar nebula resolved in both ground-based and HST observations (Munari and Patat 1993, Corradi et al. 1999, Santander-García et al. 2007). The only significant difference with Hen 2-147 in Figure 1 is a lower intensity in IC10 SySt-1 of [OIII] lines with respect to [NII], probably tracing a lower temperature of the photo-ionizing source. A list and integrated fluxes of the emission lines identified in the spectrum of IC10 SySt-1 is given in Table 2.
| 4861 | H | 2.2 | 1.00 |
|---|---|---|---|
| 4959 | [OIII] | 2.2 | 0.91 |
| 5007 | [OIII] | 7.1 | 3.08 |
| 6548 | [NII] | 7.0 | 1.13 |
| 6563 | H | 18.7 | 2.85 |
| 6584 | [NII] | 21.0 | 3.25 |
| 6717 | ]SII] | 2.1 | 0.28 |
| 6731 | [SII] | 1.9 | 0.24 |
3.3 Spectral type and reddening
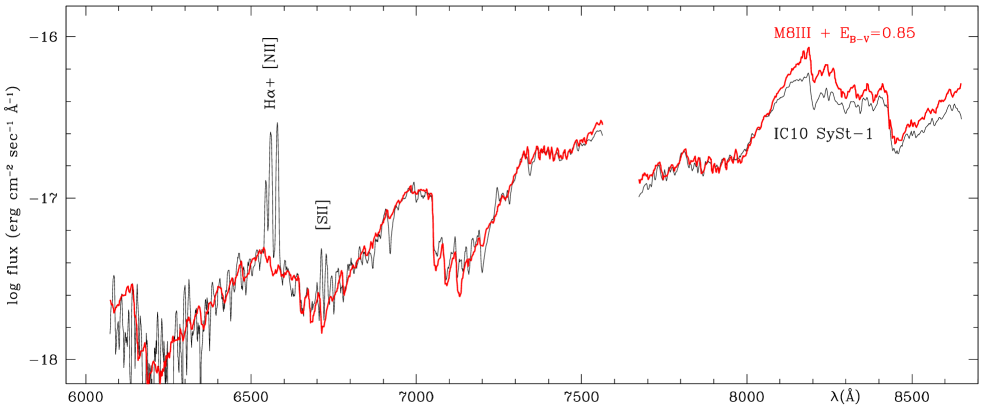
To derive the spectral type of the cool giant, we have compared the red portion of the IC10 SySt-1 spectrum with the spectral atlas of Fluks et al. (1994), which is based on observation of solar neighborhood objects. We obtained an excellent match with a M8III type, and the much poorer respective fits exclude a classification as either M7 or M9 spectral types. The comparison with the unreddened spectra of Fluks et al. (1994) also firmly constrains the reddening, found to be =0.850.05. The fit to the observed spectrum of IC10 SySt-1 with an M8III from Fluks et al. (1994) and reddened by =0.85 is presented in Figure 3. Integrating the BVRCIC pass-bands would provide B=26.79, V=24.43, RC=21.85 and IC=19.33 for the reddened M8III fitting spectrum, and B=23.47, V=21.95, RC=20.12 and IC=17.94 for the unreddened one.
The reddening we found for IC10 SySt-1 is the same as reported by Mateo (1998) for the IC10 as a whole, suggesting a negligible circumstellar contribution. The =0.85 value for the reddening affecting IC10 SySt-1 is also supported by the flux ratio of Balmer H and H emission lines. Their recombination line ratio under Case B conditions and negligible self-absorption is 2.9 (Osterbrock and Ferland 2006, their Table 4.4). In IC10 SySt-1 the observed ratio is 8.5 which reduces to 2.9 once corrected for =0.85.
3.4 Electron density, oxygen abundance and temperature of the ionizing source
A preliminary estimate of the nebular conditions can be derived from the data at hand (see Table 2), using the nebular IRAF package (Shaw & Dufour 1994).
The electron density in the circumstellar nebula can be estimated as 400200 cm-3 using the [S ii] 6716, 6731 Å doublet. An upper limit to the flux of [O iii] 4363 Å emission line (6% of H) gives a lower limit to the electron temperature of 17,000 K from the I(4959+5007)/I(4363) ratio. Using this limit for [O iii] and the O++ abundance, the lower limit to the total oxygen abundance (Kingsburgh & Barlow 1994) is 12 + (O/H) 7.4, the solar abundance being 8.66 (Asplund Grevesse & Sauval 2005). An upper limit for the integrated flux of Heii 4686 Å emission line amounting to 5% of the integrated flux of H corresponds to an upper limit 90,000 K for the temperature of the ionizing source, the lower limit 35,000 K being set by the presence of [O iii] (Kaler & Jacoby 1989).
Contrary to many symbiotic stars, the nebular lines of IC10 StSy-1 do not indicate the presence of high density ionized gas. The observed lines could instead originate in an extended, low density nebula. To the low density conditions characterizing IC10 SySt-1 spectrum could be contributing the emission from external and extended nebular regions similar to those resolved around many symbiotic Miras in our Galaxy (Corradi et al. 1999), like the one around Hen 2-147, or the more spectacular ones of He2-104 (Corradi et al. 2001) and R Aqr (Gonçalves et al. 2003).
Acknowledgments
We would like to thank Peter McGregor, the referee, for his suggestions. Two Brazilian and one Italian agency gave us partial support for this work. So DRG and LM would like to thank FAPESP (2003/09692-0 and 2006/59301-6, respectively) and the EC Research Training Network MRTN-CT-2006-035890 “Constellation”. DRG also thanks FAPERJ’s (E-26/110.107/2008) grant.
References
- [] Allen D.A., 1984, PASAu 5, 369
- [] Asplund M., Grevesse N., Sauval A.J., 2005, in Cosmic Abundances as Records of Stellar Evolution and Nucleosynthesis, T.G. Barnes and F.N. Bash eds., ASPC 336, 25
- [] Belczyński K., Mikołajewska J., Munari U., Ivison R. J., & Friedjung M., 2000, A&AS, 146, 407
- [] Corradi R. L. M., Ferrer, O. E., Schwarz, H. E., Brandi, E., García, L. 1999, A&A 348, 978
- [] Corradi R. L. M., Livio M., Balick B., Munari U., & Schwarz H. E., 2001, ApJ, 553, 211
- [] Corradi R. L. M., Mikołajewska, J., Mahoney, T.J. eds. 2003, Symbiotic Stars Probing Stellar Evolution, ASPC 303
- [] Fluks M. A., Plez B., The P. S., de Winter D., Westerlund B.E., Steenman H.C., 1994, A&AS 105, 311
- [] Gonçalves D. R., Mampaso A., Navarro S., & Corradi R. L. M., 2003, ASPC, 303, 423
- [] Kaler J. B., & Jacoby G. H., 1989, ApJ, 345, 871
- [] Kenyon S.J., Livio M., Mikołajewska J., Tout C.A., 1993, ApJ, 407, L81
- [] Kingsburgh R. L., & Barlow M. J., 1994, MNRAS, 271, 257
- [] Kniazev A. Y., Pustilnik S. A., & Zucker D. B., 2008, MNRAS, 384, 1045
- [] Magrini L., Corradi R. L. M., Munari U., 2003, ASPC, 303, 539
- [] Massey P., Strobel K., Barnes J. V., & Anderson E., 1988, ApJ, 328, 315
- [] Massey P., Gronwall C., 1990, ApJ, 358, 344
- [] Massey P., Holmes S., 2002, ApJ, 580, L35
- [] Massey P., Olsen K. A. G., Hodge P. W., Jacoby G. H., McNeill R. T., Smith R. C., & Strong Shay B., 2007, AJ, 133, 2393
- [] Mateo M.L., 1998, ARA&A 36, 435
- [] Munari U., Renzini A., 1992, ApJ, 397, L87
- [] Munari U., Patat F., 1993 A&A 277, 195
- [] Osterbrock D.E., Ferland G., 2006, Astrophysics of Gaseous Nebulae and Active Galactic Nuclei, 2nd. ed. (Univ. Science Books)
- [] Santander-García M., Corradi R. L. M., Whitelock P. A., Munari U., Mampaso A., Marang F., Boffi F., Livio M., 2007, A&A 465, 481
- [] Shaw R. A., & Dufour R. J., 1994, ASPC, 61, 327
- [] Sokoloski J.L., 2003, ASPC, 303, 202