PAH emission from Herbig AeBe stars
Abstract
We present spectra of a sample of Herbig Ae and Be (HAeBe) stars obtained with the Infrared Spectrograph on the Spitzer Space Telescope. All but one of the Herbig stars show emission from polycyclic aromatic hydrocarbons (PAHs) and seven of the spectra show PAH emission, but no silicate emission at 10 m. The central wavelengths of the 6.2, 7.7–8.2, and 11.3 m emission features decrease with stellar temperature, indicating that the PAHs are less photo-processed in cooler radiation fields. The apparent low level of photo processing in HAeBe stars, relative to other PAH emission sources, implies that the PAHs are newly exposed to the UV-optical radiation fields from their host stars. HAeBe stars show a variety of PAH emission intensities and ionization fractions, but a narrow range of PAH spectral classifications based on positions of major PAH feature centers. This may indicate that, regardless of their locations relative to the stars, the PAH molecules are altered by the same physical processes in the proto-planetary disks of intermediate-mass stars. Analysis of the mid-IR spectral energy distributions indicates that our sample likely includes both radially flared and more flattened/settled disk systems, but we do not see the expected correlation of overall PAH emission with disk geometry. We suggest that the strength of PAH emission from HAeBe stars may depend not only on the degree of radial flaring, but also on the abundance of PAHs in illuminated regions of the disks and possibly on the vertical structure of the inner disk as well.
1 INTRODUCTION
Circumstellar accretion disks that contain dust and gas are common around intermediate mass stars. Studying the material in these disks and their evolution can aid us in understanding the very latest stages of star formation and the early stages of planet formation. Herbig Ae/Be (HAeBe) stars are intermediate-mass (M2-10 M☉) pre-main-sequence stars of spectral class A, B, or early F (Herbig, 1960; Strom et al., 1972; Thé et al., 1994; Malfait et al., 1998). Though often associated with nebulosity, HAeBe photospheres are directly observable at visible wavelengths. Unlike normal A and B stars, HAeBe stars have strong emission lines (e.g. H and Br) in their spectra, they can be highly variable at visible wavelengths, and their infrared fluxes are strongly in excess of purely photospheric emission. Current theory predicts that intermediate-mass stars should form more quickly than lower-mass (T Tauri) stars, but they will not reach their stellar birth lines heavily enshrouded in dense circumstellar envelopes as high-mass stars do. This means that we can directly view the stellar photospheres and residual accretion disks of HAeBe stars, with a relatively unobscured view of both. Unlike high-mass stars, while some HAeBe stars are associated with star forming regions they are not common in the extreme environments of HII regions near OB associations. Thus the stars themselves, and not their environments, drive their disk structure, chemistry, and evolution.
Chemical and dynamical studies of Galactic HAeBe stars have shown holes and gaps in their inner disks indicating the possible dynamical influence of newly formed planets (e.g. Grady et al., 2005; Brittain et al., 2007), as well as evidence of different disk geometries from those that flare with increasing radius and have dust with a large abundance of small grains, to flattened disks composed of larger dust grains (e.g. Meeus et al., 2001; Acke & van den Ancker, 2004). These characteristics are similar to those of the lower-mass T Tauri systems.
Solid-state features and thermal radiation from warm dust, as well as emission from atomic and molecular gas all produce measurable signatures in the mid-IR spectra of young stars with circumstellar disks. Mid-IR imaging and spectroscopy, much of it from space telescopes, have therefore played a major role in measuring and characterizing the disks orbiting T Tauri and HAeBe stars. Unlike T Tauri stars, of which only 8% show emission from polycyclic aromatic hydrocarbons (PAHs, Geers et al., 2006), nearly 50% of HAeBe stars have strong PAH emission (e.g. Meeus et al., 2001; Acke & van den Ancker, 2004), which requires a direct line of sight from the emitting material—presumably located on the surfaces and/or inner rims of disks—to the photospheric optical and UV radiation fields. Furthermore, spectra from the Infrared Space Observatory (ISO) and recent Spitzer observations have revealed that many HAeBe stars in the Galaxy have large abundances of crystalline silicate grains in their disks indicating significant thermal dust processing subsequent to the formation of the star-disk system. These latter characteristics are not as common in T Tauri disks. Moreover, an evolutionary link from HAeBe proto-planetary disks to Vega-like debris disks is becoming evident in studies of large samples of HAeBe stars (e.g. Hernández et al., 2006; Grady et al., 2007), but the details have yet to be completely worked out. Though details of time scale and evolution remain elusive, recent modeling efforts have succeeded in predicting spectral energy distributions from varying physical characteristics in the disks like dust grain size and composition, properties of the stellar radiation field, disk heating and cooling, and disk geometry (e.g. Dullemond & Dominik, 2004; D’Alessio et al., 2006; Dullemond et al., 2007; Robitaille et al., 2007).
It is remarkable that such a large fraction of HAeBe stars are PAH emission sources. Meeus et al. (2001) suggested that PAH emission may change measurably with the structure and physical properties of the disks and perhaps with disk evolution. PAHs have been observed in many different astrophysical contexts: the Galactic and extra-galactic ISM, dust envelopes surrounding post-AGB (asymptotic giant branch) stars, planetary nebulae (PNe), and young stellar objects (YSOs). The molecular structure of PAHs can differ significantly depending on the physical characteristics of the objects or environments where they are found. The bottom line is that PAHs are abundant in interstellar and circumstellar environments, and they can be important constituents in the energy balance of those environments as sources of photoelectrons that heat the gas component (Kamp & Dullemond, 2004).
Emission from PAH molecules may also trace proto-planetary disk geometry (Meeus et al., 2001; Acke & van den Ancker, 2004; Grady et al., 2005). Exactly what the PAH emission can tell us about the disk environments will depend upon a thorough and detailed understanding of how the molecules are energized and processed by the stellar radiation fields and how they are distributed radially and vertically in the disks. Throughout this paper when we refer to ”processing” of PAHs, we mean photo-processing by which the optical and UV stellar radiation break molecular bonds producing smaller PAH molecules or completely destroying them. We have begun a detailed analysis of PAH emission from HAeBe stars using very high S/N spectra that allow much higher precision in analyzing PAH feature strengths and wavelengths, and thus the molecular structure that produces them, than has been possible before.
In a previous paper (Sloan et. al. 2005, hereafter Paper 1), we analyzed four HAeBe stars in the 5-14 m range that have strong PAH emission but no silicate peak at 10 m. We identified a trend towards decreasing PAH molecule size with increasing PAH ionization fraction and noted that the center wavelengths of the PAH features shift systematically with increasing UV field strength from the stars. We suggested that HAeBe stars may have distinctive PAH spectra relative to other PAH sources (e.g. interstellar photon-dominated regions, PNe, etc).
We present 5-36 m spectra of 18 HAeBe stars, two intermediate-mass T Tauri stars, HD 97300, and 51 Oph for a total of 22 sources observed with Spitzer. This extends our original sample of HAeBe stars in Paper 1 by more than a factor of four, and we now analyze HAeBe stars that do have the 10 m silicate emission feature. We present a detailed analysis of the PAH feature strengths and their ratios in an attempt to infer their physical environments and to test for trends in PAH emission when compared with other diagnostics of proto-planetary disk evolution that have recently been helpful in understanding the evolution of T Tauri disks (e.g. Furlan et al., 2006).
The major trends suggested in Paper 1 persist in the present, larger sample. Acke & van den Ancker (2004) noted in their study of 46 HAeBe stars that those with strong mid-IR excesses relative to near-IR excesses have stronger PAH emission than those with weaker mid-IR excesses. This result supports a relation between the detailed structure of PAH emission and the evolution of the disks. Recent studies by Grady et al. (2005) suggest that the strength of (UV-optical) photon-dominated spectral features should correlate with overall disk geometry. Disks that are flat and whose outer disks are therefore shadowed or illuminated at grazing incidence should have weaker H2 line and PAH features relative to disks that are flared and therefore well-illuminated by the photospheres of their host stars. These results imply a strong correlation between PAH strength and disk structure, which we can now test with our data.
2 OBSERVATIONS AND ANALYSIS
2.1 The Sample
Table 1 summarizes the observations of our sample. SU Aur and HD 281789 are intermediate-mass T Tauri stars, which range in spectral class from K to late F (1.5-5.0 M☉). They are the evolutionary predecessors of HAeBe stars so their inclusion broadens our study to more primitive systems (Calvet et al., 2004). Both SU Aur and HD 281789 were included in the Taurus study of Furlan et al. (2006), in which the two stars appeared as clear outliers from the Class II & III low-mass YSOs that they focused on. 51 Oph is almost certainly not an HAeBe star (Thi et al., 2005; Berthoud et al., 2007), but we include it here because its mid-IR spectrum indicates an optically thick, gas- and dust-rich disk with no measurable PAH emission and because it appears in many previous HAeBe studies. We argue below that HD 97300 is probably not a HAeBe star either. The remaining 18 targets are HAeBe stars.
2.2 Observing Methods and Data Processing
We observed all of these sources with the Infrared Spectrograph (IRS, Houck et al., 2004)111The IRS was a collaborative venture between Cornell University and Ball Aerospace Corporation funded by NASA through the Jet Propulsion Laboratory and the Ames Research Center. on the Spitzer Space Telescope. All but two of the sources were observed using the Short-Low (SL) module from 5 to 14 m, the Short-High (SH) module from 10 to 19 m, and the Long-High (LH) module from 19 to 36 m. The remaining two were observed using SL and Long-Low (LL; 15-36 m). SL and LL have resolving powers of R90, while SH and LH have R600.
Three of the spectra were obtained in simple staring mode, while the rest were obtained as part of clustered observations, with three slit positions stepped across the nominal source positions. For these observations, we extracted a spectrum from the center position, unless the source was bright enough to saturate the detector array in SL, in which case we reconstructed the SL spectrum from the off-center positions. For sources saturated in SL, we used an average of the two adjacent map positions and then scaled them with a multiplicative offset until they matched-up with the short-high, long-high, or long-low spectra for the same source processed as described below. Because the stars in question are point sources at the spatial resolution of the IRS, the line and continuum fluxes should scale together, but this method calls into question the absolute flux calibration of the short-wavelength portions of spectra that were saturated. However this scaling does not affect ratios of spectral feature integrated fluxes that we derived from SL spectra for use throughout this paper. Readers using these data in other ways should be aware that the photometry may be more uncertain than the signal-to-noise implies. Table 1 summarizes how each source was observed and clearly identifies those for which SL was saturated in the central map position. We present two of our sources, HD 104237 and HD 100546, in SH and LH only since their 5–10 m continuum levels are above the saturation limits of the SL module.
We started with the S14 pipeline output from the Spitzer Science Center (SSC) and followed the standard calibration method used at Cornell University, briefly summarized here. To remove the background emission from the SH and LH images, we subtracted images of the “sky” obtained by integrating on nearby offset fields. For the SL images, we subtracted images with the science target in the other aperture, so that images with the target in SL order 2 served as sky images when the image was in SL order 1, and vice versa (i.e. aperture differences). For LL, we differenced images with the source in the two nod positions in a given order (nod differences). In addition to removing the background, this step also removes the majority of rogue pixels. These pixels have temporarily high or low dark currents and are a significant source of non-gaussian noise. To correct for remaining rogue pixels and bad pixels identified in the SSC-provided mask images, we used imclean.pro222Available in IDL from the SSC as irsclean.pro.
We extracted spectra from individual images using the profile, ridge, and extract routines available as part of the Spitzer IRS Custom Extraction (SPICE) package. We used standard stars to generate spectral corrections to calibrate the extracted spectra in flux-density units. For SL, HR 6348 (K0 III) was the standard; for LL we used HR 6348, HD 166780 (K4 III), and HD 173511 (K5 III) as calibration standards. For SH and LH, we used Dra (K2 III). When combining the spectra from the two nod positions, we used the standard deviation at each wavelength to estimate the uncertainty.
The final “stitch-and-trim” step generates one continuous spectrum from the various segments. We applied scalar multiplicative corrections to eliminate discontinuities, which result primarily from the fact that the target is better centered in the slit in some exposures than in others. We scaled upwards to the best-centered aperture, which was usually LL order 2 or LH. We combined bonus-order data in SL and LL with overlapping data in the other orders, then trimmed each spectral segment to remove invalid data at the ends of the segments. Figure 1 presents the resulting spectra.
Several sources have a choppy appearance in LH, which we have called ”corrugation”. The effect is produced by a residual gradient signal on the IRS detector array (post flat field). The IRS team is working to identify the physical source of this residual, which generally appears at low light levels so usually only affects relatively faint spectra. We have removed the particularly bad corrugation in the spectrum of HD 97300 by fitting the residual signal between orders and subtracting it prior to extracting the spectrum. The rest of the spectra are not as profoundly affected and we have chosen to leave them alone since the corrugation effect does not appear in the SL or SH modules where the PAH features that we are studying appear.
2.3 Overall Spectral Properties and Classification
Figure 1 presents all of our spectra on the same axes with the flux scaled arbitrarily to allow easy comparison. Figure 2 presents the data again with each spectrum flux-calibrated and plotted on its own axes, vs. Fν. Blackbody emission from the central star and thermal emission from the circumstellar disk dominate the broad-band shapes of the spectra while the detailed structure comes from combinations of spectral features from PAHs and silicate dust grains. In Figure 1 we have organized the spectra in groups according to the classification scheme of Kraemer et al. (2002): ‘SE’ indicates the presence of silicate emission and ‘U’ indicates the presence of PAH emission (historically Unidentified InfraRed emission, hence the U). A lower-case ‘u’ indicates that the PAH emission feature contrast, relative to the continuum as measured qualitatively by eye, is relatively weak.
The presence of high-contrast PAH emission in most of our sources is striking particularly in the seven that have no silicate feature in the 10 m region (see Figure 1). The PAH feature centered at 7.7 m consists of two primary components, one at 7.65 m and the other at 7.85 m (Cohen et al., 1989; Bregman, 1989; Peeters et al., 2002). The 7.65 m feature tends to dominate the PAH spectra of reflection nebulae and H II regions where the PAHs seem to have been heavily processed. The 7.85 m feature dominates in many planetary nebulae and objects evolving away from the asymptotic giant branch (AGB) where the PAHs seem to be relatively fresh and unprocessed. We use the PAH spectral classifications of Peeters et al. (2002) who studied 57 spectra of PAH sources obtained with the ISO SWS. Of those spectra, 42 belong to Class A, which shows the PAH emission features at 6.2 and 7.7 m. They found that in spectra where the 7.85 m component dominated, the 6.2 m PAH feature was shifted to 6.3 m. They used these two characteristics as the basis for what they called Class B PAH spectra, which are characteristic for 12 of their objects. Class C, where the peak emission in the 7–9 m range is shifted to the red of 8.0 m, accounts for only 2 sources. Throughout the rest of this paper we refer to this feature complex as the 7.7–8.2 m feature. One source in their sample had characteristics of both Class A and B. We have applied this classification system to our larger HAeBe sample, and we see a strong tendency for PAH emission from HAeBe to to lie between Class B and C (Table 3).
We have detected a strong 17 m feature in HD 97300. Beintima et al. (1996) first identified the 17 m feature in ISO SWS spectra of Galactic PNe, attributing the feature to a PAH in-plane deformation mode. Recently Smith et al. (2007) reported this feature in Spitzer IRS spectra of galaxies in the SINGS survey. They noted a strong correlation between the strengths of the 17 m and 11.3 m features, concluding that the 17 m feature is associated with PAHs in galaxies. We cannot verify such a correlation in our sample, since we have many sources that excite the 11.3 m PAH features, but only one that excites the 17 m feature. PAH emission observed in other galaxies is dominated by interstellar photon-dominated regions, which produce class A PAH spectra (Peeters et al., 2002), while in our sample, HD 97300 is the only Class A PAH spectrum.
In addition to the PAH spectral classification, it is useful to look for trends in the overall shapes of the SEDs and the solid state features that are often prominent in HAeBe spectra. Meeus et al. (2001) and Acke & van den Ancker (2004) introduced a classification of the overall shape of their ISO mid-IR SEDs for 46 HAeBe stars, including several of those presented here. According to their classification, Group I SEDs rise towards longer wavelengths when plotted vs. . They suggested that Group I disks have a larger abundance of small dust grains heated in a radially flared disk. Group II systems have bluer SEDs. Their conclusion is that Group II disks are probably more flattened due to settling of dust to the disk mid-plane. Meeus et al. (2001) append the letter ’a’ to indicate the presence of solid state bands, most prominently the 10 m silicate feature, or ’b’ to indicate no solid state bands. We have included Meeus et al. group classifications with the individual spectra in Figure 2, and we have applied the Meeus et al. criterion for stars in our sample that do not appear in their sample.
2.4 Extraction of the PAH Emission Features
We use a two-step algorithm to measure the integrated flux and positions of the PAH features, following Sloan et al. (2007). First, we fit a cubic spline to approximate and remove the underlying continuum from star, disk, and silicate dust grains. This step removes the curvature under the broad PAH emission complex extending from 7.5 to 9.0 m. We use two sets of spline anchor points, for spectra with and without silicate emission. Figure 3 illustrates this procedure for spectra in our data set with different relative strengths of PAH and silicate emission.
The cubic spline fit leaves small residuals, which can result in slightly different continuum levels on the short- and long-wavelength sides of the PAH features (Figure 4). When present these asymmetries shift the apparent centers of the PAH features so we fit and subtract a line segment to each feature after fitting and removing the spline. Table 2 gives the wavelengths used to fit these segments. We fit the continuum between the blue and red pairs, and integrate the feature between them to obtain our integrated fluxes. Figure 4 illustrates this process of measuring the PAH features in the spectrum of HD 135344.333SIMBAD now refers to this source as HD 135344B. In any case it is still SAO 206462. For each PAH feature, we measure the integrated flux above the fitted line segment and we measure the central wavelength.
To determine the central wavelengths of the PAH features from the continuum-subtratcted spectra we first measure the feature integrated flux, F. We then integrate the flux in each feature starting from the continuum on the short-wavelength side and stopping at the wavelength corresponding to 0.5F. We integrate the flux in the same feature from the continuum on the long-wavelength side of the feature and stopping at the wavelength corresponding to 0.5F. We define the central wavelength as the average of these two wavelengths. The wavelength corresponding to the integrated flux median of a feature is not necessarily the same as its center wavelength because there is some uncertainty in locating the wavelengths at which the flux begins to rise above the noise on either side of the feature. We estimate the uncertainties in the central wavelengths by taking the wavelengths corresponding to and , subtracting them, and dividing by 2. Here is the flux density at the central wavelength and is the uncertainty in . Figure 5 presents the fully continuum-subtracted spectra for all sources in our sample organized roughly in order of decreasing total PAH integrated flux.
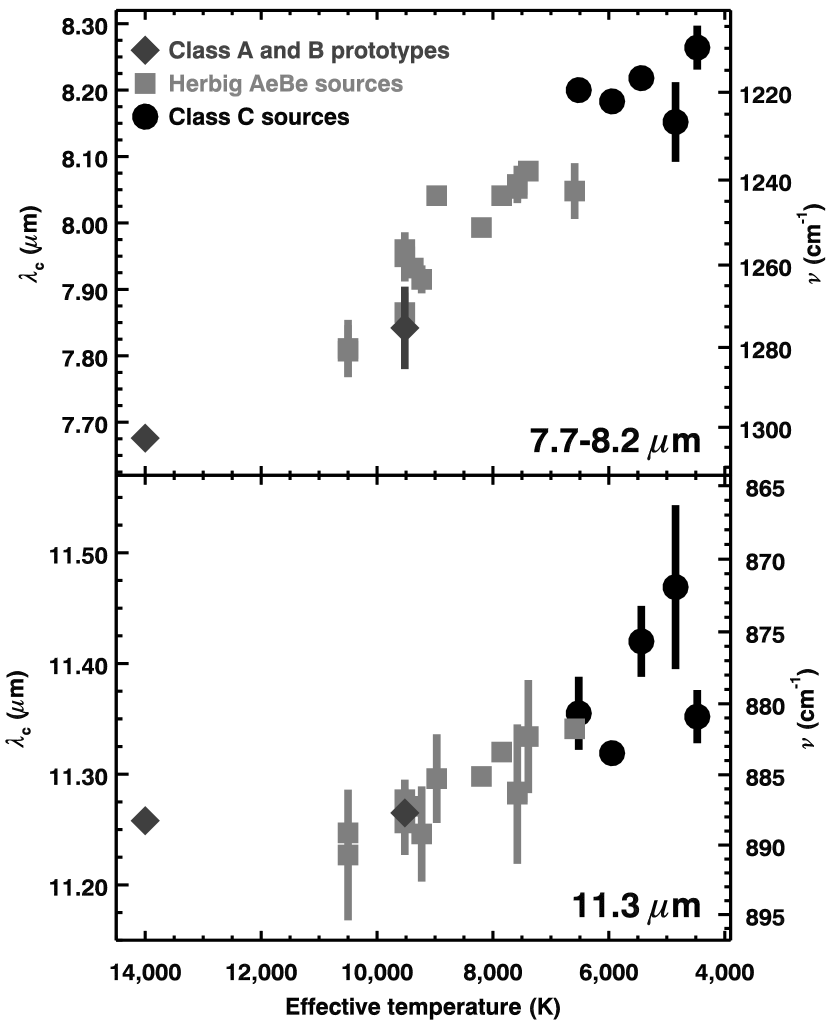
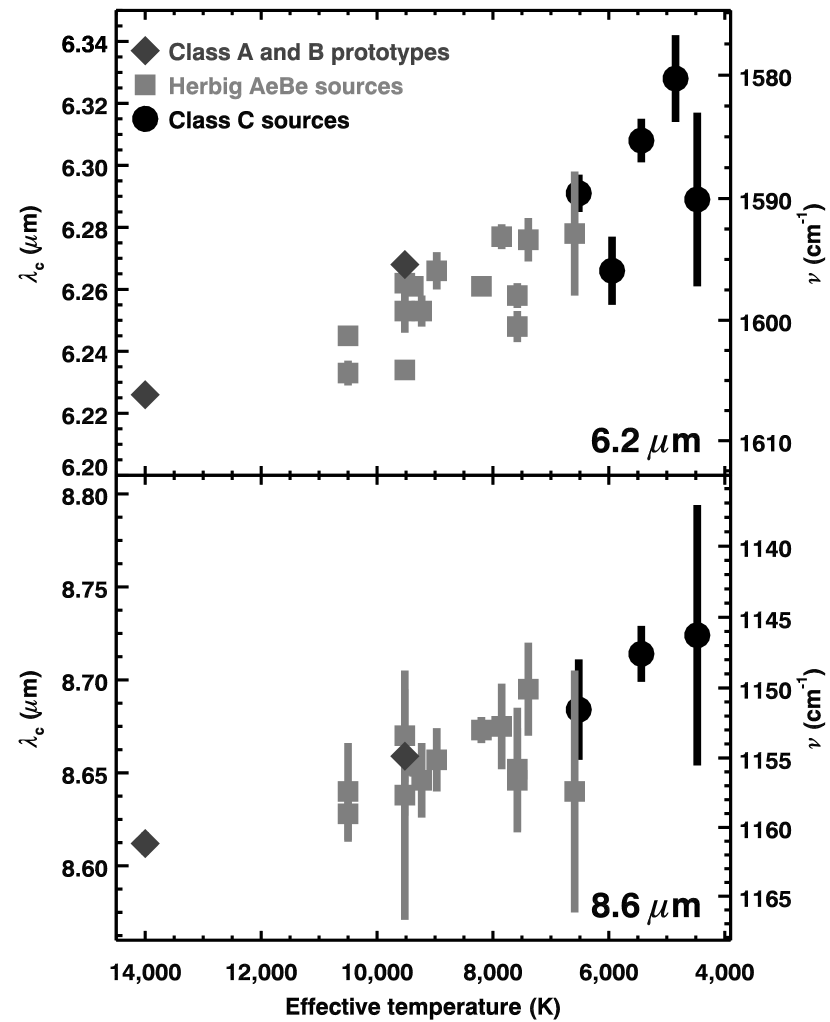
As Sloan et al. (2007) demonstrated, the wavelengths of PAH features shift as the temperature of the radiation field varies. The broad PAH features are generally thought to be combinations of narrow features (e.g. Bregman & Temi, 2005), and the central wavelength is more sensitive to variations between the strengths of various components than the peak wavelength, which will remain at the peak of the strongest feature despite variations in the strengths of any secondary components. We present central wavelengths in Table 3 and feature integrated fluxes in Table 4. Note that we list upper limits equal to in cases where the signal-to-noise ratio is S/N1.
For spectra with a PAH emission feature at 6.0 m measured to have a S/N of two or more, we remove this feature before determining the strength and position of the 6.2 m feature. Similarly, we remove the 8.6 m feature before measuring the 7.7–8.2 m feature.
The weakest continuum-subtracted PAH spectra (HD 32509, 51 Oph, HD 152404, HD 144432, and HD 31648) are for stars with strong silicate dust features at 10 m. Because the PAH features for these sources are both intrinsically weak and superposed on a continuum that is steep and varying in slope (e.g. the 10 m feature itself), we have low confidence in the accuracy of our extracted PAH center wavelengths. We have therefore omitted these five sources from the feature wavelength analysis below (Figures 6-9). We use their integrated PAH flux in our comparison of PAH emission to SED shape as inferred from continuum color indices (see further discussion in Section 3.2.1), since that analysis relies on a more qualitative treatment of overall PAH emission and does not include PAH feature wavelengths. The five sources in question are identified with asterisks in Figure 5. For HD 104237 and HD 100546, we cannot extract PAH features because we do not have usable SL spectra for those two stars; both are too bright for the IRS SL module. We present their SH and LH spectra in Figure 2 and their continuum-subtracted SH spectra in Figure 5, but do not include them in the analysis of PAH feature positions and integrated fluxes below.
2.5 PAH Flux Ratios
The 6.2 and 7.7–8.2 m features both arise from CC bonds (Allamandola et al., 1985), which are enhanced in ionized PAHs, while the 11.3 m feature, which arises from a CH bending mode, is stronger in neutral PAHs (Allamandola et al., 1999; Draine, 2003; Draine & Li, 2007). Plotting the ratio of either of the CC modes over the 11.3 m integrated flux therefore indicates the degree of ionization in the PAHs. In Paper 1 we examined these flux ratios in a sample of only four Herbig AeBe stars and found that while both ratios are supposed to measure ionization, we could not identify an obvious trend with a sample of only four stars.
The 11.3 and 12.7 m features are both C-H out-of-plane bending modes, but the 11.3 m feature arises from carbon rings with only one adjacent hydrogen (the solo mode), while the 12.7 m feature arises from rings with three adjacent hydrogens (the trio mode). Hony et al. (2001) investigated the ratio of these two features and found that it correlated with the PAH ionization ratio (as measured from the ratio of the 7.7–8.2 and 11.3 m features). They noted that PAHs with long, straight edges would have more emission at 11.3 m than at 12.7 m, while PAHs whose edges had been broken up by radiative processing would have higher 12.7/11.3 m ratios. We found a tentative correlation in Paper 1 for our small HAeBe sample that supported the conclusions of Hony et al. (2001).
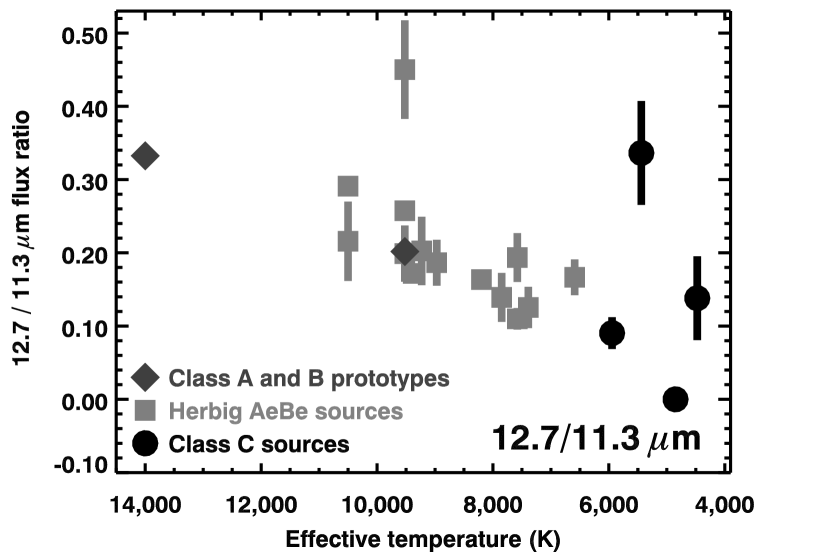
We have plotted these integrated flux ratios for our larger sample of Herbig AeBe stars in Figure 6, along with the class C PAH sources and the class A and B prototypes discussed by Sloan et al. (2007). The Class A prototype is NGC 1333 SVS 3 (a reflection nebula), the Class B prototype is HD 44179 (a post-AGB source). The Class C sources are: SU Aur (an intermediate-mass T Tau star in our sample), IRAS 13416-6243 and AFGL 2688 (both post-AGB), and two red giant stars HD 233517 and HD 100764. The top panel plots the 6.2/11.3 m ratio vs. the 7.7–8.2/11.3 m ratio. The data show a rough increase in one flux ratio as the other increases, but with substantial scatter. The variation in the relative strengths of the 6.2 and 7.7–8.2 m features is enough to affect estimates of the ionization ratio using only one of these two bands. Including the point for HD 141569 makes it tempting to report a correlation between the two, but we hesitate to draw any conclusions without data to fill the gap between it and the rest of the sample. The bottom panel of Figure 6 plots the relative strength of the trio and solo CH modes vs. ionization ratio, F12.7/F11.3. A trend of increasing F12.7/F11.3 with increasing ionization is evident.
Figure 7 illustrates that the 12.7/11.3 m integrated flux ratio varies relatively smoothly with the temperature of the central source. This figure (and the bottom panel of Figure 6) exclude a point at F12.7/F11.3 = 1.4 from AFGL 2688, one of the class C PAH sources. This spectrum and the spectrum of IRAS 134166243 have PAH features with very low contrast with respect to the strong red continuum, making our measured feature sensitive to any artifacts introduced during the spline-fitting and extraction (see Sloan et al., 2007, for more details). IRAS 13416 is one of the two remaining outliers (at T=5440 K), for the same reason. The remaining outlier is HD 141569, which is highly ionized for its temperature (Figure 6) and appears to be more heavily processed than otherwise similar objects.
3 DISCUSSION
Since PAH emission is present in so many HAeBe stars and, when present, may play a significant role in the energy balance of the circumstellar material (Kamp & Dullemond, 2004), we should ask both what the PAH emission tells us about circumstellar disks orbiting intermediate-mass stars and what the environment around these stars can help us learn about PAHs as diagnostics in other astrophysical environments. In Paper 1 we concentrated primarily on the latter analysis because of the small size of our HAeBe sample at the time. In the present study we expand the detailed analysis of mid-IR PAH emission from HAeBe stars that we started in Paper 1, including comparisons of the spectra to preliminary models of Ae star-disk systems. We find that the larger sample reveals some trends that will help with both questions. A detailed discussion of the physical nature of circumstellar disks necessarily depends on accurate measurements or derivations of the physical characteristics of the host stars, which we summarize in Table 5.
3.1 Physical Characteristics of the PAH Molecules and Their Environments
In Paper 1 we noted that the four HAeBe stars we studied had PAH spectra with their 6.2 m and 7.7–8.2 m features shifted to the red (e.g. Peeters et al., 2002, Class B or Class B/C) relative to PAH spectra from HII regions. Adding more stars to the sample increases our confidence in this conclusion. The Peeters et al. sample included only two isolated HAeBe stars (HD 100546 and HD 179218), but their classifications indicated that the degree of processing of the PAH molecules is less in HAeBe disks than in interstellar PDRs. That trend is much more obvious in the present HAeBe sample.
Photo-processing of PAHs by the stellar radiation field is evident in our analysis of the spectra of HAeBe stars. Figures 8 and 9 show that all of the PAH features in the 6–13 m range have their centers shifted to redder wavelengths as the stellar effective temperature decreases. Note that the vertical scatter in the data is real, not statistical, in the sense that earlier episodes of PAH processing (e.g. prior to the current stellar radiation field) have already altered the emission feature centers to varying degrees (Sloan et al., 2007). Nevertheless a clear trend is evident in the data. This trend strengthens the tentative conclusion in Paper 1 that the shifts in PAH feature wavelengths indicate the degree to which the molecules have been exposed to the stellar radiation fields and therefore how processed they are (i.e. ionized, fragmented, and/or dissociated) for a given star-disk system. The Peeters et al. classifications appear to be tracing the extent to which PAH molecules have been processed by their environments, particularly the stellar radiation field, with Class A representing the most processed and Class C the least processed PAHs. Isolated HAeBe stars occupy a narrow range spanning Classes B and C.
The HAeBe PAH spectra resemble those of post-AGB objects in which the PAH molecules are relatively unprocessed (i.e. newly formed). In the case of HAeBe stars, since there is no clear formation process for PAHs in the stars or the disks, it is more likely that the PAHs appear less processed because they are newly released into the stellar radiation field from some primordial reservoir. The source of PAHs may be evaporation of the icy mantles on dust grains formed earlier in the proto-stellar material and containing pristine PAH molecules (e.g. preserved from the pre-stellar ISM). This implies that PAHs in HAeBe disks are constantly being destroyed and replenished from the reservoir by the stellar UV-optical radiation field. It would also explain the strong PAH sources that completely lack 10 m features commonly associated with a large component of warm, relatively small silicate dust grains in disks. Icy mantles on larger dust grains can evaporate, releasing PAHs in the absence of small silicate grains. We suggest that disks with this ”PAH no-silicate” spectrum (in our sample, HD 34282, HD 97048, HD 97300, HD 100453, HD 135344, HD 141569, and HD 169142) have a large inner cavities that are cleared of dust out to radii of at least a few AU, i.e. disks with inner holes. All of the stars in our sample that have this distinctive spectrum, except HD 97300, share an overall SED structure resembling the transitional disks recently identified and studied in T Tauri systems (e.g. Uchida et al., 2004; D’Alessio et al., 2005; Calvet et al., 2005; Espaillat et al., 2007; Brown et al., 2007). Since PAH molecules are stochastically heated by individual optical-UV photons they can emit despite being located far from the star while the dust in the transitional disks is too far, therefore too cold, to emit the 10 m feature. With the exception of HD 141569, the ”PAH no-silicate” systems have strong near-infrared excesses. The NIR excess in these systems may be a combination of strong NIR line emission (e.g. warm molecular gas emission from the inner cavity and recombination emission from gas accretion flows) and black-body emission from small bodies (e.g. very large dust particles, planetesimals, asteroids) orbiting in the inner disk region.
3.2 Disk Geometry and the Locations of the Emitting PAH Molecules
Meeus et al. (2001) suggested that HAeBe stars with redder (Group I) SEDs have a long-wavelength component indicating smaller dust grains that are located in a relatively warm, radially flared region of the disks. Their Group II contains SEDs that lack the warm, small-grain component. They interpreted Group II SEDs as indicating a more flattened disk containing mostly larger dust grains that have settled to the disk mid-plane, whereas Group I SEDs represent disks with a substantial radial flare. Subsequent modeling by Dominik et al. (2003) have supported these conclusions. Meeus et al. (2001) and Acke & van den Ancker (2004) also noticed a tendency for the Group I sources to be among the in which they detected PAH features in ISO SWS spectra. For the sources with stronger PAH emission, our results are consistent with Acke & van den Ancker (2004); the strongest PAH sources are in fact all Group I. However the higher sensitivity of the Spitzer IRS has revealed that some Group I sources have weak PAH emission and that many Group II sources that were tentative ISO SWS detections in only the 6.2 m feature are PAH emitters in all of the mid-IR PAH features (e.g. HD 141569, HD 142666, HD 35187, HD 31648, HD 144432). Thus, although it does seem that the PAH emission comes from the illuminated surfaces of flared disks, we suggest that such emission is not an unambiguous tracer of flared geometry in HAeBe disks.
Doucet et al. (2007) recently detected the flared disk around HD 97048 in a mid-IR direct imaging study. The flaring disk is evident in the image, and the source is more extended in the 11.3 m PAH feature than in the adjacent continuum. Grady et al. (2005) reported that mid-IR PAH emission, in particular the 6.2 m feature, correlates with optical scattered light visibility of the inner disks (r50-70 AU) of some HAeBe stars. Since the PAH features and H2 line emission are often strong where the optical-UV radiation field is strong (e.g. interstellar photon-dominated regions), they should trace material that is far enough above the disk mid-plane to be directly illuminated by the star. Grady et al. (2005) therefore suggest that both the optical visibility of the disk and the mid-IR PAH emission should correlate with flaring and anti-correlate with dust settling to the disk mid-planes. However, four of the STIS scattered light non-detections from Grady et al. (2005) are in our sample (HD 31648, HD 104237, HD 135344, HD 142666). All but HD 104237 clearly have PAH emission in our spectra. These apparently optically dark disks have optically visible stars so their disk surfaces cannot appear dim to us simply because we are seeing them nearly edge-on. In fact their inclination angles range from 38° to 55° (Table 5). Apparently disks with relatively little scattered optical light are still illuminated enough to excite PAH emission, or the PAH emission comes from the inner disk and not from the atmospheres of the outer disks.
Although it is tempting to use the PAH emission strength as a preliminary diagnostic of overall disk geometry, especially for those sources whose disks are unresolved or marginally resolved in visible, near-IR, and mid-IR images, we suggest that some caution is indicated. The question remains as to whether large-scale radial flaring dominates or whether shadowing of the outer disk by structures in the inner disk may play a role. The former possibility implies that flared disks should be strong PAH emitters unless we happen to view them edge-on. The latter possibility implies that illumination of even highly flared disks can nevertheless be partially and/or temporarily attenuated by structures in the inner disk–within a few AU of the star–and therefore produce weak or non-PAH emitters as well as weak or non-detections in optical/NIR scattered light observations.
3.2.1 SED Shape and PAH Emission
The geometry of the disks alters their SED significantly and there have been many efforts to quantify this relationship for circumstellar accretion disks, including those around HAeBe stars, both empirically (e.g. Meeus et al. (2001)) and with detailed models (e.g. Dominik et al., 2003; Dullemond & Dominik, 2004; D’Alessio et al., 2001, 2005, 2006). Recently Furlan et al. (2006) and Watson et al. (2007) have combined these approaches to study disks around low-mass young stellar objects in Taurus. They used continuum color indices derived from Spitzer IRS spectra to characterize the SED shape for comparison to grids of accretion disk models by D’Alessio et al. (2006). They defined the color indices by differencing fluxes in two narrow wavelength bins located between the prominent solid state features, essentially providing a measure of the slope of the SED between the two wavelength bins. The differences in flux () from one bin to the next (e.g. from a to b), expressed as ratios of their base-ten logarithms, form the color index, :
.
We have chosen spectral bins for our indices that avoid both the solid state features and the PAH features that are common in HAeBe spectra: 5.4–6.0 m, 13.0–14.0 m, and 29.75–31.75 m, labeled 6, 13, and 30 m respectively. Following Furlan et al. (2006), we have analyzed our sample stars using vs. color-color diagrams.
D’Alessio et al. (2006) found that model star-disk systems changed location on such color-color diagrams extracted from grids of model SEDs in which degrees of dust settling and disk inclination were allowed to vary. Furlan et al. (2006) and Watson et al. (2007) found that plotting their samples of low-mass YSOs on the same color-color diagrams indicated a wide range of dust grain sizes, which they interpreted as degrees of dust settling to the disk mid-plane. D’Alessio and collaborators have begun generating similar models for Herbig Ae stars and we can now begin a similar analysis for intermediate-mass star-disk systems. Since these models are still in a preliminary stage of development, in this paper we will use them only to infer schematic trends in disk physical characteristics indicated in continuum color-color diagrams. More detailed predictions and estimates of disk properties for individual HAeBe systems will be the focus of a forthcoming study.
3.2.2 Model Physics
The fundamental physics of the disk model we use is described in D’Alessio et al. (1998, 1999). We assume a steady state, axisymmetric and geometrically thin disk. Its mass accretion rate () is taken to be uniform (spatially constant). We decouple the equations for the disk vertical and radial structure since the disk is geometrically thin. In the vertical direction the disk is in hydrostatic equilibrium with the energy being transported by radiation, turbulent conduction, and convection; the latter mechanism is active only where the convective instability criterion is satisfied. In the radial direction, the disk is assumed to be in centrifugal balance in the potential well of the star, i.e., a Keplerian disk. The primary disk heating sources are viscous dissipation, with the viscosity coefficient given by the prescription (Shakura & Syunyaev, 1973), and stellar irradiation. In order to calculate the transfer of disk and stellar radiation, we use mean opacities in which the average of the monochromatic opacity is calculated using, as weighting functions, either the Planck function (or its derivative with respect to temperature) evaluated at the local kinetic temperature or the star radiation temperature, respectively. For simulating the effect of dust settling, we assume that the disk has two populations of dust grains, with different grain-size and spatial distributions. In the disk atmosphere there are small grains, depleted with respect to the standard dust to gas mass ratio (D’Alessio et al., 2006). Closer to the mid-plane, there are larger dust grains, with an enhanced dust to gas mass ratio, which accounts for the mass in grains that have disappeared from the upper layers. For simplicity, we assume that the settling is only in the vertical direction. The boundary conditions for the transfer equations are given in the ”irradiation” surface, defined as the surface where the mean radial optical depth to the stellar radiation is unity. The larger the depletion in the upper layers, the smaller the height of the irradiation surface, i.e., the smaller the degree of flaring of the disk. The flatter the disk, the smaller the fraction of stellar radiative flux intercepted by its surface.
The disk inner boundary is assumed to be the radius where optically thin dust, heated by the star, reaches its sublimation temperature. Assuming that silicates comprise the dust component with largest abundance, sublimated at the highest temperature, we adopt a dust sublimation temperature of 1400 K. The disk inner wall model is described by Muzerolle et al. (2003) and D’Alessio et al. (2005). It is assumed to be a plane-parallel atmosphere, with constant temperature in the vertical direction, heated by the star in the radial direction. The temperature of this atmosphere is calculated as a function of the mean optical depth in a direction parallel to the disk mid-plane (radial, in cylindrical coordinates). The vertical height of the wall is roughly estimated as the height where the mean radial optical depth to the stellar radiation is unity, which depends on the opacity and density at the wall. We assume the wall is in vertical hydrostatic equilibrium with gas in LTE and the same dust properties as in the disk atmosphere. The SED of the wall and the SED of the disk are calculated separately.
All of our disk models are flared to varying degrees. Being 1+1D (i.e., with the vertical and radial structure calculated separately), these models do not account for the possibility of shadowing. However, the scale height of the wall and the scale height of the flared disk at the same radius are very similar, mostly because the mid-plane of the disk is heated by viscous dissipation, which is not included in our wall model. This heating mechanism seems to compensate for the difference in the incident stellar flux between the wall and the disk. Thus, our disk models are not puffed-up in the way described by Dullemond et al. (2001). When the wall has dust settled towards its mid-plane, its effective height (i.e., the size of its emitting area) is smaller than the the wall with no settling. Thus, the contribution to the SED of the former is smaller than the contribution of the later. The SEDs of both kinds of models are added to the same SED of the rest of the disk, from which the contribution to the emission of its inner boundary has been removed.
3.2.3 The distribution of PAH emission with color index
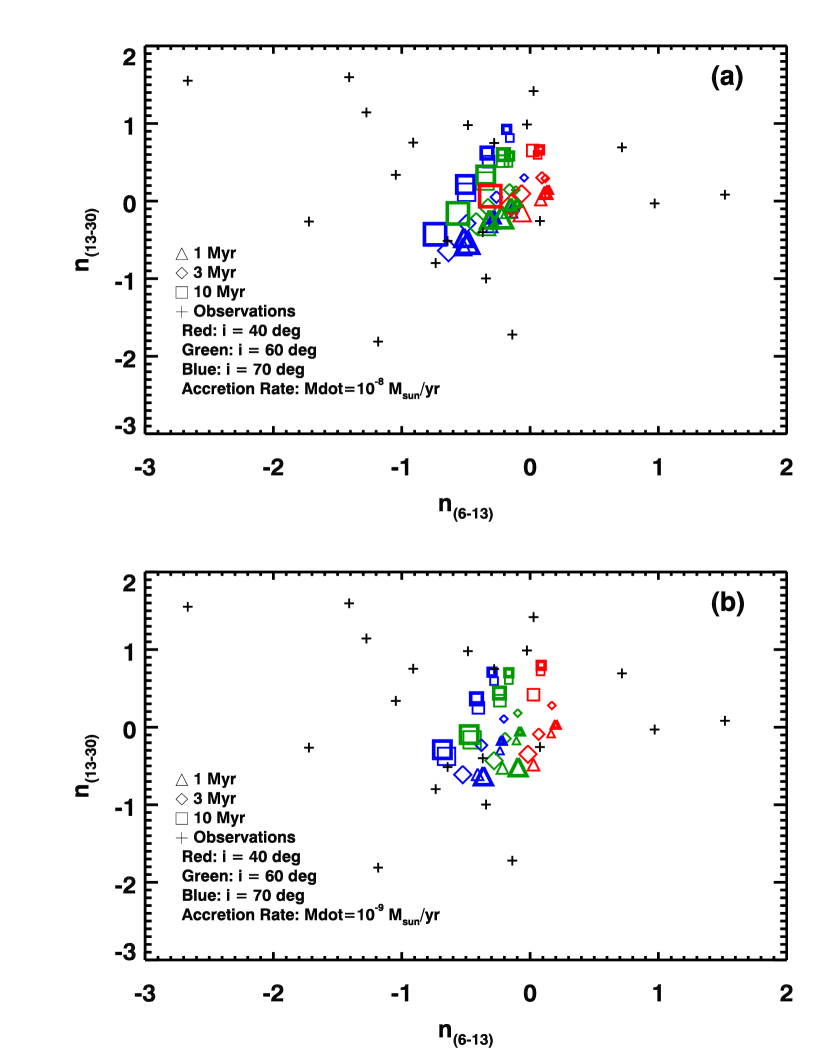
In Figure 10 we present n6-13 vs. n13-30 color-color diagrams derived from a grid of model disk systems for stellar spectral types A2 and A6, as well as varying inclination angle (40°- 70°), mass accretion rates ( and ), age (1 Myr - 10 Myr), and degree of atmospheric dust grain depletion (=0.001 - 1.0). The depletion factor, , varies from 1.0 to 0.001 and represents the dust-to-gas mass ratio for disk atmospheric silicate dust grains relative to the solar dust-to-gas mass ratio (D’Alessio et al., 2006). Thus is a measure of the depletion of atmospheric grains as they settle to the disk midplane. Decreasing is an indicator of overall disk settling from flared to more flattened geometry. The more flattened disks will tend to occupy the bluer (lower left) region of the color-color diagram in Figure 10, while more flared disks will be redder and located towards the upper right. Disk inclination increases right to left while stellar age increases from lower right to upper left.
Figure 10a contains models for mass accretion rates of (top panel) and (bottom panel) in which the dust in the inner wall of the disk has settled. Figure 10b, with the same accretion rates in the top and bottom panels, contains models for which dust in the inner wall has not settled. The inner wall is located at the inner radius of the disk. We have over-plotted our observed color indices for comparison with the models. The models and observed colors overlap, but the observed HAeBe stars cover a larger range of parameter space than the current grid of models.
We plot our star sample on an identical color-color diagram in Figure 11 with the PAH flux (Figures 11a and 11b) indicated in the figure by the size of the hexagonal symbols that are centered on the star colors. We calculated the total PAH flux for each star by summing the integrated fluxes of the 6.2, 7.7–8.2 m 11.3, and 12.7 m features and dividing by the square of the stellar distance normalized to 100 pc so that the symbol sizes in Figure 11a represent the intrinsic total PAH emission for each star. Because the 11.3 m PAH feature coincides with the 11.1 m feature of crystalline silicates (olivine) and since both can be strong in HAeBe stars (e.g HD 144432, Figure 2), we have also computed luminosities for the 6.2 m feature alone (Figure 11b). The 6.2 m feature is not near other PAH or silicate features so it serves as an independent indicator of PAH emission strength. A comparison of Figures 11a and 11b shows that they are not identical, but the feature that we extracted at 11.3 m seems to be dominated by the PAH emission. Note that our continuous color indices are consistent with the discrete Group designations of Meeus et al. (2001). Group I disks are flared and Group II disks are more flattened. Nevertheless, Group I disks have a wide range of PAH integrated fluxes.
3.2.4 Notes on HAeBe stars that do not overlap the models
In our analysis of color indices in the previous section we noted that our data have a larger range of colors than the present grid of models. Twelve stars have colors outside the range of the model grid: HD 32509, HD 34282, HD 281789, HD 152404, HD 169142, HD 97300, HD 135344, HD 139619, HD 141569, HD 169142, 51 Oph, and Elias 3-1. Two of these, 51 Oph and HD 97300 are probably not HAeBe stars. The remaining ten stars include HD 32509, which has NO measurable PAH emission, and five Group I stars with relatively weak PAH emission. Furthermore, all of the seven sources in our sample that have PAH emission, but no 10 m silicate emission feature, are in this ”outlier” sub-sample.
HD 141569 is a more evolved system with substantial clearing of material in its disk (Merin et al., 2004; Augereau et al., 1999; Weinberger et al., 1999) . If the inner disk structure allows stellar radiation farther into the disk where PAHs may be released from icy mantles on large grains, this could explain why HD 141569 is by far the most ionized PAH spectrum in our sample. HD 169142 appears to be in an epoch of central clearing of the disk and may resemble Vega in an earlier epoch of its disk evolution (Grady et al., 2007). The disk orbiting HD 100453 seems to be dominated by large dust grains (Vandenbussche et al., 2004).
HD 97300 is a B9 star located in the Chamelion I cloud that is close to the zero-age main sequence and has no near-IR excess emission or H emission (Siebenmorgen et al., 2000). Siebenmorgen et al. (1998) report that the PAH spectrum is a mixture of a small amount of emission from a circumstellar disk and a large amount from the very bright, ring-shaped reflection nebula that HD 97300 illuminates. Although HD 97300 has been included in past studies of Herbig AeBe stars, we suggest that its Herbig Be classification may be in error since it is the only Class A PAH spectrum in our sample and the only source in our sample with emission in the 17 m feature. Certainly the fact that it lacks both H emission and any near-IR excess suggests a more evolved system that has ceased active accretion. The PAH spectrum of HD 97300 is probably dominated by interstellar PAHs rather than PAHs in a circumstellar disk.
3.3 What does PAH emission tell us about HAeBe disks?
At first glance a weak correlation of PAH luminosity with color index is evident in Figure 11a. Although there are no strong HAeBe PAH emitters that have colors indicating highly settled disks, there are six relatively weak PAH sources that have colors indicating that they should have flared disks: HD 34282, HD 100453, HD 35344, HD 139614, HD 141569, and SU Aur. The Meeus Group classifications and the spectral indices are consistent in their segregation of the stars in Figure 11, which we illustrate schematically with a dashed line that roughly separates the Group I and Group II sources in our sample. We use Figure 12 to illustrate the frequency of Groups I and II as a function of the n13-30 spectral index (the vertical axis in Figure 11). The Meeus Groups form a bimodal distribution in our sample that is consistent with the interpretation that those Groups distinguish between flared and flattened (or non-settled and settled) disk geometries. Nevertheless, we see overlap in Figures 11 and 12; there are relatively weak PAH emitters that should have radially flared disk geometries according to both discrete (Meeus Group) and continuous (spectral index) SED classifications. Why do some apparently flared disks have weak PAH emission?
We suggest several possible explanations for the absence of strong PAH emission in radially flared disks, which should have a large surface area directly illuminated by the star: (1) the abundance of PAHs in the disk atmospheres of those systems (either free-floating or locked-up in icy dust grain mantles) is intrinsically low; (2) PAHs are abundant in the disk atmospheres, but a strong stellar UV flux has destroyed most of the PAHs in the emitting region of the disk; (3) we are viewing those systems edge-on or nearly so; or (4) the inner walls of the disks are attenuating or softening the stellar illumination of a flared outer disk as suggested by Acke & van den Ancker (2004) and explored in detail more recently by Isella et al. (2006). We now explore these hypotheses in turn.
PAH Abundance. If, as we suggested earlier, most of the emitting PAHs in HAeBe disks are released from icy mantles and if the PAHs are then destroyed by the photo-processing that makes them emit, it is possible that the icy reservoir might eventually be exhausted. In this scenario the radially flared disks with relatively weak PAH emission may simply have evaporated their PAH reservoirs more thoroughly than the stronger PAH emitters. With the exception of SU Aur, an intermediate-mass T Tauri star, the flared disks with weak PAH emission all have SEDs that resemble transitional disks. They may be the most evolved disk systems in our sample.
Destruction of PAHs. We cannot blame a strong UV field destroying PAHs since some of the hottest stars in our sample excite very strong PAH emission (e.g. Elias 3-1, AB Aur, & HD 97300). We illustrate this in Figure 11c, where the symbol sizes are proportional to the total PAH flux density () divided by the stellar bolometric luminosity () for each source. In Figure 11d, symbol sizes are proportional only to the stellar bolometric luminosity. We calculated bolometric luminosities using published values of the apparent visual magnitudes, distances, and extinctions for our sample stars (Table 5). Bolometric corrections are for luminosity class V (Kenyon & Hartmann, 1995). There is no indication in Figures 11c-d that stellar luminosity correlates inversely with PAH intensity. There is some indication that the opposite is true, but not uniformly in our sample (Figure 11d). Finally, as a sub-sample the ”weak” PAH Group I sources are not uniformly the most processed nor are they all the most ionized sources in our sample. We therefore conclude that differences in the stellar radiation field from system to system alone cannot account for the variations in PAH emission.
Disk Inclination. For sources with measured inclinations we see no indication that more inclined disks (large , see Table 5) have weaker PAH emission. None of the stars have silicate absorption features at 10 m and those with the weakest silicate emission have very strong contrast in the PAH features. Thus inclination of the disks along our line of sight cannot explain the variation in PAH luminosity among the redder disks. Table 5 also lists measured extinctions towards most of our sample stars, which show no trend towards decreased PAH emission for more highly extinguished sources. In fact, none of our sources, not even Elias 3-1 with Av=4.05, has enough extinction to significantly alter its mid-IR SED. The bottom line is that there are highly flared disks nearly facing us that are nevertheless weak PAH emitters. The models summarized in Figure 10 indicate that inclination should affect the mid-IR colors of our sources and though we see a range of colors, we see no trend for PAH emission to weaken as colors change due to disk inclination (e.g. from lower right to upper left in Figures 10a and 10b).
Attenuated Radiation or Shadowing by the Inner Disk. The spatial distribution of PAH molecules in proto-planetary disk systems is a subject of current discussion. Since there is no clear formation path for PAHs in proto-planetary disks, the PAHs are likely primordial in the sense that they were present in the ISM before the star and disk formed (Li & Lunine, 2003). Acke & van den Ancker (2004) concluded that the PAH emission must originate from the denser environment of a disk rather than from a large diffuse halo or envelope around the star. More recently Visser et al. (2007) have modeled the chemistry and infrared emission from PAHs around HAeBe stars. After comparing their models to observational studies of extended PAH emission around HAeBe stars (e.g. Geers et al., 2005, 2006; Habart et al., 2006; Vandenbussche et al., 2004) they conclude that PAH molecules with sizes of 100 carbon atoms are responsible for most of the observed emission. PAH molecules that big can survive the stellar radiation fields of intermediate-mass stars down to a minimum radius of 5 AU. Thus, Visser et al. (2007) predict that about 60% of the PAH emission in the 6–13 m range originates within 100 AU of the star.
For disks that are no longer accreting material onto their stars, a puffed-up inner wall in the flared Group I disks may attenuate or soften the stellar radiation field illuminating some or all of the outer disk. This may be a relatively short-lived stage in what appear to be disks in transition from flared to flattened. If planet formation clears an inner hole, then the gas in the inner wall could be vertically inflated relatively quickly (and to varying degrees depending on the system) by photoelectrons ejected by UV photons from PAHs and small dust grains. Thus for a short time, prior to the cooling and settling of the outer disk, there can be both a high inner wall and a radially flared outer disk. As the grain growth and disk settling proceed, the flare of the disk may decrease until the PAH-rich parts of the outer disk settle into the shadow of the inner disk wall. Thus redder disks that are weak PAH emitters may be in an intermediate or transitional stage of disk evolution. We note that this suggested scenario is beyond the scope of our current grid of disk models to predict since those models contain no treatment of shadowing in the disks.
4 SUMMARY AND CONCLUSIONS
We have presented Spitzer IRS spectroscopy of a sample of 22 targets including 18 Herbig Ae/Be stars and two intermediate-mass T Tauri stars whose spectra show strong PAH emission. The absence of silicate emission in seven of the sources has enabled a detailed analysis—independent of mineralogy estimates or specific disk models–of the relative strengths and positions of PAH emission features in the 5–14 m region. For the remaining stars that do have solid state emission features, we have run the same PAH spectral analysis by fitting and subtracting dust continuum and dust emission features with a model-independent method, isolating the PAH spectrum. This relatively large sample and the detailed analysis afforded by high signal-to-noise IRS spectra led us to the following conclusions:
-
•
PAHs exposed to stronger stellar radiation fields may become shattered and develop more jagged edges so that the 11.3 m mono C-H bending mode is attenuated with respect to the 12.7 m trio C–H bending mode. PAH ionization fraction, inferred from the PAH F7.7-8.2/F11.3 ratio, is related to the structure (and possibly the size) of the PAH molecules.
-
•
The center wavelengths of the 6.2, 7.7–8.2, 8.6, and 11.3 m emission features change as the stellar effective temperature changes. We confirm our previous finding that the center wavelengths of the PAH emission features increase with decreasing effective temperature of the host star, now with a much larger sample of stars. We conclude that hotter stars photo-process the PAHs more than cooler stars do and that the degree of processing alters the PAH spectrum measurably.
-
•
Our sample shows spectral characteristics generally consistent with the boundary between Class B or C PAH emission sources defined by Peeters et al. (2002), viz. a 6.2 m feature shifted to 6.3 m and 7.7–8.2 m emission dominated by the component at 7.9 m. However, in some of our sources, the 7.7–8.2 m feature center is shifted closer to 8.0 m, as in the spectrum of HD 100546, a HAeBe star observed by the SWS on ISO and included in our sample. It is remarkable that HAeBe stars as a class have such a variety of PAH luminosities and ionization fractions, but such a narrow range of PAH spectral classifications. This may indicate that the PAH molecules are altered by the same physical processes in the disks, perhaps unique to HAeBe stars. In any case we propose that the HAeBe stars comprise a distinct PAH spectral group of their own. HAeBe PAH spectra indicate very little processing of the PAH molecules by the stellar radiation field, relative to other types of PAH source (e.g. HII regions, PDRs, and PNe).
-
•
The other Peeters Class B objects are post-AGB and that implies that the PAH are less processed and therefore relatively new to the scene in Herbig Ae/Be disks. This is consistent with the suggestion that the PAHs are introduced at a stage of disk evolution when icy mantles evaporate from large dust grain surfaces. If this is the case, then the PAHs near HAeBe stars are being constantly destroyed and replenished by interactions with the stellar radiation field since we do not observe HAeBe systems with the (apparently more processed) Class A spectra.
-
•
We have detected the 17 m PAH complex in one of our sample HAeBe stars, HD 97300, which stands apart form the rest of our sample as the only class A (e.g. highly photo-processed) PAH spectrum and is likely not a Herbig Ae/Be star. The 17 m feature is commonly observed in the Galactic ISM and in other galaxies where strong UV fields excite extensive PDRs. HD 97300 is also a Meeus Group IIb source having no warm small grain component in its SED and no silicate features at 10 m or longward of 20 m. We suggest that, whatever the classification of HD 97300, it’s spectrum is dominated by PAHs in the surrounding interstellar gas and not in a circumstellar disk.
-
•
Our sample includes both flared (Meeus et al. 2001, Group I) and flattened/settled (Group II) systems, but the overall PAH emission does not decrease monotonically with indicators of depletion of small dust grains and disk settling, as one would expect if the PAH emission only originates in an optically and geometrically thin surface layer of a radially flared disk.
-
•
Taking into account estimates of disk inclination for the sources in our sample does not uncover a direct correlation of weak PAH emission with indicators of nearly edge-on disk geometry. Nor can we explain the anomaly by invoking strong stellar radiation fields to destroy or process the PAHs so that they emit less light in some disks.
-
•
Differences in PAH abundance in the illuminated parts of HAeBe disks and/or evolution of the inner disk scale height appear to be possibilities for explaining highly flared disks that have relatively weak PAH emission. These sources may be intermediate-mass versions of the transitional T Tauri disks.
A larger sample of HAeBe stars will allow us to better determine what a ”normal” HAeBe star looks like. We have begun the next step, a thorough modeling effort including the addition of detailed PAH spectral synthesis and careful application of mineralogical models for an even larger sample of stars.
References
- Acke & van den Ancker (2004) Acke, B. & van den Ancker, M. E. 2004, A&A, 426, 151
- Allamandola et al. (1999) Allamandola, L. J., Hudgins, D. M., & Sandford, S. A. 1999, ApJ, 511, L115
- Allamandola et al. (1985) Allamandola, L. J., Tielens, A. G. G. M., & Barker, J. R. 1985, ApJ, 290, L25
- Augereau et al. (1999) Augereau, J. C., Lagrange, A. M., Mouillet, & Menard, F. 1999a, A&A, 350, L51
- Berthoud et al. (2007) Berthoud, M. G., Keller, L. D., Herter, T. L., Richter, M. J., & Whelan, D. G. 2007, ApJ, 660, 461
- Beintima et al. (1996) Beintima et al. 1996, A&A, 315, L369
- Bregman (1989) Bregman, J. D. 1989, in Interstellar Dust, Proc. IAU Symp 135, ed. L. J. Allamandola & A. G. G. M. Tielens, 109
- Bregman & Temi (2005) Bregman, J. D. & Temi, P. 2005, ApJ, 621, 831
- Brittain et al. (2007) Brittain, S. D., Simon, T., Najita, J. R., & Rettig, T. W. 2007, ApJ, 659, 685
- Brown et al. (2007) Brown, J. M., et al. 2007, ApJ, 664, L107
- Calvet et al. (2004) Calvet, N., Muzerolle, J.; Briceño, C., Hernández, J., Hartmann, L., Saucedo, J. L., & Gordon, K. D. 2004, AJ, 128, 1294
- Calvet et al. (2005) Calvet, N., et al. 2005, ApJ, 630, L185
- Cohen et al. (1989) Cohen, M., Tielens, A. G. G. M., Bregman, J., Witteborn, F. C., Rank, D. M., Allamandola, L. J., Wooden, D., Jourdain de Muizon, M. 1989, ApJ, 341, 246
- D’Alessio et al. (1998) D’Alessio, P., Canto, J., Calvet, N., & Lizano, S. 1998, ApJ, 500, 411
- D’Alessio et al. (1999) D’Alessio, P., Calvet, N., Hartmann, L., Lizano, S., & Cantó, J. 1999, ApJ, 527, 893
- D’Alessio et al. (2001) D’Alessio, P., Calvet, N., & Hartmann, L. 2001, ApJ, 553, 321
- D’Alessio et al. (2005) D’Alessio, P., Calvet, N., & Woolum, D. S. 2005, Chondrites and the Protoplanetary Disk, 341, 353
- D’Alessio et al. (2006) D’Alessio, P., Calvet, N., Hartmann, L., Franco-Hernández, R., & Servín, H. 2006, ApJ, 638, 314
- Dominik et al. (2003) Dominik, C., Dullemond, C. P., Waters, L. B. F. M., & Walch, S. 2003, A&A, 398, 607
- Doucet et al. (2007) Doucet, C., Habart, E., Pantin, E., Dullemond, C., Lagage, P. O., Pinte, C., Duchêne, G., & Ménard, F. 2007, A&A, 470, 625
- Dullemond et al. (2001) Dullemond, C. P., Dominik, C., & Natta, A. 2001, ApJ, 560, 957
- Dullemond & Dominik (2004) Dullemond & Dominik 2004, A&A, 417, 159
- Dullemond et al. (2007) Dullemond, C. P., Henning, T., Visser, R., Geers, V. C., van Dishoeck, E. F., & Pontoppidan, K. M. 2007, A&A, 473, 457
- Draine (2003) Draine, B. T. 2003, ARA&A, 41, 241
- Draine & Li (2007) Draine, B. T. & Li, A. 2007, ApJ, 657, 810
- Dunkin et al. (1997) Dunkin, S. K., Barlow, M. J., & Ryan, S. G. 1997, MNRAS, 286, 604
- Dunkin et al. (1998) Dunkin, S. K. & Crawford, I. A. 1998, MNRAS, 298, 275
- Espaillat et al. (2007) Espaillat, C., Calvet, N., D’Alessio, P., Hernández, J., Qi, C., Hartmann, L., Furlan, E., & Watson, D. M. 2007, ApJ, 670, L135
- Furlan et al. (2006) Furlan, E., et al. 2006, ApJS, 165, 568
- Geers et al. (2006) Geers, V. C., et al. 2006, A&A, 459, 545
- Geers et al. (2005) Geers, V. C., Augereau, J.-C., Pontoppidan, K. M., Käufl, H.-U., Lagrange, A.-M., Chauvin, G., & van Dishoeck, E. F. 2005, High Resolution Infrared Spectroscopy in Astronomy, 239
- Grady et al. (2007) Grady, C. A., et al. 2007, ApJ, 665, 1391
- Grady et al. (2005) Grady, C. et al. 2005, ApJ, 630, 958
- Gray & Corbally (1998) Gray, R. O. & Corbally, C. J. 1998, AJ, 116, 2530
- Habart et al. (2006) Habart, E., Natta, A., Testi, L., & Carbillet, M. 2006, A&A, 449, 1067
- Herbig (1960) Herbig, G. H. 1960, ApJS, 4, 337
- Hernández et al. (2006) Hernández, J., Briceño, C., Calvet, N., Hartmann, L., Muzerolle, J., & Quintero, A. 2006, ApJ, 652, 472
- Hony et al. (2001) Hony, S., Van Kerckhoven, C., Peeters, E., Tielens, A. G. G. M., & Allamandola, L. J. 2001, A&A, 370, 1030
- Houk & Crowley (1975) Houk, N., & Cowley, A. P. 1975, Michigan Catalogue of Two-Dimensional Spectral Types for the HD Stars (Ann Arbor: University of Michigan, Department of Astronomy)
- Houk (1978) Houk, N. 1978, Catalogue of Two-Dimensional Spectral Types for the HD Stars, Vol. 2 (Ann Arbor: Univ. of Michigan, Department of Astronomy)
- Houk & Smith-Moore (1988) Houk, N. & Smith-Moore, M. 1988, Michigan Catalogue of Two-Dimensional Spectral Types for the HD stars, Vol. 4 (Ann Arbor: Univ. of Michigan, Department of Astronomy)
- Hudgins & Allamandola (1999) Hudgins, D. M. & Allamandola, L. J. 1999, ApJ, 516, L41
- Houck et al. (2004) Houck, J. R., et al. 2004, ApJS, 154, 18
- Isella et al. (2006) Isella, A., Testi, L., & Natta, A. 2006, A&A, 451, 951
- Kenyon & Hartmann (1995) Kenyon, S. J., & Hartmann, L. 2004, ApJS, 101, 117
- Kamp & Dullemond (2004) Kamp, I., & Dullemond, C. P. 2004, ApJ, 615, 991
- Kraemer et al. (2002) Kraemer, K. E., Sloan, G. C., Price, S. D., & Walker, H. J. 2002, ApJS, 140, 389
- Li & Lunine (2003) Li, A. & Lunine, J. I. 2003, ApJ, 594, 987
- Malfait et al. (1998) Malfait, K., Bogaert, E, & Waelkens, C. 1998, A&A, 331, 211
- Meeus et al. (2001) Meeus, G., Waters, L. B. F. M., Bouwman, J., van den Ancker, M. E., Waelkens, C., & Malfait, K. 2001, A&A, 365, 476
- Merin et al. (2004) Merin, B., et al. 2004, A&A, 419, 301
- Muzerolle et al. (2003) Muzerolle, J., Calvet, N., Hartmann, L., & D’Alessio, P. 2003, ApJ, 597, L149
- Nesterov et al. (1995) Nesterov, V. V., Kuzmin, A. V., Ashimbaeva, N. T., Volchkov, A. A., Roeser, S., Bastian, U. 1995, A&AS, 110, 367
- Peeters et al. (2002) Peeters, E., Hony, S., Van Kerckhoven, C., Tielens, A. G. G. M., Allamandola, L. J.; Hudgins, D. M., & Bauschlicher, C. W. 2002 A&A, 390, 1089
- Raciine (1968) Racine, R. 1968, AJ, 73, 588
- Robitaille et al. (2007) Robitaille, T. P., Whitney, B. A., Indebetouw, R., & Wood, K. 2007, ApJS, 169, 328
- Shakura & Syunyaev (1973) Shakura, N. I., & Syunyaev, R. A. 1973, A&A, 24, 337
- Siebenmorgen et al. (1998) Siebenmorgen, R., Natta, A., Kruegel, E., & Prusti, T. 1998, A&A, 339, 134
- Siebenmorgen et al. (2000) Siebenmorgen, R., Prusti, T., Natta, A., & Müller, T. G. 1998, A&A, 361, 258
- Sloan et al. (2005b) Sloan, G. C., et al. 2005, ApJ, 632, 956
- Sloan et al. (2007) Sloan, G. C., et al. 2007, ApJ, 664, 1144
- Smith et al. (2007) Smith, J. D., et al. 2007, ApJ, 656, 770
- Strom et al. (1972) Strom, S. E, Strom, K. M., Yost, J., Carrasco, L., Grasdalen, G. 1972, ApJ, 173, 353
- Strom & Strom (1994) Strom, K. M. & Strom, S. E. 1994, ApJ, 424, 237
- Thé et al. (1994) The, P. S., de Winter, D., & Perez, M. R. 1994, A&AS, 104, 315
- Thi et al. (2005) Thi, W.-F., van Dalen, B., Bik, A., & Waters, L. B. F. M. 2005, A&A, 430, L61
- Uchida et al. (2004) Uchida, K. I., et al. 2004, ApJS, 154, 439
- Vandenbussche et al. (2004) Vandenbussche, B., Dominik, C., Min, M., van Boekel, R., Waters, L. B. F. M., Meeus, G., & de Koter, A. 2004, A&A, 427, 519
- Visser et al. (2007) Visser, R., Geers, V. C., Dullemond, C. P., Augereau, J.-C., Pontoppidan, K. M., & van Dishoeck, E. F. 2007, A&A, 466, 229
- Watson et al. (2007) Watson, D. M., et al. 2007, ArXiv e-prints, 704, arXiv:0704.1518
- Weinberger et al. (1999) Weinberger, A. J., Becklin, E. E., Schneider, G., Smith, B. A., Lowrance, P. J., Silverstone, M. D., Zuckerman, B., & Terrile, R. J. 1999, ApJ, 525, L53
| TargetaaAlternate target names in parenthesis. | IRS Campaign | Date | AOR ID | IRS Module(s) | Commentsbb’SL saturated’ means the central map position had SL peaking higher than 10 Jy. In these cases a weighted average of adjacent map positions in SL is substituted. HD 100546 and HD 104237 are both too bright to observe in SL. See text for further details. |
|---|---|---|---|---|---|
| HD 32509 | 4 | 2004 Feb. 27 | 3577344 | SL, LL | |
| 51 Oph (HD 158643) | 5 | 2004 Mar. 22 | 3582464 | SL, LH | SL saturated |
| HD 152404 (AK Sco) | 20 | 2005 Apr. 14 | 12700160 | SL, LL | |
| HD 141569 | 4 | 2004 Mar. 3 | 3560960 | SL, LH | |
| HD 281789 | 4 | 2004 Feb. 27 | 3529216 | SL, LH | |
| HD 135344 (SAO 206462) | 11 | 2004 Aug. 07 | 3580672 | SL, LH | |
| SU Aur (HD 282624) | 4 | 2004 Feb. 27 | 3533824 | SL, LH | |
| HD 139614 | 11 | 2004 Aug. 07 | 3580928 | SL, LH | |
| HD 142666 | 11 | 2004 Aug. 07 | 3586816 | SL, LH | |
| HD 35187 | 4 | 2004 Feb. 27 | 3578112 | SL, LH | |
| HD 31648 (MWC 480) | 4 | 2004 Feb. 27 | 3577088 | SL, LH | SL saturated |
| HD 145718 | 4 | 2004 Feb. 27 | 3581440 | SL, LH | |
| HD 100453 | 8 | 2004 Jun. 05 | 3578880 | SL, LH | |
| HD 34282 | 13 | 2004 Sep. 26 | 3577856 | SL, LH | |
| HD 144432 | 11 | 2004 Aug. 07 | 3587072 | SL, LH | SL saturated |
| HD 97300 | 29 | 2006 Mar. 06 | 12697088 | SL, LH | |
| HD 169142 | 5 | 2004 Mar. 26 | 3587584 | SL, LH | |
| AB Aur (HD 31293) | 4 | 2004 Feb. 27 | 3533824 | SL, LH | SL saturated |
| Elias 3-1 (V 892 Tau) | 4 | 2004 Feb. 27 | 3529984 | SL, LH | SL saturated |
| HD 97048 | 29 | 2006 Mar. 06 | 12697088 | SL, LH | SL saturated |
| HD 100546 | 30 | 2006 Apr. 06 | 3579136 | SH, LH | No SL |
| HD 104237 (DX Cha) | 21 | 2005 May 05 | 12677632 | SH, LH | No SL |
| Feature (m) | (m) | (m) |
|---|---|---|
| 6.0 | 5.89–5.95 | 6.07–6.13 |
| 6.2 | 5.80–5.95 | 6.54–6.69 |
| 7.7–8.2 | 7.10–7.40 | 8.92–9.17 |
| 8.6 | 8.32–8.44 | 8.86–8.98 |
| 11.3 | 10.68–10.86 | 11.82–11.95 |
| 12.0 | 11.72–11.90 | 12.13–12.25 |
| 12.7 | 12.07–12.19 | 12.98–13.10 |
| (m) | |||||||
|---|---|---|---|---|---|---|---|
| Target | PAH Classification22PAH spectral classification according to Peeters et al. (2002). | 6.2 m PAH | 7.7–8.2 m PAH | 8.6 m PAH | 11.3 m PAH | 12.0 m PAH | 12.7 m PAH |
| HD 32509 | 6.20.1 | 8.20.3 | 8.50.2aaS/N of extracted feature 2. | 11.30.1 | 12.30.1bbS/N of extracted feature 3. | ||
| 51 Oph | C | 8.50.1 | |||||
| HD 152404 | C | 6.270.03 | 8.340.05aaS/N of extracted feature 2. | 8.670.05 | 11.270.03 | 12.70.2 | |
| HD 141569 | B/C | 6.260.01 | 7.960.01 | 8.670.03 | 11.280.02 | 12.490.07 | |
| HD 281789 | B/C | 6.250.01 | 7.920.02 | 8.650.02 | 11.250.04 | 12.640.07 | |
| HD 135344 | B/C | 6.280.02 | 8.050.04 | 8.640.07 | 11.340.01 | 12.070.07bbS/N of extracted feature 3. | 12.690.06 |
| SU Aur | C | 6.270.01 | 8.180.01 | 11.320.01 | 12.740.08 | ||
| HD 139614 | B/C | 6.2770.004 | 8.040.01 | 8.680.02 | 11.320.01 | 12.660.11 | |
| HD 142666 | B/C | 6.250.01 | 8.060.03 | 8.650.03 | 11.280.06 | 12.650.03 | |
| HD 35187 | B/C | 6.270.01 | 8.040.01 | 8.660.02 | 11.300.04 | 12.660.05 | |
| HD 31648 | C | 6.280.01 | 8.30.1 | 11.250.05 | 12.50.1 | ||
| HD 145718 | B/C | 6.2580.004 | 8.050.02 | 8.650.03 | 11.280.01 | 12.00.1aaS/N of extracted feature 2. | 12.630.06 |
| HD 100453 | B/C | 6.280.01 | 8.080.01 | 8.700.03 | 11.330.05 | 12.050.08 | 12.740.06 |
| HD 34282 | B/C | 6.2610.003 | 7.930.02 | 8.650.01 | 11.270.01 | 11.960.08aaS/N of extracted feature 2. | 12.630.02 |
| HD 144432 | C | 6.270.02 | 8.390.05 | 8.660.07 | 11.260.03 | 12.590.07 | |
| HD 97300 | A | 6.2330.004 | 7.810.04 | 8.630.02 | 11.250.01 | 11.980.03bbS/N of extracted feature 3. | 12.640.01 |
| HD 169142 | B/C | 6.2610.003 | 7.990.01 | 8.670.01 | 11.300.01 | 12.030.02 | 12.700.02 |
| AB Aur | B/C | 6.250.01 | 7.950.04 | 8.640.07 | 11.260.03 | 12.500.09 | |
| Elias 3-1 | B/C | 6.2450.002 | 7.810.04 | 8.640.03 | 11.230.06 | 12.630.09 | |
| HD 97048 | B/C | 6.2340.002 | 7.870.03 | 8.630.01 | 11.260.01 | 12.000.04 | 12.680.01 |
| HD 100546 | B/C | no SL | no SL | no SL | 11.230.01 | 11.940.03 | 12.630.05 |
| HD 104237 | B/C | no SL | no SL | no SL | 11.180.03 | 12.00.1aaS/N of extracted feature 2. | 12.40.3aaS/N of extracted feature 2. |
| (10-15 W/m2) | ||||||
|---|---|---|---|---|---|---|
| Target | 6.2 m | 7.7–8.2 m | 8.6 m | 11.3 m | 12.0 m | 12.7 m |
| HD 32509 | 0.50.1 | 0.40.1 | 0.10.1 | 0.30.1 | 0.01 | 0.090.03 |
| 51 Oph | 1 | 93 | 2 | 8 | 0.3 | 0.7 |
| HD 152404 | 1.10.1 | 43 | 0.50.1 | 2.50.1 | 0.03 | 0.20.1 |
| HD 141569 | 8.70.4 | 19.20.4 | 1.10.1 | 0.70.1 | 0.1 | 0.330.04 |
| HD 281789 | 4.30.1 | 7.80.2 | 1.10.1 | 1.80.2 | 0.1 | 0.40.1 |
| HD 135344 | 5.20.6 | 11.60.6 | 0.40.1 | 2.50.1 | 0.050.02 | 0.40.1 |
| SU Aur | 5.90.3 | 8.40.1 | 0.1 | 4.30.1 | 0.4 | 0.40.1 |
| HD 139614 | 7.00.2 | 17.10.3 | 1.40.1 | 3.90.1 | 0.1 | 0.60.1 |
| HD 142666 | 10.90.3 | 16.10.4 | 1.80.2 | 5.30.8 | 0.1 | 1.00.1 |
| HD 35187 | 8.30.3 | 20.60.2 | 1.80.1 | 3.40.4 | 0.2 | 0.60.1 |
| HD 31648 | 9.50.7 | 214 | 3 | 162 | 0.2 | 2.10.4 |
| HD 145718 | 16.10.3 | 27.20.5 | 2.50.3 | 9.10.2 | 0.10.1 | 1.00.1 |
| HD 100453 | 261 | 371 | 2.80.3 | 122 | 0.240.01 | 1.50.3 |
| HD 34282 | 12.40.2 | 391 | 2.60.1 | 3.80.1 | 0.020.01 | 0.660.03 |
| HD 144432 | 2.20.2 | 101 | 0.90.3 | 111 | 0.1 | 0.70.1 |
| HD 97300 | 13.40.2 | 402 | 4.50.3 | 7.60.2 | 0.20.1 | 2.220.04 |
| HD 169142 | 31.30.5 | 741 | 5.20.2 | 12.80.2 | 0.230.03 | 2.10.1 |
| AB Aur | 662 | 1255 | 123 | 232 | 0.3 | 51 |
| Elias 3-1 | 581 | 1129 | 243 | 254 | 2 | 51 |
| HD 97048 | 581 | 1968 | 191 | 451 | 0.60.1 | 11.50.2 |
| HD 100546 | no SL | no SL | no SL | 1326 | 52 | 122 |
| HD 104237 | no SL | no SL | no SL | 161 | 0.70.5 | 1.80.9 |
| Star Name | d (pc) | SED GroupaaSED Group classifications after Meeus et al. (2001) and quoted from Acke & van den Ancker (2004). | bbVisual extinction values quoted from Acke & van den Ancker (2004), except for 51 Oph (Malfait et al., 1998). | (deg) | Sp. Type Ref. | |||
|---|---|---|---|---|---|---|---|---|
| HD 32509 | 8970 | A2e | 7.51 | 151 | IIb11SED Group for SU Aur, HD 281789, HD 32509, HD 97300 determined using the criterion of Meeus et al. (2001). | 51 | Malfait et al. (1998) | |
| 51 Oph | 9520 | A0Ve | 4.78 | 131 | IIa | 0.11 | 35 | Malfait et al. (1998) |
| HD 152404 | 6440 | F5 Ve | 9.14 | 145 | IIa | 0.62 | Malfait et al. (1998) | |
| HD 141569 | 9520 | A0 Ve | 7.09 | 99 | IIb | 0.37 | 51 | Dunkin et al. (1997) |
| HD 281789 | 9520 | A0 | 10.01 | 350 | IIa11SED Group for SU Aur, HD 281789, HD 32509, HD 97300 determined using the criterion of Meeus et al. (2001). | Nesterov et al. (1995) | ||
| HD 135344 | 6590 | F4 Ve | 8.61 | 140 | Ib | 0.31 | 45 | Dunkin et al. (1997) |
| SU Aur | 5945 | G1 | 9.42 | 152 | IIa11SED Group for SU Aur, HD 281789, HD 32509, HD 97300 determined using the criterion of Meeus et al. (2001). | Calvet et al. (2004) | ||
| HD 139614 | 7850 | A7 Ve | 8.26 | 140 | Ia | 0.09 | 20 | Houk (1978) |
| HD 142666 | 7580 | A8 Ve | 8.81 | 145 | IIa | 0.93 | 55 | Houk & Smith-Moore (1988) |
| HD 35187 | 8970 | A2 Ve | 7.78 | 150 | IIa | 0.71 | Dunkin et al. (1998) | |
| HD 31648 | 8970 | A2 pshe | 7.72 | 131 | IIa | 0.25 | 38 | Malfait et al. (1998) |
| HD 145718 | 7580 | A8 III/IVe | 8.98 | 131 | IIa11SED Group for SU Aur, HD 281789, HD 32509, HD 97300 determined using the criterion of Meeus et al. (2001). | Houk & Smith-Moore (1988) | ||
| HD 100453 | 7390 | A9 Ve | 7.79 | 112 | Ib | 0.02 | Houk & Crowley (1975) | |
| HD 34282 | 9333 | A0.5 Vbe | 10.11 | 160 | Ib | 0.28 | 56 | Gray & Corbally (1998) |
| HD 144432 | 7390 | A9 Ve | 8.15 | 253 | IIa | 0.17 | 45 | Malfait et al. (1998) |
| HD 97300 | 10500 | B9 V | 9.00 | 188 | IIb11SED Group for SU Aur, HD 281789, HD 32509, HD 97300 determined using the criterion of Meeus et al. (2001). | Houk & Crowley (1975) | ||
| HD 169142 | 8200 | A5 Ve | 8.11 | 145 | Ib | 0.43 | 8 | Malfait et al. (1998) |
| AB Aur | 9520 | A0 pe | 7.05 | 144 | Ia | 0.50 | 65 | Raciine (1968) |
| Elias 3-1 | 10500 | B9 | 15.3 | 160 | Ia | 4.05 | 45 | Strom & Strom (1994) |
| HD 97048 | 9520 | A0 pshe | 8.46 | 175 | Ib | 1.26 | Houk & Crowley (1975) | |
| HD 100546 | 10500 | B9 Vne | 6.70 | 103 | Ia | 0.26 | Malfait et al. (1998) | |
| HD 104237 | 7580 | A8 pe | 6.81 | 116 | IIa | 0.29 | 18 | Malfait et al. (1998) |
Note. — V892 Tau: distance assumed to be 160 pc (Taurus)
Tefrom Kenyon and Hartman (1995) Table A5 for all luminosity class V, other luminosity class data from C. W. Allen (2000, Astrophysical Quantities, ed. A. N. Cox, Springer)


![[Uncaptioned image]](/html/0809.2389/assets/x3.png)
Fig. 2. — Continued.
![[Uncaptioned image]](/html/0809.2389/assets/x4.png)
Fig. 2. — Continued.
![[Uncaptioned image]](/html/0809.2389/assets/x8.png)
Fig. 5. — Continued.
![[Uncaptioned image]](/html/0809.2389/assets/x14.png)
Fig. 10. — Continued.

![[Uncaptioned image]](/html/0809.2389/assets/x16.png)
Fig. 11. — Continued.
![[Uncaptioned image]](/html/0809.2389/assets/x17.png)
Fig. 11. — Continued.
![[Uncaptioned image]](/html/0809.2389/assets/x18.png)
Fig. 11. — Continued.
