First detection of hard X-ray photons in the soft X-ray transient Narrow-Line Seyfert 1 galaxy WPVS 007: The X-ray photon distribution observed by Swift
Abstract
We report on the first detection of hard X-ray photons (2.5 keV) in the X-ray transient Narrow-Line Seyfert 1 galaxy WPVS 007 which was the AGN with the softest X-ray spectrum during the ROSAT All-Sky Survey. The AGN is clearly detected at a level of about 2 W m-2 in the observed 0.3-10.0 keV band by Swift in a 50 ks observation in 2007 September. For the first time since the ROSAT All-Sky Survey observation in 1990 it was possible to derive an X-ray photon distribution by adding together all Swift observations that have been performed so far (85.5 ks in total). This photon distribution is consistent with an X-ray spectrum of an AGN with a partial covering absorber with a column density in the order of cm-2 and a covering fraction of about 90%. A comparison with the 2002 Chandra data suggests that WPVS 007 has become brighter by a factor of about 4. The Swift data also suggest that the absorber which is causing the current low-state may have started to disappear. This disappearance is indicated by a significant change in the hardness ratio from a very soft X-ray state during the 2005 October to 2007 January observations to a rather hard X-ray state in the 2007 September observations. In the UV, WPVS 007 seems to become fainter by up to 0.5 mag over the last two years. The optical to X-ray spectral slope derived from the spectral energy distribution is =2.5 which classifies WPVS 007 as an X-ray weak AGN. After correcting for reddening and X-ray absorption, becomes 1.9 and the luminosity in the Big-Blue-Bump is log =37.7 [W], which translates into an Eddington ratio .
Subject headings:
galaxies: active, galaxies: individual (WPVS 007)1. Introduction
The Narrow-Line Seyfert 1 galaxy (NLS1) WPVS 007 (1RXS J003916.6, RBS 0088; = , = , z=0.029; Wamsteker et al., 1985; Grupe et al., 1995b) is a unique X-ray transient AGN. During the ROSAT All-Sky Survey (RASS, Voges et al., 1999), when WPVS 007 was in its X-ray high-state, the X-ray-to-optical flux ratio was log 111 is defined by Beuermann et al. (1999) as log()= log CR + 0.4 V - 5.86, with CR = the ROSAT PSPC count rate in the 0.1-2.0 keV range.=0.22 which is typical for a Seyfert 1 galaxy (e.g. Beuermann et al., 1999; Maccacaro et al., 1988). Nevertheless, in all X-ray follow-up observations between 1993 and 2007 using ROSAT, Chandra and Swift WPVS 007 has been found in an extreme X-ray low-state that made WPVS 007 almost vanish from the X-ray sky (Grupe et al., 2001, 2007a). It had been last detected in 2002 August by Chandra with ACIS-S counts s-1 (Vaughan et al., 2004). While this strange transient behavior had been a mystery for a decade, Leighly et al. (2005) and Leighly et al. (2008) discovered that it is probably absorption that causes the extreme low-state in this AGN. They found in a 2003 November FUSE observation that the UV spectrum of WPVS 007 had changed dramatically compared with HST observations obtained in 1996 July (Goodrich, 2000; Constantin & Shields, 2003): the FUSE observation revealed the emergence of a BAL flow. Leighly et al. (2008) concluded that WPVS 007 is a low-luminosity, low black hole mass cousin of Broad Absorption Line Quasars (BALQSOs). The relatively short timescale for the development of the BAL inferred in WPVS 007 suggests that it could re-brighten at any time on relatively short timescales. We started a monitoring campaign using Swift in 2005 October (Grupe et al., 2007a). The purpose of this campaign is to detect a possible rebrightening and therefore the disappearance of the absorber. By the end of the second year of monitoring WPVS 007 with Swift in 2007 January, only a 3 upper limit of the observed X-ray flux could be derived at a level of W m-2 in the rest-frame 0.2-2.0 keV band.
Brandt et al. (2000) found that about 10% of optically selected quasars appear to be X-ray weak with an optical to X-ray spectral slope 222The X-ray loudness is defined by Tananbaum et al. (1979) as =–0.384 log().2.0. X-ray weakness can either be intrinsic, such as seen in e.g. PHL 1811 (Leighly et al., 2007), or caused by intrinsic absorption. Low X-ray flux states have been found in several NLS1s, such as Mrk 1239, 1H 0707–495, and most recently in Mrk 335 (Grupe et al., 2004b; Boller et al.,, 2002; Gallo et al., 2004; Grupe et al., 2007b). In Mrk 335 Grupe et al. (2007b) showed that this dramatic drop in the X-ray flux goes along with a strong change in the X-ray spectrum. One of the possible scenarios to explain the X-ray spectra of low-state NLS1s is a partial covering absorber. An alternative solution to the strange looking low-state spectra of these NLS1s is reflection as suggested for example by Fabian et al. (1989, 2004). The X-ray spectra by themselves do not provide a definite solution to distinguish between both models because with the quality of the spectra typically obtained and the number of free model parameters, both models fit the X-ray spectra well and they are statistically indistinguishable. In addition, the cases of several well-studied AGN have shown that low X-ray flux states are temporary events and not necessarily persistent (e.g. Komossa & Fink, 1997; Guainazzi et al., 1998; Costantini et al., 2000; Komossa et al., 2001; Bianchi et al., 2005; Grupe et al., 2007b, 2008; Ballo et al., 2008).
The Swift Gamma-Ray Burst explorer mission (Gehrels et al., 2004) was launched on 2004 November 20. With its simultaneous multi-wavelength capacity and its scheduling flexibility, Swift has shown itself to be the ideal observatory to study highly variable objects like AGN. Even though Swift’s main purpose is to detect and observe Gamma-Ray bursts, Swift has also done an excellent job in observing AGN as fill-in targets or Target-of-Opportunity (ToO) observations (e.g. Markwardt et al., 2005; Grupe et al., 2006, 2007a, 2007b; Kataoka et al., 2008; Sambruna et al., 2007; Giommi et al., 2007). Swift’s UV/Optical Telescope (UVOT, Roming et al., 2005) and X-ray Telescope (XRT, Burrows et al., 2005) cover the electromagnetic spectrum between 6500Å on the low energy side to 10 keV at the high energy end simultaneously.
We started the WPVS 007 monitoring campaign again in 2007 July. On 2007 August 10 a failure of one of the Swift gyros forced the spacecraft into a safe-hold (Gehrels, 2007). During the spacecraft recovery process, Swift was slewing only around a small circle in the sky that included the position of WPVS 007. We took advantage of this limited slewing capacity and obtained about 50ks of X-ray observations of the field of WPVS 007 in 2007 September. During these observations we were not only able to clearly detect WPVS 007 in X-rays, but even more importantly, we discovered a significant number of photons at hard energies above 2 keV, and derived a photon distribution that gives us information for the first time since the RASS about the X-ray spectrum. In this paper we present and discuss these new observations.
The outline of this paper is as follows: in § 2 we describe the Swift observations and the data reduction, in § 3 we present the results of the Swift XRT data, and in § 4 we discuss the results. Throughout the paper spectral indexes are denoted as energy spectral indexes with . Luminosities are calculated assuming a CDM cosmology with =0.27, =0.73 and a Hubble constant of =75 km s-1 Mpc-1 using a luminosity distances D=118 Mpc given by Hogg (1999). All errors are 1 unless stated otherwise.
2. Observations and data reduction
Table 1 presents the new Swift XRT observations of WPVS 007 starting on 2007 July 15, including the start and end times and the total exposure times. A list of the previous Swift observations between 2005 October and 2007 January is given in Grupe et al. (2007a). Due to the spacecraft recovery UVOT data were only taken before the safe-hold on 2007 August 10, and after the turn on of the UVOT by the end of 2007 October. The XRT was operating in photon counting mode (Hill et al., 2004) and the data were reduced by the task xrtpipeline version 0.10.4., which is included in the HEASOFT package 6.1. For creating an image of the 2007 September observations we used XSELECT version 2.4. We ran the source detection algorithm detect in XIMAGE version 4.4 with a signal-to-noise level set to 3.
In order to obtain a source photon distribution from the WPVS 007 data, we co-added the data from all of the Swift observations (85.5 ks in total) of WPVS 007 (except for segment005 for which the background was too high; Grupe et al., 2007a). From these co-added data source photons were extracted using XSELECT from a circle with r= and background photons from a source-free region close by with a radius r=. Thirty six net source photons were obtained, too few to fit using the usual statistics. Because the source photons account for only 70% of the total, even Cash statistics cannot be applied in XSPEC (Arnaud, 1996) to fit the photon distribution. Therefore, the spectrum has to be reconstructed by hardness ratio analysis. The hardness ration is defined as HR=(H-S)/(H+S) with S and H are the number of source photons in the 0.3-2.0 and 2.0-10.0 keV energy bands, respectively. The hardness ratios were calculated using the program BEHR as described in Park et al. (2006) which uses Bayesian statistics which is required for the small number of photons in WPVS 007. The absorption column density of the z=0 absorber was set to the Galactic value ( cm-2 Dickey & Lockman, 1990).
The UVOT data were reduced and analyzed as described in Grupe et al. (2007a). Due to UVOT calibration and software changes in June 2007 (Poole et al., 2007) we reanalyzed the UVOT data previously obtained by Swift with a source extraction radius of . Primarily the values in the UV filters changed in the order of about 0.3 mag. For consistency we list the results and exposure times in Table 2 of all Swift UVOT observation, including those prior to June 2007, previously published in Grupe et al. (2007a).
3. Results
3.1. X-ray detection and analysis
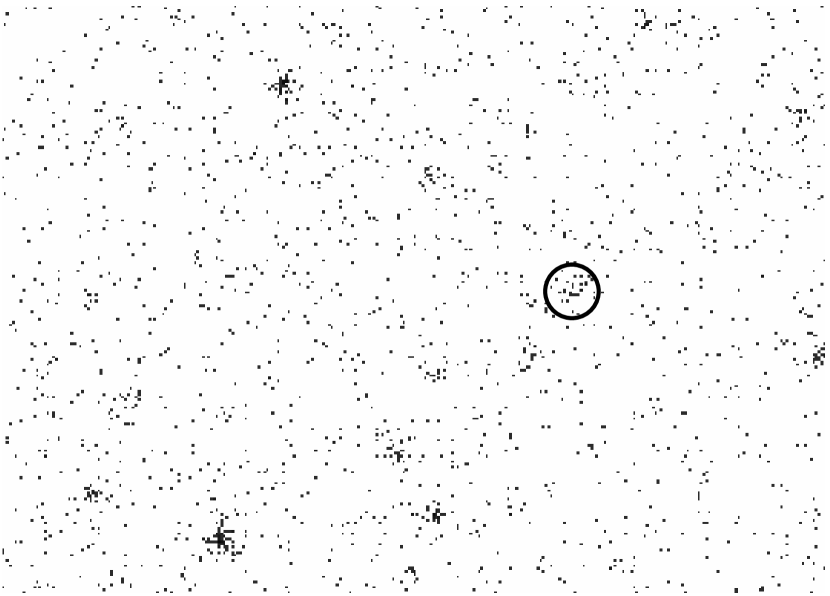
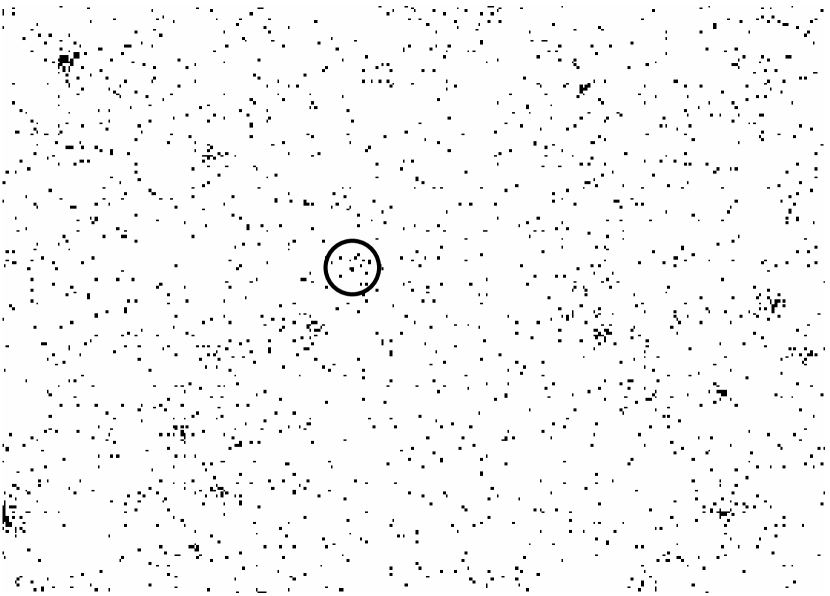
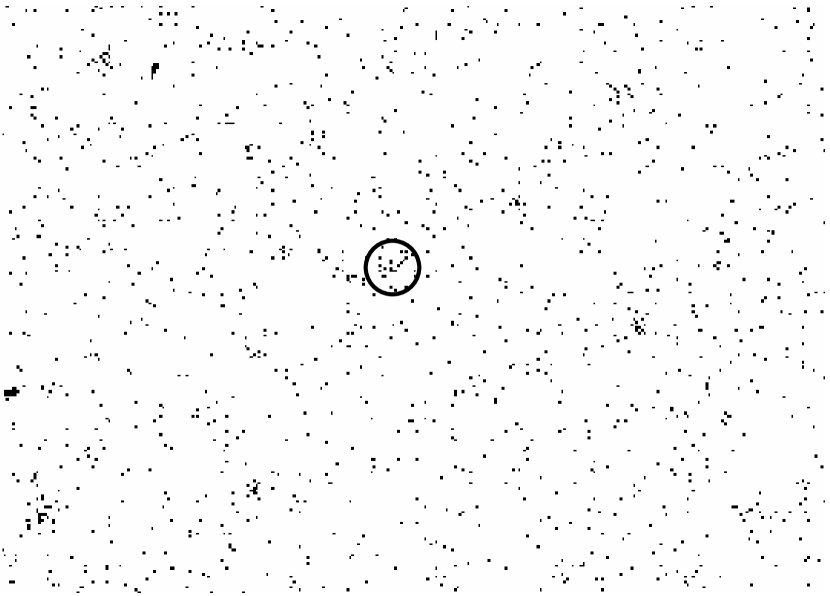
Figure 1 displays the image of the field of WPVS 007 during the 50ks observations of 2007 September. The circle marks the position of WPVS 007. Using the detect algorithm in XIMAGE, the AGN is clearly detected at a level of (5.11.2) XRT counts s-1. Adding all XRT data together that have been obtained since 2005 October (85.5 ks in total) results in a 5 detection with (4.50.9) counts s-1. Figure 2 displays the field of WPVS 007 in the soft 0.3-2.0 keV and hard 2.0-10.0 keV bands on the left and right panels, respectively. While there is only a marginal detection at the 2 level in the soft X-ray band, the AGN is clearly detected at the 4.5 level in the hard X-ray band. Note, that in the 2005 October to 2007 January data there is an enhanced number of counts at the position of WPVS 007 (Table 3). However, there is no obvious clustering of photons at that position. Therefore we only report a 3 upper limit for this time period.
The biggest surprise of the Swift observations is the detection of WPVS 007 at hard X-ray energies. From the whole 85.5 ks data set we detected 24 source photons with energies 2.5 keV out of a total of 36 source photons. This is surprising because during the RASS WPVS 007 was the AGN with the steepest X-ray spectrum (=8.7) and with no X-ray photon with energies above 0.5 keV (Grupe et al., 1995b). During the 10ks Chandra observation on 2002 August 02 out of 10 photons only one was detected above 2 keV, at 2.3 keV.
Table 3 lists the number counts, count rates, and hardness ratios for the 2005 October to 2007 January, 2007 September, and 2005 October to 2008 January observations. The Hardness ratios between the 2005 October to 2007 January observations with the 2007 September indicated a dramatic change in the X-ray spectrum. While the hardness ratio in the 2005 October to 2007 January observations is soft with HR= which is consistent with the hardness ratio during the 2002 Chandra observation (HR=), WPVS 007 had become significantly harder with HR=+0.630.20 in the 2007 September observations. Although comparing hardness ratios of different detectors is difficult, X-ray CCDs are similar enough to tell if the majority of photons is in the hard or the soft bands.
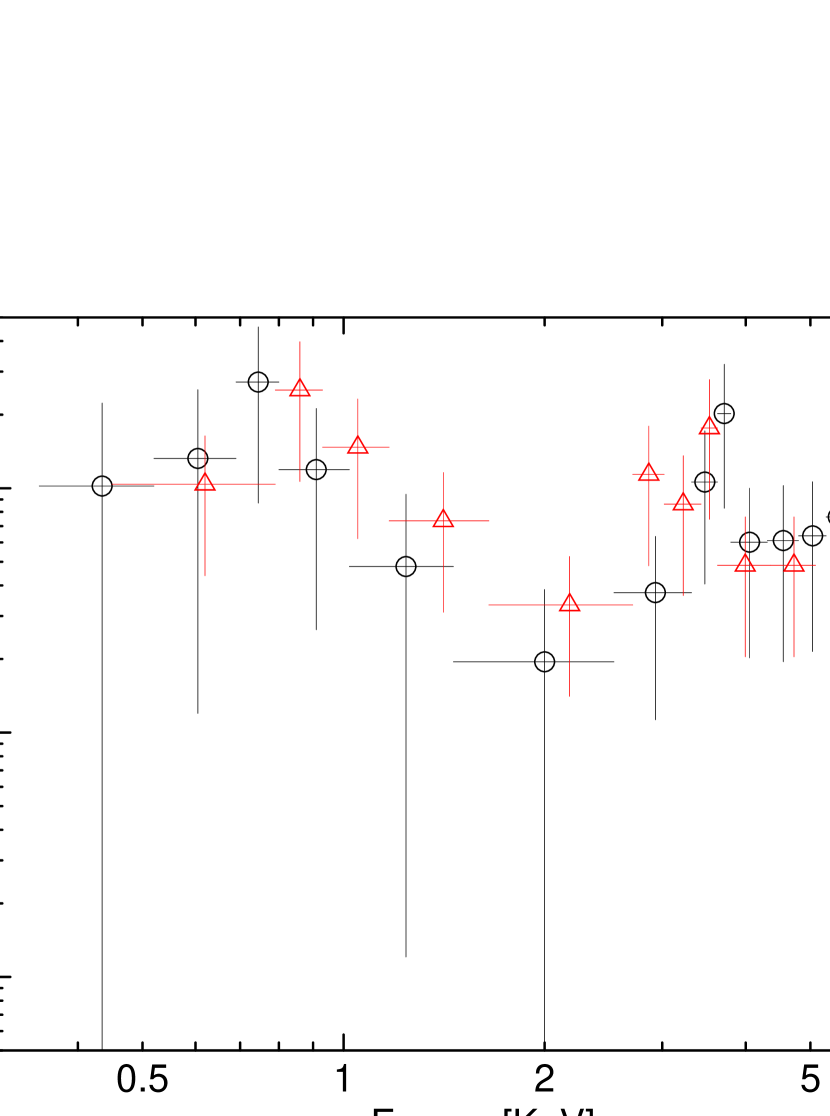
As listed in Table 3, the total number of source photons in the combined 85 ks Swift exposure333Note, as mentioned in Grupe et al. (2007a) the segment 005 data were excluded from the analysis due to a high detector background during the observation. is only about 36. Although the number of source photons is small, this photon distribution can be used to examine what spectral model best represents the current low-state X-ray spectrum of WPVS 007. Figure 3 shows the observed and simulated photon distribution (black circles and red triangles, respectively). For presentation purposes only the spectrum was rebinned with 3 photons per bin. Because only 68% of the total number of photons in the non-background subtracted spectrum are source photons, no spectral fitting of the data is possible. In order to determine what spectral model can represent the observed photon distribution we measured the number of source photons in different energy bands and simulated several models in XSPEC to reproduce these numbers. In the observed spectrum we found that 12 source photons were at energies E 2.0 keV, 24 source photons at E2.0 keV (Table 3), 16 photons between 2 and 5 keV and 8 photons between 5 and 10 keV. The spectrum that can reproduce these numbers the best is an absorbed two power law model . The absorption column density at z=0 was set to the Galactic value. The column densities of the redshifted absorbers are and cm-2 for the first and second power law component, respectively and X-ray spectral slopes =8.7 and =3.0 for these components. The first power law spectral slope is that found during the RASS (Grupe et al., 1995b). Even though this model can reproduce the observed photon distribution, a more physical model is a partial covering absorber with a single power law. We found that a partial covering absorber with a column density cm-2 and a high covering fraction of =0.95 and an X-ray spectral slope =1.5 can also represent the observed photon distribution quite well. Figure 3 shows a simulated 85 ks spectrum (red triangles) using the partial covering absorber model as described above.
3.2. UVOT data
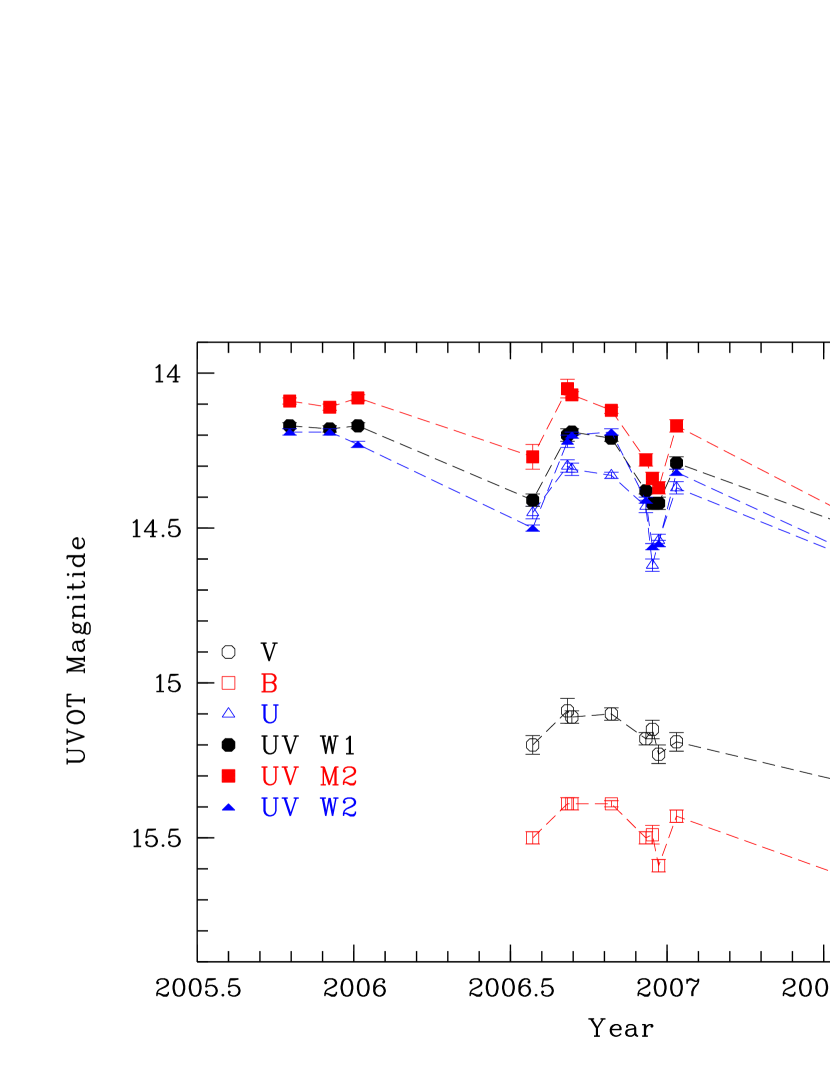
Figure 4 displays the UVOT light curves in all 6 filters. Note that during some of the observations only the UV filters have been used. These light curves are similar to those shown in Grupe et al. (2007a), but all UVOT data have been re-analyzed due to the most recent software and calibration changes (Poole et al., 2007). WPVS 007 continues to be variable by about 0.3 mag in the UV on timescales of months. The UV light curves also suggest that over the period of about two years the AGN has become fainter by up to 0.5 mag (see also Table 2) in the UV filters.
Because we can finally see hard X-ray photons in WPVS 007, it is possible to construct the spectral energy distribution (SED) and derive the optical to X-ray spectral slope . The photon distribution of WPVS 007 presented here is dominated by the 2007 September observations when it appeared to be brighter compared to the previous observations. Taking this into account we measure an optical to X-ray spectral slope =2.5. This is the of the absorbed/reddened spectrum. Note that Leighly et al. (2008) found an unusual reddening curve of WPVS 007 based on the HST data in comparison with HST spectra of Mrk 493 and Mrk 335. In order to estimate the unabsorbed , we assumed an optical/UV spectrum of an (almost) unabsorbed NLS1. Here we picked the Swift observation of MS 0117-28 (Grupe et al. 2008 in prep). For the X-ray spectrum we used the unabsorbed power law spectrum found from the partial covering absorber model fit with =1.5. Based on these assumptions we found that the unabsorbed optical to X-ray spectral slope is in the order of =1.9. The UV spectrum of MS 0117-28 can also be used to estimate the approximate intrinsic reddening in WPVS 007. We measured a reddening of about 1 magnitude in the UVW2 filter which translates to an intrinsic reddening of =0.1 mag. This SED results in a Big-Blue-Bump luminosity of log =37.7 [W] which is exactly the Eddington luminosity of a black hole444The black hole mass was determined using the relation given in (Kaspi et al., 2000)., or in other words, the Eddington ratio is , which is a typical value for NLS1s (e.g. Grupe, 2004).
4. Discussion
We presented new Swift observations on the X-ray transient NLS1 WPVS 007. We were able to detect the AGN in X-rays at a level of 5 XRT counts s-1 in the 0.3-10.0 keV band which is equivalent to an X-ray flux of 2 W m-2. The most interesting aspect of this detection is that the majority of source photons are detected at energies 2 keV which is extremely surprising considering that WPVS 007 used to be the AGN with the softest X-ray spectrum in the sky, having no photon above 0.5 keV detected during the RASS.
Compared with the ACIS-S count rate measured during the 2002 Chandra observation ( ACIS-S counts s-1; Vaughan et al., 2004) this indicates that WPVS 007 has become brighter by a factor of a few. This variability, however, only occurs in the hard band. The 0.2-2.0 keV flux between the Chandra 2002 and Swift 2007 observations remains constant within the errors. The non-variability of the optical spectra seen by Winkler et al. (1992) and Grupe et al. (1995b) suggests that the intrinsic continuum spectrum may not have changed. This non variability in the optical spectrum is somewhat similar to Mrk 335 where the optical spectra taken in 1999 during the X-ray high state and 2007 September during the low-state are identical (Grupe et al., 2008). The non variability of the optical spectrum together with the strong variability seen in X-rays and the UV may suggest that the inclination angle in which we observe the nuclear region is rather high assuming that the variability is a consequence of variable absorption. This is expected for BAL QSOs according to the AGN geometry model presented by Elvis (2000). However, this is not exclusive. Recently there have been reports by e.g. Berrington et al. (2007) and Ghosh & Punsly (2008) of BAL QSOs with polar outflows.
Although the best-fit model is the partial covering absorber model, in principle a reflection model (e.g. Fabian et al., 1989, 2004) results in a similar shape of the X-ray spectrum. While it is impossible with the current data set to distinguish betwen the partial covering absorber and refelction models, the presence of a strong absorber in the UV spectrum (Leighly et al., 2008) makes the partial covering absorber model more plausible as the explanation for the observed Swift X-ray spectrum.
One question is if the X-ray spectrum has changed intrinsically, or whether the absorber has become more transparent sometime between 2002 and 2007. The strong UV absorption in the FUSE observations also suggests that WPVS 007 was highly absorbed in 2003 November. There was only one photon found above 2 keV in the Chandra 2002 observation, but 24 in the combined Swift data. In order to answer the question we simulated a 10 ks ACIS-S spectrum using the spectral parameters of a partial covering absorber fit derived from the Swift data. Using these parameters we expect to see 13 photons with energies above 2 keV in the Chandra data. However, only one single photon with 2keV was found. This is a statistically significant lower value than the expected number of photons. We performed another simulation assuming a column density of the partial covering absorber of cm-2 and leaving all other spectral parameters at the same values. This simulation showed that the hard X-ray photons could be suppressed significantly down to one photon above 2 keV in a 10 ks Chandra ACIS-S observations. Even though we are dealing with low number photon statistics, the hardness ratios found from the Swift data prior 2007 January observations the Chandra 2002 data both indicate a rather soft X-ray spectrum, while the 2007 September data suggest a rather hard spectrum. Because the flux during the 2007 September Swift observation is a factor of about 4 higher than during the 2002 Chandraobservation, it suggests that the column density of the absorber of the high energy spectrum had decreased significantly sometime in the time between 2007 January and September. This result suggests that the absorber has started to disappear again. Note, that a change in the absorber column density of a fully-covered absorber has exactly the opposite effect on the hardness ratio than what a partial covered absorber does: while in increase of the absorption column density of a fully-covered absorber causes the hardness ratio to become harder, because primarily soft X-ray photons are absorbed, an increase of the absorption column density of a partial covering absorber causes the source to appear softer, because the soft X-ray photons are dominated by the unabsorbed fraction of the X-ray continuum while the hard X-ray photons become suppressed. Considering that we observed the flux to decrease significantly between the RASS observation in 1990 and the pointed ROSAT observation in 1993, we may suggest that we will be able to see WPVS 007 as a bright X-ray NLS1 again within the next few years.
The optical to X-ray spectral slope =2.5 clearly classifies WPVS 007 as an X-ray weak AGN following the definition by Brandt et al. (2000) who define ’X-ray weak’ AGN by 2.0. The reddening-corrected =1.9 is at the borderline. Note that this value has large uncertainties. Nevertheless, this result is consistent with the findings by Leighly & Moore (2004) that NLS1s with outflows seen in the blueshifted emission lines have steeper than NLS1s without outflows.
One question remains: why was the X-ray spectral slope during the RASS observation so steep? An energy index of =8.7 as measured from a single absorbed power law model to the RASS spectrum (Grupe et al., 1995b) can not be explained by standard accretion disk models. We can also exclude a tidal disruption event by a star orbiting closely to the central black hole. First, the optical to X-ray flux ratio during the RASS was log =0.22555The typical optical to X-ray spectral slope cannot be applied to these data because no X-ray photons with 0.5 keV were detected in the RASS data making any estimate of very uncertain. which is typical for a Seyfert 1 galaxy (Beuermann et al., 1999; Maccacaro et al., 1988), and second we do not detect any significant changes in the optical spectrum. This is different than what has been found in the X-ray transient Seyfert 2 galaxy IC 3599 (Grupe et al., 1995a; Brandt et al., 1995) or as recently reported for SDSS J095209.56+214313.3 by Komossa et al. (2008) where strong changes in the optical emission lines were found as a result of an X-ray outburst caused by a dramatic accretion event. Note also that the X-ray to optical flux ratio of IC 3599 during the RASS was log =1.45. One possible explanation for the absence of any photon above 0.5 keV during the RASS observation is the presence of an ionized, ’warm’, absorber in the line of sight. This type of absorber is transparent at soft energies but absorbs at intermediate energies, and therefore provides an efficient mechanism to produce very steep soft X-ray spectra (e.g., Komossa & Meerschweinchen 2000, Done & Nayakshin 2007). Using absori within XSPEC we simulated a 300s spectrum of WPVS 007 during the RASS with an absorber column density cm-2 of the warm absorber with an ionization parameter =1000. Fitting this simulated spectrum with an absorbed single power law model results in =6.2, which is similar to what has been found during the RASS (Grupe et al., 1995b).
Our detection of WPVS 007 with Swift and the extraction of a photon distribution from the 2005 to 2007 data opens a new window in our understanding of WPVS 007 and X-ray weak AGN in general. While in the UV we were able to follow the increase of the absorber column density (Leighly et al., 2005, 2008) we are now able to follow the disappearance of the absorber in X-rays. This will need future follow-up observations by XMM-Newton or Chandra and Swift. While XMM-Newton or Chandra will be able to obtain a detailed low-state spectrum, Swift will continue monitoring WPVS 007 in order to determine when it will become X-ray bright again. In addition, optical polarimetry or spectropolarimetry is needed to measure how much of the optical emission is seen directly and how much is scattered (polarized) emission. Spectropolarimetry will put strong constraints on the geometry of the AGN and will confirm (or not) the assumption that WPVS 007 is viewed at a rather high inclination angle. We also have an approved HST COS observation along with a Chandra observation in order to study the developments in the UV absorption lines and in the X-ray continuum.
References
- Arnaud (1996) Arnaud, K. A., 1996, ASP Conf. Ser. 101: Astronomical Data Analysis Software and Systems V, 101, 17
- Ballo et al. (2008) Ballo, L.; Giustini, M.; Schartel, N.; Cappi, M.; Jiménez-Bailón, E.; Piconcelli, E.; Santos-Lleó, M.; Vignali, C., 2008, A&A, 483, 137
- Berrington et al. (2007) Berrington, R.C., et al., 2007, AAS, 211, 64.05
- Beuermann et al. (1999) Beuermann, K., Thomas, H.-C., Reinsch, K., et al., 1999, A&A, 347, 47
- Bianchi et al. (2005) Bianchi, S.; Guainazzi, M.; Matt, G.; Chiaberge, M.; Iwasawa, K.; Fiore, F.; Maiolino, R., 2005, A&A, 442, 185
- Boller et al., (2002) Boller, T., et al., 2002, MNRAS, 329, L1
- Boroson & Green (1992) Boroson, T.A., & Green, R.F., 1992, ApJS, 80, 109
- Brandt et al. (1995) Brandt, W.N., Pounds, K.A., & Fink, H.H., 19095, MNRAS, 273, L47
- Brandt et al. (2000) Brandt, W.N., Laor, A., & Wills, B.J., 2000, ApJ, 528, 637
- Burrows et al. (2005) Burrows, D., et al., 2005, Space Science Reviews, 120, 165
- Constantin & Shields (2003) Constantin, A., & Shields, J.C., 2003, PASP, 115, 592
- Costantini et al. (2000) Costantini, E., et al., 2000, ApJ, 544, 283
- Dickey & Lockman (1990) Dickey, J.M., & Lockman, F.J., 1990, ARA&A, 28, 215
- Done & Nayakshin (2007) Done, C., Nayakshin, S. 2007, MNRAS, 377, L59
- Elvis (2000) Elvis, M., 2000, ApJ, 545, 63
- Fabian et al. (1989) Fabian, A.C., Rees, M.J., Stella, L., & White, N.E., 1989, MNRAS, 238, 729
- Fabian et al. (2004) Fabian, A.C., Miniutti, G., Gallo, L.C., Boller, T., Tanaka, Y., Vaughan, S., & Ross, R.R., 2004. MNRAS, 353, 1071
- Gallo et al. (2004) Gallo, L.C., Tanaka, Y., Boller, T., Fabian, A.C., Vaughan, S., & Brandt, W.N., 2004, MNRAS, 353, 1064
- Gehrels et al. (2004) Gehrels, N., et al., 2004, ApJ, 611, 1005
- Gehrels (2007) Gehrels, N., 2007, GCN circ # 6760
- Ghosh & Punsly (2008) Ghosh, K.K., & Punsly, B., 2008, ApJ, 674, L69
- Giommi et al. (2007) Giommi, P., et al., 2007, aap, 468, 571
- Goodrich (2000) Goodrich, R.W., 2000, New Astronomy reviews, Vol 44, 519
- Grupe (2004) Grupe, D., 2004, AJ, 127, 1799
- Grupe et al. (1995b) Grupe, D., Beuermann, K., Mannheim, K., Thomas, H.-C., de Martino, D., & Fink, H.H., 1995b, A&A, 300, L21
- Grupe et al. (1995a) Grupe, D., et al., 1995a, A&A, 299, L5
- Grupe et al. (1998) Grupe, D., Wills, B.J., Wills, D., Beuermann, K., 1998, A&A, 333, 827
- Grupe et al. (2001) Grupe, D., Thomas, H.-C., & Beuermann, K., 2001, A&A, 367, 470
- Grupe et al. (2004b) Grupe, D., Mathur, S., & Komossa, S., 2004b, AJ, 127, 3161
- Grupe et al. (2006) Grupe, D., Leighly, K.M., Komossa, S., Schady, P., O’Brien, P.T., Burrows, D.N., & Nousek, J.A., 2006, AJ, 132, 1189
- Grupe et al. (2007a) Grupe, D., Schady, P., Leighly, K.M., Komossa, S., O’Brien, P.T., & Nousek, J.A., 2007a, AJ, 133, 1988
- Grupe et al. (2007b) Grupe, D., Komossa, S., & Gallo, L.C., 2007b, ApJ, 668, L111
- Grupe et al. (2008) Grupe, D., Komossa, S., Gallo, L.C., Fabian, A.C., Larsson, J., Pradhan, A.K., Xu, D., & Miniutti, G., 2008, ApJ, 681, 982
- Guainazzi et al. (1998) Guainazzi, M.m et al., 1998, MNRAS, 301, L1
- Hill et al. (2004) Hill, J.E., et al., 2004, SPIE, 5165, 217
- Hogg (1999) Hogg, D., 1999, astro-ph/9905116
- Kaspi et al. (2000) Kaspi, S., Smith, P.S., Netzer, H., Maoz, D., Jannuzi, B.T., & Giveon, U., 2000, ApJ, 533, 631
- Kataoka et al. (2008) Kataoka, J., et al., 2008, ApJ, 672, 787
- Komossa & Fink (1997) Komossa, S., & Fink, H.H., 1997, A&A, 327, 555
- Komossa et al. (2000) Komossa, S., Meerschweinchen, J. 2000, A&A, 354, 411
- Komossa et al. (2001) Komossa, S., Burwitz, V., Predehl, P., & Kaastra, J., ASPC, 249, 411
- Komossa et al. (2008) Komossa, S., et al., 2008, ApJ, 678, L13
- Kraft et al. (1991) Kraft, R.P., Burrows, D.N., & Nousek, J.A., 1991, ApJ, 374, 344
- Leighly & Moore (2004) Leighly, K.M., & Moore, J.R., 2004, ApJ, 611, 107
- Leighly et al. (2005) Leighly, K.M., Casebeer, D.A., Hamann, F., & Grupe, D., 2005, AAS, 207, 1804
- Leighly et al. (2007) Leighly, K.M., Halpern, J.P., Jenkins, E.B., Grupe, D., Choi, J., & Prescott, K.B., 2007, ApJ, 663, 103
- Leighly et al. (2008) Leighly, K.M., Hamann, F., Casebeer, D.A., & Grupe, D., 2008, ApJ, submitted
- Maccacaro et al. (1988) Maccacaro, T., Gioia, I.M., Wolter, A., Zamorani, G., & Stocke, J.T., 1988, ApJ, 326, 680
- Markwardt et al. (2005) Markwardt, C.B., Tueller, J., Skinner, G.K., Gehrels, N., Barthelmy, S.D., & Mushotzky, R.F., 2005, ApJ, 633, L77
- Park et al. (2006) Park, T., Kashyap, V.L., Siemiginowska, A., van Dyk, D.A., Zezas, A., Heinke, C., & Wargelin, B.J., 2006, ApJ, 652, 610
- Poole et al. (2007) Poole, T.S., et al., 2007, MNRAS, submitted, arXiv:0708.2259
- Roming et al. (2005) Roming, P.W.A., et al., 2005, Space Science Reviews, 120, 95
- Sambruna et al. (2007) Sambruna, R., et al., 2007, ApJ, 669, 884
- Schlegel et al. (1998) Schlegel, D. J., Finkbeiner, D. P., & Davis, M. 1998, ApJ, 500, 525
- Tananbaum et al. (1979) Tananbaum, H., et al., 1979, ApJ, 234, L9
- Vaughan et al. (2004) Vaughan, S., Edelson, R., & Warwick, R.S., 2004, MNRAS, 349, L1
- Voges et al. (1999) Voges, W., Aschenbach, B., Boller, T., et al., 1999, A&A, 349, 389
- Wamsteker et al. (1985) Wamsteker, W., Prieto A., Vitores, A., Schuster, H.E., Danks, A.C., Gonzalez R., & Rodriguez, G., 1985, A&AS, 62, 255
- Winkler et al. (1992) Winkler, H., Stirpe, G.M., & Sekiguchi, K., 1992, A&AS, 94, 103
| Segment | T-start11Start and End times are given in UT | T-stop11Start and End times are given in UT | 22Observing time given in s |
|---|---|---|---|
| 014 | 2007-07-15 01:35 | 2007-07-16 17:42 | 2372 |
| 015 | 2007-07-18 19:21 | 2007-07-18 19:46 | 1473 |
| 016 | 2007-08-10 14:13 | 2007-08-10 14:15 | 145 |
| 018 | 2007-09-06 23:03 | 2007-09-06 23:10 | 500 |
| 019 | 2007-09-08 00:40 | 2007-09-09 23:28 | 15830 |
| 020 | 2007-09-10 00:51 | 2007-09-10 23:34 | 7122 |
| 021 | 2007-09-11 01:01 | 2007-09-11 23:40 | 6118 |
| 022 | 2007-09-12 00:52 | 2007-09-12 23:32 | 5822 |
| 023 | 2007-09-13 01:15 | 2007-09-13 23:52 | 7197 |
| 024 | 2007-09-14 01:17 | 2007-09-14 24:00 | 7942 |
| 026 | 2007-10-07 00:44 | 2007-10-07 13:39 | 2155 |
| 027 | 2007-10-08 00:50 | 2007-10-08 13:45 | 2275 |
| 028 | 2007-11-09 00:23 | 2007-11-09 02:29 | 2270 |
| 029 | 2007-12-15 10:09 | 2007-12-15 23:18 | 1790 |
| 030 | 2008-01-12 17:56 | 2008-01-12 22:55 | 1528 |
| V | B | U | UV W1 | UV M2 | UV W2 | |||||||
|---|---|---|---|---|---|---|---|---|---|---|---|---|
| Segment | 11Observing time given in s | 22Magnitude corrected for reddening with =0.012 given by Schlegel et al. (1998). The errors given in this table are statistical errors | 11Observing time given in s | 22Magnitude corrected for reddening with =0.012 given by Schlegel et al. (1998). The errors given in this table are statistical errors | 11Observing time given in s | 22Magnitude corrected for reddening with =0.012 given by Schlegel et al. (1998). The errors given in this table are statistical errors | 11Observing time given in s | 22Magnitude corrected for reddening with =0.012 given by Schlegel et al. (1998). The errors given in this table are statistical errors | 11Observing time given in s | 22Magnitude corrected for reddening with =0.012 given by Schlegel et al. (1998). The errors given in this table are statistical errors | 11Observing time given in s | 22Magnitude corrected for reddening with =0.012 given by Schlegel et al. (1998). The errors given in this table are statistical errors |
| 001 | 646 | 14.170.01 | 675 | 14.090.01 | 686 | 14.190.01 | ||||||
| 002 | 550 | 14.180.01 | 588 | 14.110.01 | 588 | 14.190.01 | ||||||
| 003 | 1056 | 14.170.01 | 1171 | 14.080.01 | 1171 | 14.230.01 | ||||||
| 004 | 155 | 15.200.03 | 159 | 15.500.02 | 159 | 14.450.02 | 319 | 14.410.02 | 118 | 14.270.03 | 615 | 14.500.01 |
| 005 | 55 | 15.090.04 | 170 | 15.390.02 | 170 | 14.300.02 | 340 | 14.200.02 | 144 | 14.070.03 | 392 | 14.220.02 |
| 006 | 194 | 15.110.03 | 194 | 15.390.02 | 194 | 14.310.02 | 387 | 14.190.01 | 536 | 14.070.01 | 777 | 14.200.01 |
| 007 | 344 | 15.100.02 | 336 | 15.390.01 | 335 | 14.330.01 | 686 | 14.210.01 | 767 | 14.120.01 | 767 | 14.190.01 |
| 009 | 245 | 15.180.02 | 245 | 15.500.02 | 245 | 14.430.02 | 486 | 14.360.01 | 621 | 14.280.02 | 978 | 14.410.01 |
| 010 | 134 | 15.150.03 | 134 | 15.490.03 | 134 | 14.620.02 | 267 | 14.420.01 | 376 | 14.340.02 | 534 | 14.560.01 |
| 011 | 187 | 15.230.03 | 187 | 15.590.02 | 187 | 14.540.02 | 374 | 14.420.02 | 513 | 14.370.02 | 750 | 14.550.01 |
| 012+013 | 155 | 15.190.03 | 155 | 15.430.02 | 155 | 14.370.02 | 312 | 14.29002 | 373 | 14.170.02 | 625 | 14.320.01 |
| 014 | 19 | 14.650.05 | 37 | 14.460.05 | 111 | 14.470.04 | 50 | 14.650.05 | ||||
| 015 | 145 | 14.580.02 | 290 | 14.480.02 | 436 | 14.440.02 | 560 | 14.560.01 | ||||
| 016 | 16 | 14.470.04 | 31 | 14.310.04 | 46 | 14.240.05 | 35 | 14.410.05 | ||||
| 028 | 189 | 15.390.03 | 189 | 15.730.02 | 187 | 14.750.01 | 374 | 14.630.02 | 510 | 14.590.02 | 745 | 14.730.01 |
| 029 | 152 | 15.400.03 | 153 | 15.780.02 | 153 | 14.760.02 | 124 | 14.670.03 | 375 | 14.590.02 | 248 | 14.740.02 |
| 030 | 144 | 15.250.03 | 156 | 15.580.02 | 156 | 14.540.01 | 310 | 14.450.02 | 260 | 14.330.02 | 623 | 14.440.01 |
| source+backgr | background22The background area is 16 times larger than the source area | |||||||
|---|---|---|---|---|---|---|---|---|
| Observations | 11Exposure times are given in s | S33The hardness ratio is defined as HR=(H-S)/(H+S) with S and H are background subtracted counts in the 0.3-2.0 and 2.0-10.0 keV bands, respectively. The hardness ratio was calculated following the description in Park et al. (2006). | H33The hardness ratio is defined as HR=(H-S)/(H+S) with S and H are background subtracted counts in the 0.3-2.0 and 2.0-10.0 keV bands, respectively. The hardness ratio was calculated following the description in Park et al. (2006). | S33The hardness ratio is defined as HR=(H-S)/(H+S) with S and H are background subtracted counts in the 0.3-2.0 and 2.0-10.0 keV bands, respectively. The hardness ratio was calculated following the description in Park et al. (2006). | H33The hardness ratio is defined as HR=(H-S)/(H+S) with S and H are background subtracted counts in the 0.3-2.0 and 2.0-10.0 keV bands, respectively. The hardness ratio was calculated following the description in Park et al. (2006). | counts | CR44Count rate is given in units of counts s-1. | HR33The hardness ratio is defined as HR=(H-S)/(H+S) with S and H are background subtracted counts in the 0.3-2.0 and 2.0-10.0 keV bands, respectively. The hardness ratio was calculated following the description in Park et al. (2006). |
| 2005 October - 2007 January | 23105 | 7 | 4 | 30 | 33 | 7.2 | 3.1 | |
| 2007 September | 50531 | 8 | 24 | 46 | 50 | 25.9 | 5.11.2 | +0.630.20 |
| 2005 October - 2008 January | 85508 | 18 | 30 | 92 | 105 | 35.7 | 4.20.8 | +0.320.19 |