Mapping dusty star formation in and around a cluster at z = 0.81 by wide-field imaging with AKARI
Abstract
We present environmental dependence of dusty star forming activity in and around the cluster RXJ1716.4+6708 at based on wide-field and multi-wavelength observations with the Prime Focus Camera on the Subaru Telescope (Suprime-Cam) and the Infrared Camera onboard the AKARI satellite (IRC). Our optical data shows that the optical colour distribution of galaxies starts to dramatically change from blue to red at the medium-density environment such as cluster outskirts, groups and filaments. By combining with the AKARI infrared data, we find that 15 m-detected galaxies tend to have optical colours between the red sequence and the blue cloud with a tail into the red sequence, consistent with being dusty star forming galaxies.
The spatial distribution of the 15 m-detected galaxies over 200 arcmin2 around the cluster reveals that few 15 m galaxies are detected in the cluster central region. This is probably due to the low star forming activity in the cluster core. However, interestingly, the fraction of 15 m-detected galaxies in the medium-density environments is as high as in the low-density field, despite the fact that the optical colours start to change in the medium-density environments. Furthermore, we find that 15 m-detected galaxies which have optically red colours (candidates for dusty red galaxies) and galaxies with high specific star formation rates are also concentrated in the medium-density environment. These results imply that the star forming activity in galaxies in groups and filaments is enhanced due to some environmental effects specific to the medium-density environment (e.g. galaxy-galaxy interaction), and such a phenomenon is probably directly connected to the truncation of star forming activity in galaxies seen as the dramatic change in optical colours in such environment.
keywords:
galaxies: clusters: individual: RXJ1716.4+6708 — galaxies: evolution — galaxies: starburst — large-scale structure of Universe.1 Introduction
1.1 Galaxy properties as a function of environment
Galaxies live in various environments. Recent redshift surveys have shown filamentary large scale structures in the local Universe. In the distant Universe, at least up to , similar filamentary nature of large scale structures is found around clusters through wide field observations of distant clusters (e.g. Kodama et al. 2005). There are also some hints that the large scale structure is present at much higher redshifts up to (Shimasaku et al. 2003; Ouchi et al. 2005).
Environment must have played an important role in the history of galaxy evolution since galaxy properties are strongly dependent on environment. This is first noted by Dressler (1980), who showed that early-type galaxies dominate in high density regions while late-type galaxies tend to live in low density regions. This trend is called “morphology–density relation”. After the Dressler’s work, this interesting trend was confirmed and extended by many authors (e.g. Postman & Geller 1984; Dressler et al. 1997; Goto et al. 2003d; Postman et al. 2005). However, it is still unclear what is the key physical process to produce the morphology–density relation or other environmental dependence of galaxy properties.
The morphology–density relation can be understood, at least partly, as a result of morphological transformation of a substantial number of galaxies when they entered high-density environments. Many mechanisms to suppress the star forming activity and to contribute to the morphological transformation have been proposed (see the review by Boselli & Gavazzi 2006). For example, ram-pressure stripping due to the interaction with hot plasma gas filled in the cluster core (e.g. Gunn & Gott 1972), is expected to be effective in rich cluster cores. High-speed encounters between galaxies, which are often called “galaxy harassment”, should occur in very high-density environments (e.g. Moore et al. 1996). In addition, mergers or galaxy-galaxy interactions should also contribute to the galaxy transformation (e.g. Toomre & Toomre 1972). Interactions with the cluster potential may also cause a tidal force when galaxies pass the central region of clusters (e.g. Byrd & Valtonen 1990). Another mechanism that can be effective is the so-called “strangulation” (e.g. Larson, Tinsley, & Caldwell 1980), which leads to a slow decline in star formation rate after a galaxy falls into a more massive (i.e. group or cluster) halo. Identification of the key processes behind the galaxy transformation is one of the major remaining issues in galaxy evolution.
It is well known that the fraction of blue star forming galaxies in clusters increases towards higher redshifts (Butcher-Oemler effect; Butcher & Oemler 1984). Therefore, the transition from blue active galaxies to red passive galaxies should be more commonly seen in distant clusters. We can expect to see directly such truncation in action through observations of distant clusters (see also Goto et al. 2003a). However, importantly, it is reported that most of the actions take place in the outskirts of clusters rather than in the cluster core. In fact, some recent studies focus on the galaxy properties in the surrounding regions of clusters and try to identify the environment where the truncation of star formation occurs in accreted galaxies (e.g. Abraham et al. 1996; Balogh et al. 1999; Pimbblet et al. 2002). In such environment, it is reported that passive spirals (i.e. spiral morphology but no star formation) tend to be found (e.g. Goto et al. 2003b). Kodama et al. (2001) performed a wide-field imaging of the CL0939 cluster at and discovered that the colour distribution changes dramatically at the intermediate density environment which corresponds to groups/filaments. A very similar result was reported by Tanaka et al. (2005) for the surrounding regions of higher redshift clusters, CL0016 at and RXJ0152 at . They suggest that the intermediate density environment such as groups or filaments around clusters are the very sites where the truncation of galaxies is taking place. These pioneer works are really telling us the need for wide-field observation of distant clusters in order to study the physical mechanisms that are responsible for the truncation of galaxies from active phase to passive phase during the course of hierarchical assembly of galaxies to clusters.
1.2 Dusty star forming galaxies in the local and distant Universe
It is well known that red galaxies tend to have little star forming activity (passive galaxies), while blue galaxies have on-going star-forming activity (star-forming galaxies) at a given redshift. However, the classification of passive or star-forming galaxies based only on their optical colours is sometimes highly uncertain. In fact, Haines, Gargiulo, & Merluzzi (2008) showed that of field red sequence galaxies selected from optical colour–magnitude diagrams have on-going star formation activity with EW(H) 2Å, using their local galaxy samples from Sloan Digital Sky Survey (SDSS; York et al. 2000). Davoodi et al. (2006) also showed in their SDSS and SWIRE survey (Lonsdale et al. 2003) that of their samples have red optical colours and infrared excess at the same time, which include both AGNs and on-going dusty star-forming galaxies. Similar results are shown for cluster red sequence. For example, Wolf, Gray, & Meisenheimer (2005) studied the Abell 901/902 cluster at , and showed that of red sequence galaxies are dusty red galaxies from the SED fitting using the medium-band survey (COMBO17; Wolf, Meisenheimer, Röser 2001).
Instead of using optical colours, optical emission lines (e.g. [Oii](Å) and H ( Å)) are often and widely used to measure star formation rates (Kennicutt 1998). However, these lines, especially [Oii] lines in the rest-frame ultra-violet, are attenuated by inter-stellar dust in the galaxies. Also, [Oii] strength is affected by AGN contribution, if any, and dependent on metallicity as well. Although H line is a much better indicator than [Oii] in this respect (and is in fact one of the best indicators of star formation rates among emission lines), it is redshifted to near-infrared (NIR) regime at , where large format wide-field camera or spectrograph has become available only recently. Given these difficulties in optical and NIR observations, infrared (IR) luminosity of a galaxy that can be sensitively obtained by space telescopes, serves as an ideal measure of star formation rate, and it is also well calibrated with local starburst galaxies (Kennicutt 1998). Since the total IR luminosity of a galaxy can be estimated through single broad-band imaging at mid-infrared (MIR) (e.g. Takeuchi et al. 2005), it is critically important to observe clusters in MIR bands as well as in the optical/NIR in order to reveal the hidden star formation activity and hence trace its true star formation history. This is especially true at high redshifts, because the luminous infrared galaxies (LIRGs) which have and ultraluminous infrared galaxies (ULIRGs) which have are more commonly seen in the distant Universe than in the local Universe (e.g. Sanders & Mirabel 1996; Le Floc’h et al. 2005).
1.3 Infrared observation of galaxy clusters
Taking these situations into account, wide-field MIR study of galaxy clusters covering entire structure around the cluster is required to investigate the “true” environmental dependence of star formation activities of galaxies. However, until recently, infrared studies of galaxy clusters have been conducted mainly with the ISO satellite (Kessler et al. 1996), which have been limited to very inner regions of clusters (see the review by Metcalfe, Fadda, & Biviano 2005). Even though, some of these studies showed the importance of large amount of hidden star formation activity in the cluster environment (e.g. Duc et al. 2002). The recent advent of the Spitzer MIPS (Rieke et al. 2004) has enabled us to investigate wider fields of distant clusters up to . Geach et al. (2006) observed very wide field (25 25′) around CL0024 () and MS0451 () clusters by mosaicing MIPS images. Marcillac et al. (2007) and Bai et al. (2007) observed RXJ0152 and MS1054 (both at ), respectively, but their field coverage is limited only to cluster central regions. Bai et al. (2007) actually imply that for rich clusters at even wider-field infrared studies are needed.
In the local Universe, it is well established that star formation activity depends strongly on environment in the sense that it systematically declines towards higher density regions (e.g. Gómez et al. 2003). Recently, however, surprising results are reported where such a relationship between star formation activity and local galaxy density becomes inverted at (Elbaz et al. 2007; Cooper et al. 2007), i.e., star formation rate increases towards higher density environment at . This is naively expected that one approaches to the formation epoch of cluster galaxies which is probably systematically skewed to higher redshifts compared to the formation epoch of field galaxies. Therefore, looking back the environmental dependence of star formation activity in galaxies as a function of redshift is a basic but vital step towards understanding the environmentally dependent galaxy formation and evolution.
In this paper, we conduct for the first time a panoramic MIR study of a cluster, over a very large area including surrounding groups, filaments and outer fields. Throughout this paper, we use , , and km s-1Mpc-1. Magnitudes are all given in the AB system, unless otherwise stated.
2 Data
2.1 RXJ1716 cluster
The RXJ1716.4+6708 cluster at that we study in this paper was first discovered in the ROSAT North Ecliptic Pole Survey (NEP: Henry et al. 1997). Optical spectroscopy was performed by Gioia et al. (1999) and 37 cluster members were identified. Using these spectroscopic samples, Gioia et al. (1999) determined the velocity dispersion of this cluster to be km s-1. This value is relatively large for its rest-frame X-ray luminosity of erg s-1 and the temperature keV which are based on Chandra data (Ettori et al. 2004, see also Gioia et al. 1999, Vikhlinin et al. 2002, and Tozzi et al. 2003). Therefore, it is suggested that this cluster is not totally virialised yet. In fact, the brightest cluster galaxy (BCG) of this cluster is located on the northwestern edge of the structure (Clowe et al. 1998), which may be linked to the fact that the structure of this cluster is still being formed. The weak-lensing mass of this cluster is estimated to be (Clowe et al. 1998). This is consistent with the estimated mass based on the the X-ray data in Ettori et al. (2004); . As the X-ray properties of this cluster suggest, this cluster is relatively rich for a cluster at this redshift.
It has been known that this cluster has a small subcluster or group to the northeast of the main cluster, and the morphology of the X-ray image of this cluster elongates towards the subcluster (e.g. Jeltema et al. 2005). Koyama et al. (2007) performed wide-field optical imaging of this cluster and discovered prominent large-scale structures penetrating the cluster core and the second group of this cluster towards the southwest of the cluster core based on the photometric redshift technique (see Section 2.2).
2.2 Optical data
We have been conducting the PISCES project (Kodama et al. 2005). Taking advantage of the wide field coverage of the Prime Focus Camera on the Subaru Telescope (Suprime-Cam; Miyazaki et al. 2002), we have investigated various environments around the X-ray detected distant clusters at (e.g. Kodama et al. 2005; Tanaka et al. 2005, 2006, 2007a,b; Nakata et al. 2005; Koyama et al. 2007). As a part of this project, Koyama et al. (2007) conducted a deep and wide-field optical study of the RXJ1716 cluster with the Suprime-Cam. We observed this cluster in -bands which neatly bracket the 4000Å break feature of galaxies. Catalogues were created with galaxies, which corresponds to 5 detection limits of our -band image. We select the cluster members by photometric redshift technique (phot-) using the code of Kodama, Bell, & Bower (1999), and showed the prominent large-scale structures around the cluster (see Figs. 3 and 4 of Koyama et al. 2007). Galaxies with were used to map out the large-scale structures and this member selection is used in this paper. See Koyama et al. (2007) for the summary of our optical data, data reduction, and the combined colour image of this cluster.
2.3 Infrared data
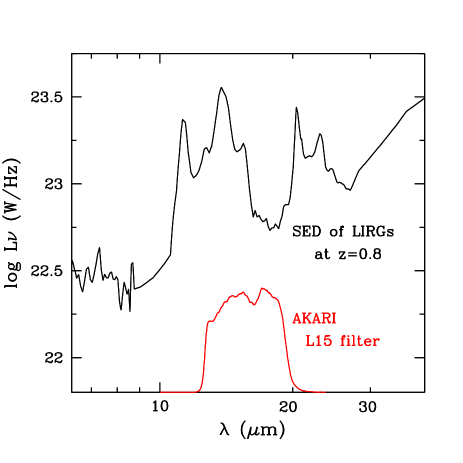
We obtained deep and wide-field IR imaging data for the RXJ1716 cluster with the Infrared Camera (IRC: Onaka et al. 2007) onboard the AKARI satellite (Murakami et al. 2007). Due to the good visibility of NEP directions from AKARI, we could get very deep data for the RXJ1716 cluster which is located near the NEP (see Section 2.1). The observations were executed from November 26 to December 8 in 2006, on an open-use programme CLNEP(PI: T. Kodama) and a mission programme CLEVL(PI: H.M. Lee). We observed this cluster in the N3(3.3 m), S7(7.0 m) and L15(15.0 m) filters, using the Astronomical Observation Templates (AOT) for deep observation (IRC05) with an AOT filter combination parameter of “b” (see AKARI IRC Data User Manual, Lorente et al. 2007). We should note that the L15 filter neatly captures the polycyclic aromatic hydro carbon (PAH; Puget & Leger 1989) emissions from star-forming galaxies at (Fig. 1).
We set the three field of views (F1, F12 and F2) to cover the large scale structures around the RXJ1716 cluster photometrically discovered by Koyama et al. (2007) (see Figs. 2 and 7b). The number of the pointed observations and corresponding integration time for each field are summarised in Table 1. Note that 10 and 30 frames with effective exposure times 44.4 and 16.4 seconds were included in a single pointed observation for N3 and S7/L15, respectively. Therefore, typically, one pointed observation corresponds to 7.4 min and 8.2 min exposure observation for N3 and S7/L15, respectively. IRC has a wide field of view (about ), and our observed fields F1, F12 and F2 covered about 200 arcmin2 in total (see Figs. 2 and 7b). We stress here that our study is the first attempt to cover such a wide field around the cluster in MIR bands. We can study the cluster core to outskirt regions at once and this is critically important to discuss the environmental dependence of the infrared properties of galaxies in and around high- clusters.
The data were reduced with the IRC imaging pipeline (version 20071017, Onaka et al. 2007) in a standard manner (see Lorente et al. 2007). We ran the pipeline for each of the pointed observational data, and we made the reduced image for each of the pointed observations at first. In this process, we subtracted the median filtered sky with kernel for individual frame before co-adding the frames. Note that the pipeline often fails to align L15 frames because of the small number of firmly detected sources. Therefore, we used “coaddLusingS” option in the pipeline, which uses the alignment of the S7 frames to align the L15 frames (see also Lorente et al. 2007 and Wada et al. 2007). After that, we matched the position of all the images generated from each pointed observational data using the IRAF tasks ’geomap’ and ’geotran’, and we co-added all the images together. The final 15 m image is shown in the right panel of Fig. 2.
Since the exposure times are not uniform over the observed field, limiting flux depends on the position. However, as we observed with 14 pointings for F1 field in N3 and S7 band and with 15 pointings for F12 field in L15 band (see Table 1), the depths of the data depend mainly on whether a position is covered by these deep observations or not. We thus divide each image into “deep” and “shallow” regions and estimate the sky noise limits of both regions by a simple aperture photometry of randomly distributed apertures in all the images. Note that we do not use areas near very bright sources. The aperture diameters were set to 8′′, 10′′ and 11′′ for N3, S7 and L15, respectively. These correspond to twice the size of FWHM of the point spread function of each image. We also used these diameters for source extraction (see below). The 5 limiting fluxes of deep and shallow regions for each band is summarised in Table 2. Sources were extracted using sextractor (Bertin & Arnouts 1996). Using the same size of apertures (i.e. twice the size of FWHM of each image), we measured flux_aper of sources in each image. We made the 3 m catalogue with flux_aper in N3 band, the 7 m catalogue with flux_aper in S7 band and the 15 m catalogue with flux_aper in L15 band. These 5 detection criteria for the deep regions approximately correspond to detection for the shallow regions (Table 2). Also, we use flux_auto and mag_auto as the total fluxes and the total magnitudes of the sources as shown in Wada et al. (2007). We note that all the scientific quantities such as total IR luminosities and star formation rates are measurements based on these total fluxes (see also Section 3.2).
| filter | F1 | F12 | F2 |
|---|---|---|---|
| N3 | 14 (104 min) | 2 (15 min) | 3 (22 min) |
| S7 | 14 (115 min) | 3 (25 min) | 3 (25 min) |
| L15 | 3 (25 min) | 15 (123 min) | 4 (33 min) |
| filter | deep (5) | shallow (5) |
|---|---|---|
| N3 | 7.0 Jy | 11.9 Jy |
| S7 | 21.9 Jy | 33.0 Jy |
| L15 | 66.5 Jy | 96.5 Jy |
3 Analysis
3.1 Cross identification between optical and IR sources
We need to cross match between the AKARI IR sources and the Subaru optical sources. We should be very careful when we identify the sources in a crowded region like a galaxy cluster. We have cross-identified the 15 m sources in the optical (-band) image and created “15 m member” catalogues in the following way.
Firstly, we search for any optical counterpart(s) using a radius from each 15 m source. This radius is sufficiently larger than the FWHM of the PSF in the 15 m image ( 5.′′5). The relative positional accuracy between the -band image and the L15 image is also sufficiently smaller ( ) than this search radius. We find that 149 of 15 m sources have at least one phot- member galaxy (i.e. with as used in Koyama et al. (2007) to trace the large scale structure) within this radius. Secondly, we carefully examine all of them by eye. We basically select the nearest object as the optical counterpart of each 15 m source. If the optical counterpart is confirmed to be an isolated phot- member galaxy, we put it in the “resolved 15 m member catalogue” (see an example in Fig. 3a). On the other hand, due to the large FWHM of the PSF of the 15 m image compared to the optical image, some 15 m sources are not resolved in the source extraction process although they show multiple peaks or extended shape in the 15 m image. We find that the number of such extended sources are not negligible. Therefore, in such a case, we carefully look at the shape of the 15 m image by eye and judge if the 15 m multi-peak or extended source is associated with any phot- members. If we find any phot- members associated with the 15 m source, we put it into the second catalogue, named “unresolved 15 m member catalogue” (see the examples in Fig. 3b,c).
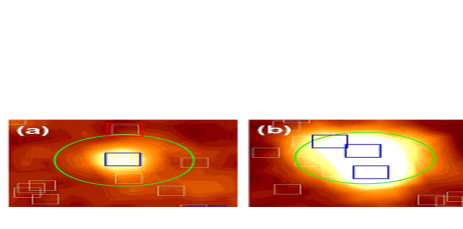
Most of the “resolved” 15 m members have optical counterparts within 2′′ radius (median value is 0.′′7), while counterparts of “unresolved” 15 m members are found at relatively larger distance (median value is 2.′′5). We note that in the latter catalogue there are some 15 m sources which have more than one optical counterparts (Fig. 3b,c). For such sources, there is a possibility that the 15 m flux of them is measured as a sum of the fluxes from more than one objects. Therefore, we cannot know its separated individual 15 m fluxes correctly and we can only know an upper limit. The cross identification itself is more difficult for unresolved 15 m members due to the complexity of the shape of the 15 m sources. Given these problems, we have to treat them carefully in the following sections, and in fact we do not include these “unresolved” 15 m members in the following analyses whenever the 15 m fluxes are required. We count these sources only if detection at 15 m is concerned. However, we have confirmed that the inclusion of such “unresolved” sources or not does not affect our results (see also Section 4.4).
For the total of 436 sources detected at 15 m in our AKARI field, we find that 91 of 15 m sources are associated with phot- members. In this sample, 54 sources are turned out to be resolved 15 m members. The remaining 37 sources are unresolved cases and we have 65 unresolved 15 m members. This is because about a half of these 37 sources are associated with more than one phot- members. Therefore, we have 54 resolved and 65 unresolved 15 m members in total as the numbers of optical counterparts. For the resolved 15 m members, we search for a counterpart in N3 and S7 images in the same way as the cross identification between L15 sources and optical sources described above (i.e. after searching for N3/S7 counterparts using radius from each 15 m member, checking them by eye ). In the resolved 15 m members, 18 sources are identified in both N3 and S7 bands, and 24 sources are identified only in N3 band. The rest of them are not well distinguished as a single object in either N3 or S7 bands. Our main interest is in the 15 m detected cluster members because these sources are the candidates for dusty star forming galaxies. Therefore, we use 15 m detected cluster members in the following sections regardless of the identification in N3 or S7 images.
Note that photometric redshift is not always the precise criterion to select the cluster member galaxies. There remains a possibility that some fore-/background contaminations are included in our 15 m member catalogues. Unfortunately, we cannot estimate the probability that a galaxy out of the range falls into this redshift range by our phot- estimation because we do not have spectroscopic information of normal galaxies in our RXJ1716 field. However, we do know some spectroscopic redshifts for the X-ray sources in our RXJ1716 field from Kim et al. (2007). We find that only 1 out of 27 such sources is miss-identified as our phot- member. Therefore, the fore-/background contamination in our phot- samples is expected to be very small, although firm conclusion waits for a similar check using normal galaxies, which cannot be done at the moment because of unavailability of their redshifts. Marcillac et al. (2007), who studied the RXJ0152 cluster at , estimated that the fraction of 151 spectroscopically confirmed non-members that fall into the range is only 7%. They used the photometric redshifts estimated in Tanaka et al. (2005) (i.e. phot- code in Kodama, Bell, & Bower (1999), using the Subaru data), which is the same as that used in this study. Marcillac et al. (2007) also showed that the photometric redshifts worked well for their spectroscopically confirmed MIR member galaxies (). Therefore, the photometric redshift selection would not do any critical harm on the statistical properties of our 15 m members, either. We should, however, confirm the physical association of these sources to the cluster through spectroscopic follow-up observations in our future work.
3.2 Derivation of star formation rates for the 15 m members
The AKARI’s L15 band corresponds to m in the rest frame of the RXJ1716 cluster at . This wavelength range neatly includes 7.7 and 8.6 m broad line emission features of PAHs (Fig. 1). It is well known that MIR broad band luminosity correlates with total infrared luminosity () and hence star formation rate through a good correlation between and star formation rate (Kennicutt 1998). It is particularly true in this case, since the PAH emissions originate from photo dissociation regions associated to star forming regions and the intensity of PAH features themselves are in good correlation with star formation rate (e.g. Chary & Elbaz 2001).
To derive of each galaxy, we use the template SEDs of starburst galaxies from Lagache et al. (2004). We calculate the conversion factor of our 15 m (rest frame m) luminosity to the total (8–1000 m) luminosity using their 5 template SEDs (i.e. templates for and starburst galaxies). The derived correlation between (8 m) (AKARI L15 band flux) and (8–1000 m) is shown in Fig. 4. Using this correlation, we estimate the total IR luminosity from the measured total 15 m flux (i.e. flux_auto value from sextractor ) of each 15 m member. Then, using the Kennicutt (1998) calibration:
we derive its star formation rate. A histogram of and corresponding SFR in our total samples are shown in Fig. 5. Due to the flux limit of our MIR observation, almost all of our MIR samples are turned out to be LIRGs with . Our 15 m flux limit of 67 Jy corresponds to SFR of 25 M⊙/yr. We calculate and SFR only for the “resolved” 15 m members since we cannot separate and measure individual 15 m fluxes of the unresolved sources (see Section 3.1). We should note that we do not require accurate absolute values of and SFR in this paper and our conclusion will rely rather on their relative values as a function of environment.


There is an issue that our IR galaxy samples may contain contamination from active galactic nuclei (AGNs). It is reported that the mean AGN fraction in clusters is only % from optical spectroscopic surveys. (e.g. Dressler et al. 1999 for their 10 clusters at ). However, an excess of X-ray detected AGNs is also reported in some clusters (e.g. Martini et al. 2002). In our 15 m member galaxies, we identified three X-ray point sources using the Chandra X-ray point source catalogue constructed by Kim et al. (2007). Although we admit that we cannot detect all AGNs in X-ray, these three sources are strong candidates for AGNs and we consider that at least a part of their 15 m fluxes are emitted from AGNs. Another possible technique to distinguish AGNs from starburst galaxies is to use rest-frame NIR colours, based on the different NIR SED properties of these two populations (e.g. Webb et al. 2006). Rest-frame NIR SEDs for starburst galaxies are relatively flat, while AGNs produces power-law SEDs which increases towards longer wavelength. In our data set, the slope of the NIR SEDs calculated using the fluxes in N3 (rest-frame 1.8 m) and S7 (rest-frame 3.9 m) would be useful. We therefore investigated the N3S7 colour of each resolved 15 m member galaxy to see if there is any possible candidate of AGN. In our 54 resolved 15 m members with Jy, 18 galaxies are identified in both N3 and S7 bands, 24 are identified only in N3-band, and the remaining 12 are identified in neither N3 nor S7 bands (see also Section 3.1). Out of the 18 galaxies detected in all bands, only two have NIR colour that is redder than N3S7=0.0, which could be considered as AGN candidates. However, we notice that these two sources are not detected in X-ray.
In these ways, we have identified five AGN candidates in total from our 15 m member galaxies. However, we do not exclude these objects from our sample because we cannot know if all the MIR emissions from these sources are from AGNs. It is still possible that starburst is also in place in the AGN host galaxies. We stress here that the effect of including these AGN candidates for our conclusion is negligible (see more detailed discussion in Section 4.4). We should note, however, that we do not have any information of NIR SEDs for the objects that are not detected in either N3 or S7 bands. There remains some possibility that some of these objects could be associated with AGNs, but we cannot exclude them under present conditions. In any case, future spectroscopic follow-up observations of the 15 m members is necessary to discuss the AGN contamination further.
4 Results
4.1 15 m members on the colour–magnitude diagram
In this subsection, we present optical properties of the 15 m detected galaxies in the RXJ1716 cluster, mainly focusing on optical colours of these galaxies. In Fig. 6(a), we show a colour–magnitude diagram in vs. for the entire field covered by the AKARI observations. All the cluster member galaxies selected on the basis of photometric redshifts are shown. The 15 m cluster members are represented by open symbols. The “resolved” and “unresolved” 15 m members are indicated by open circles and triangles, respectively. Most of the 15 m members are optically bright galaxies with mainly because of the limited depth of the MIR observations.
The 15 m members are distributed in slightly bluer side of the red sequence, which is often called a “green valley” region. We show in Fig. 6(b) the histograms of colour distribution for all the phot- selected cluster member galaxies with (open histogram) and for only the 15 m member galaxies with (hatched histogram). A clear bimodality is seen in the open histogram, while the hatched histogram shows a unimodal distribution that fills the gap between the two peaks of red and blue galaxies. This trend is quantified by calculating the fraction of MIR detected galaxies as a function of colour using the galaxies (a locus in Fig. 6b). A similar colour distribution was reported in Geach et al. (2006) for two clusters based on Spitzer MIPS observations. The medium colours of the MIR detected galaxies bridging the “green valley” would be due to dust reddening of blue star forming galaxies. We also find that this trend can be seen even if we limit the sample for relatively bright () or faint () galaxies. We should note, however, that this trend might be produced partly due to the small systematic difference in luminosity of galaxies between those in the green valley (brighter) and those in the blue cloud (fainter).
It is interesting to note that some red-sequence galaxies are detected at 15 m. It can be interpreted that they are forming stars but are highly reddened by dust. Recently, it is reported that the fraction of such MIR detected star forming galaxies on the red sequence in the total star forming galaxies increases towards distant clusters (Saintonge, Tran, & Holden 2008). We hereafter call these optically red 15 m members “dusty red galaxies”, and discuss them further in Section 4.4.
4.2 Optical colour transition in the outskirts of the cluster
In this subsection, we define galaxy environment on the basis of local projected number density of galaxies. We use a nearest-neighbour density, which is widely used by many authors (e.g. Tanaka et al. 2005). The number density at each galaxy’s position is calculated using the neighbouring galaxies located within the circle of the radius that is equal to the distance from the galaxy to the 5th-nearest galaxy (hereafter, ). In this calculation, all the optically selected phot- members are used.
Fig. 7(a) shows the colours of individual member galaxies as a function of the above defined local density (). The colour distribution changes dramatically at as the median (50 %) colour locus suggests. It can also clearly be seen in the fraction of red galaxies that starts to increase sharply at . We divide the galaxies into three environmental bins, namely, low-density (), medium-density () and high-density () regions. The medium-density region is defined to a relatively narrow range of local density where the optical colour distribution starts to change. These definitions of the environments may seem a little arbitrary, but our results do not change if we slightly change the definitions of the environments. In Fig. 7(b), we show the spatial distribution of the member galaxies in each environment with different symbols. The high-density region corresponds approximately to the cluster core region. The medium-density environment trace outskirts of the cluster core, groups and filaments. The low-density environment corresponds to the remaining fields outside the groups and filaments. We note that the median value of for all the galaxies with in our entire Suprime-Cam field (3427′) is . Excluding the cluster region would only lower this value by a negligible amount. Therefore, we can reasonably consider that our low-density region corresponds to general field at the Universe at least in terms of the local density of galaxies.
The above finding that the colour distribution dramatically changes in the “medium-density” environment is consistent with the previous works. Kodama et al. (2001) showed similar results for the cluster, and Tanaka et al. (2005) also found similar trends for and clusters, both based on the panoramic imaging with Suprime-Cam on the Subaru Telescope. The current result for another cluster (RXJ1716) lends further support to the scenario that galaxies start to be truncated in groups or outskirts of clusters before they entered a very high-density environment such as cluster cores. This scenario requires some mechanism that works efficiently in relatively low-density environment and truncates star formation activity.
4.3 Low star formation rate in the cluster core
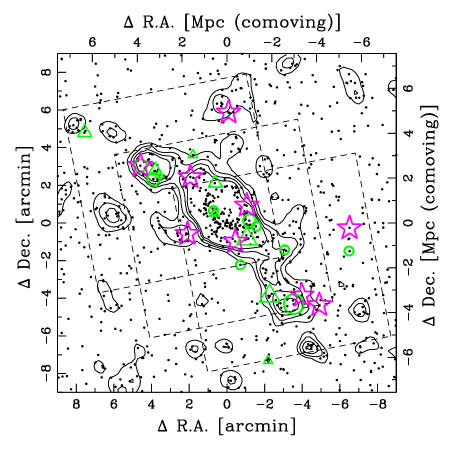
We show in Fig. 8(a) the spatial distribution of 15 m member galaxies on top of the distribution of phot- selected member galaxies over the area centred on the RXJ1716 cluster. This area corresponds to 15 Mpc 15 Mpc in comoving scale at . The open circles and triangles indicate the positions of the resolved and the unresolved 15 m members, respectively. The 15 m fluxes of the 15 m members are indicated by three different sizes of the symbols (brighter objects are shown in larger symbols).
A close-up map of the central region is shown in Fig. 8(b). It is worth noting that a field corresponds to the field of view of a single pointing with Spitzer MIPS, and our total spatial coverage with AKARI is times wider than that. Our data is deepest at this cluster central region because this region is covered by all the F1, F2 and F12 fields. Therefore, we here plot the 15 m members all the way to the faintest end at 15 m ( 3.5 detection). However, we rarely see 15 m members in the very central region of the cluster (i.e. from the centre), although the number density of the phot- cluster members is the highest in this very central region. In contrast, the outer regions just outside this zone of avoidance of the 15 m members, many 15 m members are detected. In particular, they are distributed preferentially at the region north-east and south-west away from the centre. These regions are located right on the large scale NE–SW filament penetrating the cluster core and hosting two distinct groups (see Fig. 8a).
To show it more quantitatively, we plot the cumulative radial profiles of the member galaxies as a function of distance from the cluster centre out to in Fig. 9. Fig. 9 clearly shows that the 15 m members are less concentrated in the region of the cluster than the general cluster member galaxies. From the slope of the curve for the 15 m members, we see that many 15 m members are located in the radius range of 1.5–2.0 arcmin from the centre, which in fact corresponds to the region just around the cluster centre (see also Fig. 8b). A Kolmogorov-Smirnov test on these two subsamples shows that the probability that these two are from the same parent is only 3.5 %. A more detailed analysis of the distribution of the 15 m member galaxies will be carried out in Section 4.4.
4.4 Enhancement of dusty star formation activity in the cluster outskirts
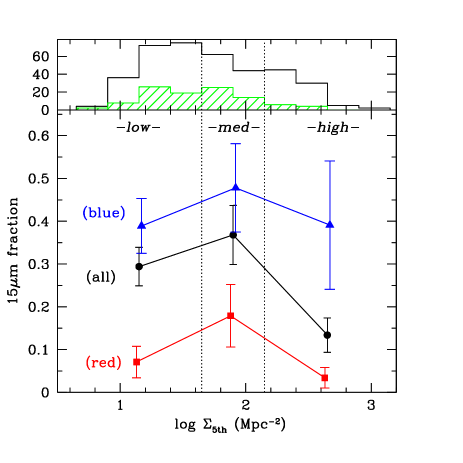
For each environment (i.e. low, medium and high density), we calculate the fraction of the 15 m members in all the member galaxies with , including both resolved and unresolved 15 m members. We show in Fig. 10 the fractions of the 15 m members with for red, blue and red+blue cluster member galaxies as a function of the environment. The boundary between red and blue is set as
which is defined as 0.2 mag bluer than the best-fitted CMR shown in Koyama et al. (2007) (see also Fig. 6a). We only used the galaxies with because the number of 15 m members with is very small due to the depth of the 15 m image (see Fig. 6a).
We show in Fig. 10 that the 15 m fraction for all galaxies decreases dramatically in the high-density environment compared with low and medium-density environments. This represents the very low star forming activity in the cluster core. On the other hand, we find that the 15 m fraction is still high in the medium-density environment compared with the low-density fields, although we showed in Section 4.2 that the galaxy colours starts to sharply change in the medium-density environments. Although the statistics is not very good, the fraction seems to be higher in the medium-density environment than in the low and high-density environments. Such a trend is likely to be strong for the red galaxies. This may indicate that in the medium-density environments dusty red galaxies are preferentially produced and/or the star forming activity is once enhanced for some galaxies (see below).
In this calculation, we included all the 15 m members down to the limit of Jy (i.e. in the deep region and in the shallow region), but we found that this trend does not change if we limit the sample to relatively brighter 15 m members (e.g. Jy which corresponds to in the deep region and in the shallow region). Also, as noted above, we included both resolved and unresolved 15 m cluster members in this calculation. If we use only the resolved 15 m cluster members, the significance of the high fraction of optically red 15 m members in the medium-density environment becomes even higher.
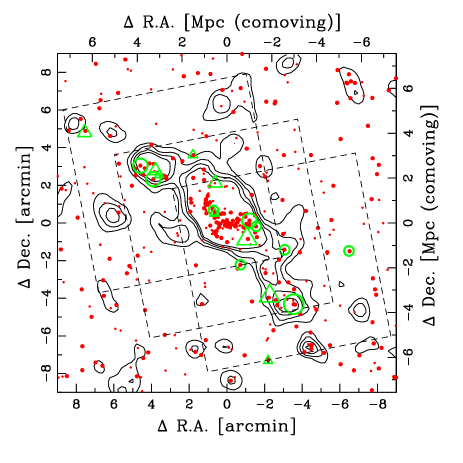
We now focus on the optically red 15 m members (i.e. dusty red galaxies) that we have noted in Section 4.1. We find 19 such galaxies in the entire field, and they are detected at significantly larger fraction in the medium-density environment compared to the low and high density environments (more than times larger). Detection in 15 m of the optically red galaxies should mean that these galaxies still have on-going star formation activity, although their colours are as red as passively evolving galaxies. As described in Section 4.1, these galaxies are strong candidates for star forming galaxies heavily attenuated by dust. Our results therefore suggest that the dusty star formation activity is induced by some mechanisms which are effective in the medium-density environment. We plot the spatial distribution of these optically red 15 m cluster member galaxies in Fig. 11 on top of all the optically red phot- members. It is quite noticeable that almost all dusty red galaxies are distributed exclusively along the filament including groups traced by the optical members, and in fact, this distribution is very similar to that of the member galaxies in the medium-density environment (see Fig. 7b). Although there are a few dusty red galaxies in the low and high density environments as well (Fig. 10), almost all of them are located immediately outside of the filaments.

To study the properties of the 15 m members in the medium-density environment further, we investigate the colours for the 15 m members. The -band magnitudes approximate the stellar mass of galaxies ( Å in the rest frame for galaxies) and the 15 m magnitude approximates the star formation rate. Therefore, colour approximately corresponds to “specific star formation rate (SSFR)” which is defined as star formation rate per unit stellar mass of galaxies. Since SSFR has a unit of inverse of time, it can be regarded as a timescale of star formation activity (i.e. galaxies which have high SSFR are considered to have short star formation timescales). In Fig. 12, we plot the colours for the resolved 15 m members as functions of local density and -band magnitude.
We notice that 9 out of 54 galaxies plotted in Fig. 12 have large colour indices of . We can consider that these galaxies are forming stars vigorously and efficiently for their stellar masses. This boundary roughly corresponds to Gyr for mag galaxies. This calculation is based on the stellar mass of a galaxy calculated from the -band magnitude using the disk galaxy model in Kodama, Bell, & Bower (1999) and the SFR calculated from the 15 m magnitude. We hereafter call these galaxies “high SSFR galaxies”. Interestingly, many of the high SSFR galaxies also tend to live in the medium-density environment (see Fig. 12a). We note that 7 out of 23 ( 30%) 15 m members satisfy the high SSFR criterion in the medium-density environment, while only 2 out of 29 (7%) galaxies in the low-density environments are high SSFR galaxies, and there is no such galaxy in the high-density environments. In Fig. 12(b), we can see that the -band magnitudes of such high SSFR galaxies tend to be fainter than . We show the spatial distribution of such high SSFR galaxies in Fig. 13 with large open stars. The high SSFR galaxies also tend to be seen in or just around the filament, although their distribution may be slightly more extended than that of the dusty red star forming galaxies (i.e. open circles and triangles in Fig. 13).
We note that in Section 3.2 we found five possible AGN candidates, at which three have X-ray detections and the other two have red N3S7 colours. We find none of these five sources satisfy the high SSFR criterion of . We find two optically red sources in these five AGN candidates (one in the low-density environment and the other in the medium-density environment). Therefore, we find that these AGN candidates do not strongly affect our results on the high SSFR galaxies and the dusty red galaxies. We stress here that even if these galaxies are really associated with pure AGNs and if we exclude these galaxies from our sample, our conclusion is not changed.
It is found that both the “dusty red galaxies” and the “high SSFR galaxies” prefer to live in the medium-density environment. Since this environment is the one where colour distribution of galaxies start to change drastically from blue to red (see Section 4.2), it is reasonable to think that these galaxies are related to such colour transition of galaxies, and they may be at the transient phase from blue active galaxies to red passive galaxies during the course of hierarchical assembly to higher density regions.
5 Discussion
In this section, we discuss our results in broader context of environmental dependence of galaxy evolution in clusters by comparing with previous works in the literature. Since our study is the first attempt to investigate around a cluster with such a wide field coverage in MIR observation, we cannot directly compare our results with others for the region far out from the cluster centre. As for the cluster central regions, two clusters (RXJ0152 and MS1054, both at ) are studied recently with Spitzer MIPS by Marcillac et al. (2007) and Bai et al. (2007). Marcillac et al. (2007) found that MIR cluster members are distributed outside the two main clumps traced by X-ray emissions in the RXJ0152 cluster. Similarly, Bai et al. (2007) showed that there are few IR galaxies in the high-density regions of the cluster. For the RXJ1716 cluster, we find in Section. 4.3 that the 15 m member galaxies are distributed avoiding the central part of the cluster, which is qualitatively consistent with the results of Marcillac et al. (2007) and Bai et al. (2007). The absence of luminous infrared galaxies in the cluster centre is also reported for some lower- clusters, including local Coma and Virgo clusters by ISOCAM (see review by Metcalfe, Fadda, & Biviano 2005). Therefore, we have confirmed the low star formation activity in the high-density environment such as cluster centres with the MIR observations to . It is natural to think that the red optical colours of the galaxies in cluster centres are primarily due to the lack of star formation activity and not due to the reddening by dust.
We found that MIR bright cluster members are detected relatively far out from the cluster centre, especially in group/filament environment. Very recently, Fadda et al. (2008) conducted a very wide-field MIR observation with Spitzer MIPS which covers two filaments around the Abell 1763 cluster (), and found that the fraction of starburst galaxies is more than twice larger in the filaments than in the inner region or outer fields of the clusters. The enhancement of star forming activity in filaments is also suggested in nearby clusters in the optical studies (e.g. Porter & Raychaudhury 2007; Porter et al. 2008). Our result for the cluster at is qualitatively consistent with these studies in the sense that star forming activity is enhanced in the intermediate density environment between low-density general field and the high-density cluster core. From the field study at , it is reported that the environment of LIRGs/ULIRGs is denser than that of field galaxies (e.g. Marcillac et al. 2008). Elbaz et al. (2007) studied a structure at in the GOODS-North field with Spitzer MIPS, and showed that galaxies with strong star formation are preferentially seen in group centres. They suggested that, at , SFR of individual galaxies increases with increasing density up to a certain critical density and it decreases again at higher density (see also Cooper et al. 2007). For distant clusters, Poggianti et al. (2008) recently suggest a possible peak in the SFR-density relation based on the [Oii] line study of EDisCS clusters at . These studies are also qualitatively consistent with our results, although the structures investigated in Elbaz et al. (2007) would be much poorer systems than the RXJ1716 cluster, judging from their weak X-ray detection.
We now focus on the optically red star forming galaxies (i.e. “dusty red galaxies”). Dusty red star forming galaxies in clusters were studied in some previous works. For example, Coia et al. (2005) studied the CL0024+1654 cluster at with ISOCAM, and found that about half of the MIR sources in the cluster reside on the red-sequence. These dusty galaxies are not concentrated in high-density regions. Based on the COMBO-17 data for the A901/902 clusters at , Wolf, Gray, & Meisenheimer (2005) also showed that more than 1/3 of the red-sequence galaxies have dusty red SEDs. They also found that these dusty red galaxies prefer medium-density outskirts of the clusters and they are rare in low or high density environments. Since the redshifts of these clusters are lower than that of RXJ1716 (), we cannot conclude that these are the same populations as our dusty red galaxies. However, judging from their optically red colours while having signs of on-going star formation activity, we expect that our dusty red galaxies are similar counterparts of the dusty populations seen in the two low- clusters studied by Coia et al. (2005) and Wolf, Gray, & Meisenheimer (2005). As we showed in Fig. 11, our dusty red galaxies are preferentially located in the medium-density environment. It is interesting to note that these optically red star forming galaxies are common in the outskirt of clusters at all redshifts through , although the number of cluster sample is very limited.
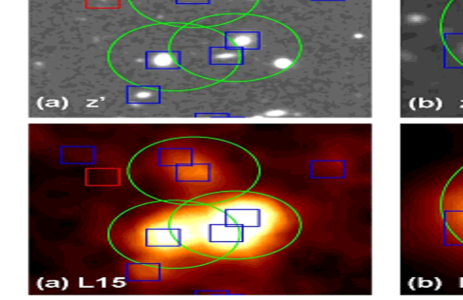
Finally, we discuss the physical mechanisms that can play major roles in galaxy truncation of star forming activity. Marcillac et al. (2007) found that MIR members in the RXJ0152 cluster seem to be mostly associated with the in-falling late-type galaxies classified by Blakeslee et al. (2006). They suggest that a burst of star formation can occur during the galaxy in-fall process. Since we do not have spectroscopic data for our 15 m cluster members, we cannot be sure at this stage that our 15 m members are physically associated to the in-falling galaxies, but it is likely that at least some of our 15 m cluster members in the RXJ1716 cluster are indeed the galaxies that are in-falling along the filament to the main body of the cluster by gravity. In fact, we have some good candidates of in-falling groups far away from the cluster centre located at around (6.′0, 0.′0), (0.′0, 6.′0) and (2.′0, 2.′0) in Fig. 8(a) as the iso-density contours clearly show. We show in Fig. 14(a) an example of the candidates of an in-falling group located at (0.′5, 1.′5) in Fig. 8(b) which is 1 Mpc away from the cluster centre. We need spectroscopic confirmation of the physical association of these systems to the cluster.
We have revealed that the 15 m members are found far out from the cluster core especially in the medium-density environment such as groups or filaments where the optical colour distribution strongly changes. Our results suggest that many galaxies which entered medium-density environment from the low-density field experience starburst, and these galaxies are observed as dusty star forming galaxies and/or high SSFR galaxies around the RXJ1716 cluster. Moreover, it would be natural to consider that the burst of star formation is linked to the colour and morphological changes of galaxies and truncation of star forming activity. The most likely physical mechanism at work in these medium density regions which also involves starburst would be galaxy-galaxy interaction or mergers (e.g. Hopkins et al. 2008). We have two good examples of 15 m members which show prominent interacting features (Fig. 14b,c). The strong MIR emissions from these systems must be produced in the process of the galaxy interaction. These findings may suggest a link between the dusty star forming activity of galaxies and galaxy-galaxy interaction. However, it is difficult to firmly conclude that the majority of our 15 m galaxies are activated via galaxy-galaxy interactions or mergers. The seeing size of our ground-based optical image is 0.′′7 and it is not sufficient to determine the morphology for all of our 15 m galaxies and to find any interacting signatures. We should also admit that spectroscopic confirmation of membership of the phot- members especially for the 15 m members is crucial to draw any firm conclusions. Since our study reaches far out from the cluster core, it would have more contaminations than other studies limited in the cluster cores. The surface number density of the contaminant galaxies with mag is estimated to be arcmin-2, using the galaxies in the control fields defined in our Suprime-Cam field (see Fig. 3 of Koyama et al. 2007). A rough estimate shows that, among all the phot- members with mag, 10% and 25% galaxies can be contaminant galaxies in the cluster region (i.e. high-density region) and the group region (i.e. medium-density region), respectively (see Fig. 4 of Koyama et al. 2007 for the definitions of the cluster and the groups). Furthermore, we should keep in mind that the properties and/or fraction of the MIR galaxies may be different from cluster to cluster, as suggested in Geach et al. (2006), even if we investigate clusters nearly at the same redshifts. Wide-field MIR observations on a larger sample of distant clusters is clearly required to obtain more general picture of the environmental effects on galaxy evolution.
6 Summary and Conclusions
We have performed a wide-field and multi-wavelength optical and infrared study of the distant galaxy cluster RXJ1716.4+6708 (RXJ1716) at . A unique wide field coverage both in optical and infrared has enabled us to classify galaxies into three environmental bins, namely, high-density regions (cluster core), medium-density regions (cluster outskirts, groups, filament), and low-density regions (field), and has thus allowed us to investigate galaxy properties as a function of environment along the structures in and around the distant cluster.
We find many of the 15 m cluster members show intermediate optical colours between the red sequence and the blue cloud. This may indicate that these 15 m cluster members are actively star-forming galaxies but attenuated by dust hence showing intermediate optical colours, although relatively fewer detection at 15 m of blue galaxies may be partly because they tend to be optically faint.
We quantified the environment around the cluster using the local projected number density of cluster member galaxies, and confirmed that the optical colour distribution starts to dramatically change at the “medium” density environment that corresponds to groups and/or filaments. We showed that the 15 m members are very rare in the high-density cluster centre. This is probably due to the low star forming activity in such regions. However, interestingly, the fraction of the 15 m-detected cluster members in the medium-density environment is as high as in the low-density fields, despite the fact that optical colours of galaxies start to dramatically change from blue to red in the medium-density environment. Although the statistic is not very good, the fraction is slightly higher in the medium-density environments even compared with the low-density fields.
We also find that dusty red galaxies (optically red 15 m cluster members) and the galaxies with high specific star formation rates (red in 15 m colour) are both concentrated in the medium-density environment. These results may suggest that the star formation activity in galaxies is once enhanced by some physical processes which are effective in group/filament environment (e.g. galaxy-galaxy interaction), before their star forming activity is eventually truncated and they move on to the red sequence.
We stress that all these new findings are based on the widest field MIR observation of a cluster so far. There is no other study that covers such a wide field around clusters in MIR at . Since our study is a case study for just one cluster at , we are desperately in need for a larger sample of distant clusters viewed in the infrared regime and at the same time covering a wide field of view so that we can witness the galaxy truncation in action in the in-fall regions of distant clusters along the filaments. This is essential in order to confirm this interesting trend and to obtain a general view of galaxy evolution.
Acknowledgement
We thank the anonymous referee for the careful reading of the paper and for the helpful suggestions, which improved the paper. We thank Dr. Tomotsugu Goto and Dr. Kimiaki Kawara for their helpful suggestions and discussions. We are also grateful to Dr. Takashi Onaka for advice on the AKARI data treatment. This work was financially supported in part by a Grant-in-Aid for the Scientific Research (Nos. 15740126; 18684004) by the Japanese Ministry of Education, Culture, Sports and Science. The infrared data that we used in this study is based on observations with AKARI, a JAXA project with the participation with ESA. The optical data is collected at the Subaru Telescope, which is operated by the National Astronomical Observatory of Japan. Y.K. and T.T. acknowledges support from the Japan Society for the Promotion of Science (JSPS) through JSPS research fellowships for Young Scientists. M.I. was supported by Creative Research Initiatives grant R16-2008-015-01000-0 of MOST/KOSEF. H.M.L was supported by the Space Science Development Program from KASI.
References
- Abraham et al. (1996) Abraham R. G., et al., 1996, ApJ, 471, 694
- Bai et al. (2007) Bai L., et al., 2007, ApJ, 664, 181
- Balogh et al. (1999) Balogh M. L., Morris S. L., Yee H. K. C., Carlberg R. G., Ellingson E., 1999, ApJ, 527, 54
- Bertin & Arnouts (1996) Bertin E., Arnouts S., 1996, A&AS, 117, 393
- Blakeslee et al. (2006) Blakeslee J. P., et al., 2006, ApJ, 644, 30
- Boselli & Gavazzi (2006) Boselli A., Gavazzi G., 2006, PASP, 118, 517
- Butcher & Oemler (1984) Butcher H., Oemler A., Jr., 1984, ApJ, 285, 426
- Byrd & Valtonen (1990) Byrd G., Valtonen M., 1990, ApJ, 350, 89
- Chary & Elbaz (2001) Chary R., Elbaz D., 2001, ApJ, 556, 562
- Clowe et al. (1998) Clowe D., Luppino G. A., Kaiser N., Henry J. P., Gioia I. M., 1998, ApJ, 497, L61
- Coia et al. (2005) Coia D., et al., 2005, A&A, 431, 433
- Cooper et al. (2007) Cooper M. C., et al., 2007, MNRAS, 1119
- Davoodi et al. (2006) Davoodi P., et al., 2006, MNRAS, 371, 1113
- Dressler (1980) Dressler A., 1980, ApJ, 236, 351
- Dressler et al. (1997) Dressler A., et al., 1997, ApJ, 490, 577
- Dressler et al. (1999) Dressler A., Smail I., Poggianti B. M., Butcher H., Couch W. J., Ellis R. S., Oemler A. J., 1999, ApJS, 122, 51
- Duc et al. (2002) Duc P.-A., et al., 2002, A&A, 382, 60
- Elbaz et al. (2007) Elbaz D., et al., 2007, A&A, 468, 33
- Ettori et al. (2004) Ettori S., Tozzi P., Borgani S., Rosati P., 2004, A&A, 417, 13
- Fadda et al. (2008) Fadda D., Biviano A., Marleau F. R., Storrie-Lombardi L. J., Durret F., 2008, ApJ, 672, L9
- Geach et al. (2006) Geach J. E., et al., 2006, ApJ, 649, 661
- Gioia et al. (1999) Gioia I. M., Henry J. P., Mullis C. R., Ebeling H., Wolter A., 1999, AJ, 117, 2608
- Gómez et al. (2003) Gómez P. L., et al., 2003, ApJ, 584, 210
- Goto et al. (2003d) Goto T., Yamauchi C., Fujita Y., Okamura S., Sekiguchi M., Smail I., Bernardi M., Gomez P. L., 2003d, MNRAS, 346, 601
- Goto et al. (2003b) Goto T., et al., 2003b, PASJ, 55, 757
- Goto et al. (2003a) Goto T., et al., 2003a, PASJ, 55, 739
- Gunn & Gott (1972) Gunn J. E., Gott J. R. I., 1972, ApJ, 176, 1
- Haines, Gargiulo, & Merluzzi (2008) Haines C. P., Gargiulo A., Merluzzi P., 2008, MNRAS, 385, 1201
- Henry et al. (1997) Henry J. P., et al., 1997, AJ, 114, 1293
- Hopkins et al. (2008) Hopkins P. F., Hernquist L., Cox T. J., Kereš D., 2008, ApJS, 175, 356
- Jeltema et al. (2005) Jeltema T. E., Canizares C. R., Bautz M. W., Buote D. A., 2005, ApJ, 624, 606
- Kennicutt (1998) Kennicutt R. C., Jr., 1998, ARA&A, 36, 189
- Kessler et al. (1996) Kessler M. F., et al., 1996, A&A, 315, L27
- Kim et al. (2007) Kim M., et al., 2007, ApJS, 169, 401
- Kodama, Bell, & Bower (1999) Kodama T., Bell E. F., Bower R. G., 1999, MNRAS, 302, 152
- Kodama et al. (2001) Kodama T., Smail I., Nakata F., Okamura S., Bower R. G., 2001, ApJ, 562, L9
- Kodama et al. (2005) Kodama T., et al., 2005, PASJ, 57, 309
- Koyama et al. (2007) Koyama Y., Kodama T., Tanaka M., Shimasaku K., Okamura S., 2007, MNRAS, 382, 1719
- Lagache et al. (2004) Lagache G., et al., 2004, ApJS, 154, 112
- Larson, Tinsley, & Caldwell (1980) Larson R. B., Tinsley B. M., Caldwell C. N., 1980, ApJ, 237, 692
- Le Floc’h et al. (2005) Le Floc’h E., et al., 2005, ApJ, 632, 169
- Lonsdale et al. (2003) Lonsdale C. J., et al., 2003, PASP, 115, 897
- Lorente et al. (2007) Lorente R., Onaka T., Ita Y., Ohyama Y., & Pearson P. 2007, AKARI IRC Data User Manual, ver. 1.3
- Marcillac et al. (2008) Marcillac D., et al., 2008, ApJ, 675, 1156
- Marcillac et al. (2007) Marcillac D., Rigby J. R., Rieke G. H., Kelly D. M., 2007, ApJ, 654, 825
- Martini et al. (2002) Martini P., Kelson D. D., Mulchaey J. S., Trager S. C., 2002, ApJ, 576, L109
- Metcalfe, Fadda, & Biviano (2005) Metcalfe L., Fadda D., Biviano A., 2005, SSRv, 119, 425
- Miyazaki et al. (2002) Miyazaki S., et al., 2002, PASJ, 54, 833
- Moore et al. (1996) Moore B., Katz N., Lake G., Dressler A., Oemler A., 1996, Natur, 379, 613
- Murakami et al. (2007) Murakami H., et al., 2007, PASJ, 59, 369
- Nakata et al. (2005) Nakata F., et al., 2005, MNRAS, 357, 1357
- Onaka et al. (2007) Onaka T., et al., 2007, PASJ, 59, 401
- Ouchi et al. (2005) Ouchi M., et al., 2005, ApJ, 620, L1
- Pimbblet et al. (2002) Pimbblet K. A., Smail I., Kodama T., Couch W. J., Edge A. C., Zabludoff A. I., O’Hely E., 2002, MNRAS, 331, 333
- Poggianti et al. (2008) Poggianti B. M., et al., 2008, arXiv, 805, arXiv:0805.1145
- Porter et al. (2008) Porter S. C., Raychaudhury S., Pimbblet K. A., Drinkwater M. J., 2008, arXiv, 804, arXiv:0804.4177
- Porter & Raychaudhury (2007) Porter S. C., Raychaudhury S., 2007, MNRAS, 375, 1409
- Postman et al. (2005) Postman M., et al., 2005, ApJ, 623, 721
- Postman & Geller (1984) Postman M., Geller M. J., 1984, ApJ, 281, 95
- Puget & Leger (1989) Puget J. L., Leger A., 1989, ARA&A, 27, 161
- Rieke et al. (2004) Rieke G. H., et al., 2004, ApJS, 154, 25
- Saintonge, Tran, & Holden (2008) Saintonge A., Tran K.-V. H., Holden B. P., 2008, arXiv, 806, arXiv:0806.2157
- Sanders & Mirabel (1996) Sanders D. B., Mirabel I. F., 1996, ARA&A, 34, 749
- Shimasaku et al. (2003) Shimasaku K., et al., 2003, ApJ, 586, L111
- Takeuchi et al. (2005) Takeuchi T. T., Buat V., Iglesias-Páramo J., Boselli A., Burgarella D., 2005, A&A, 432, 423
- Tanaka et al. (2005) Tanaka M., Kodama T., Arimoto N., Okamura S., Umetsu K., Shimasaku K., Tanaka I., Yamada T., 2005, MNRAS, 362, 268
- Tanaka et al. (2006) Tanaka M., Kodama T., Arimoto N., Tanaka I., 2006, MNRAS, 365, 1392
- Tanaka et al. (2007) Tanaka M., Hoshi T., Kodama T., Kashikawa N., 2007, MNRAS, 379, 1546
- Tanaka et al. (2007) Tanaka M., Kodama T., Kajisawa M., Bower R., Demarco R., Finoguenov A., Lidman C., Rosati P., 2007, MNRAS, 377, 1206
- Toomre & Toomre (1972) Toomre A., Toomre J., 1972, ApJ, 178, 623
- Tozzi et al. (2003) Tozzi P., Rosati P., Ettori S., Borgani S., Mainieri V., Norman C., 2003, ApJ, 593, 705
- Vikhlinin et al. (2002) Vikhlinin A., VanSpeybroeck L., Markevitch M., Forman W. R., Grego L., 2002, ApJ, 578, L107
- Wada et al. (2007) Wada T., et al., 2007, PASJ, 708, 59, S515
- Webb et al. (2006) Webb T. M. A., et al., 2006, ApJ, 636, L17
- Wolf, Meisenheimer, Röser (2001) Wolf C., Meisenheimer K., Röser H.-J., 2001, A&A, 365, 660
- Wolf, Gray, & Meisenheimer (2005) Wolf C., Gray M. E., Meisenheimer K., 2005, A&A, 443, 435
- York et al. (2000) York D. G., et al., 2000, AJ, 120, 1579