A sharp look at the gravitationally lensed quasar SDSS J0806+2006 with laser guide star adaptive optics at the VLT††thanks: Based on observations collected at the European Southern Observatory, Paranal, Chile, ESO Program 079.A-0588(A).
We present the first VLT near-IR observations of a gravitationally lensed quasar, using adaptive optics and laser guide star. These observations can be considered as a test bench for future systematic observations of lensed quasars with adaptive optics, even when bright natural guide stars are not available in the nearby field. With only 14 minutes of observing time, we derived very accurate astrometry of the quasar images and of the lensing galaxy, with 0.05″ spatial resolution, comparable to the Hubble Space Telescope (HST). In combination with deep VLT optical spectra of the quasar images, we use our adaptive optics images to constrain simple models for the mass distribution of the lensing galaxy. The latter is almost circular and does not need any strong external shear to fit the data. The time delay predicted for SDSS J0806+2006, assuming a singular isothermal ellipsoid model and the concordance cosmology, is days. Our optical spectra indicate a flux ratio between the quasar images of A/B=1.3 in the continuum and A/B=2.2 in both the Mg ii and in the C iii] broad emission lines. This suggests that microlensing affects the continuum emission. However, the constant ratio between the two emission lines indicates that the broad emission line region is not microlensed. Finally, we see no evidence of reddening by dust in the lensing galaxy.
Key Words.:
Gravitational lensing: quasar – quasars: individual (SDSS J0806+2006).1 Introduction
Strong gravitational lensing of distant quasars is a useful tool both for cosmology and for studying luminous and dark matter in massive galaxies. For a fixed cosmology, the total projected distribution of matter in the galaxy(ies) responsible for the lensing effect can be reconstructed from (i) the configuration of the lensed quasar images on the plane of the sky, (ii) the observed magnification ratio between the quasar images, (iii) measurement of the time delay, and (iv) detailed structures in the lensed host galaxy of the quasar forming arcs and counter-arcs (e.g. Refsdal REFS64 (1964), Claeskens & Surdej CLA02 (2002), Kochanek et al. KOC06 (2006)). Finally, the magnification ratios between the quasar images can significantly deviate from the predictions by smooth mass models if the lensing galaxy contains small-scale substructures with M⊙ (e.g., Mao & Schneider MAO98 (1998), Metcalf MET05 (2005)). Strong gravitational lensing of quasars is therefore a sensitive indirect way of detecting small satellites of lensing galaxies.
High-resolution imaging of lensed quasars is crucial for constraining mass models for the lensing galaxy, determining its luminous mass distribution, and identifying the optical counterpart of any mass substructure (Schechter & Moore SCH93 (1993), Koopmans & Treu KOO02 (2002), McKean et al. MCK07 (2007)). The Hubble Space Telescope (HST) has provided the community with a large sample of exquisite high-resolution images of gravitational lenses with the CASTLES survey (CfA-Arizona Space Telescope LEns Survey; Muñoz et al. MUN98 (1998)) and played a crucial role in the study of lensed quasars (Claeskens et al. CLA07 (2007) for a review). Ground-based adaptive optics (AO) imaging now allows us to obtain high spatial resolution data from the ground. Although both approaches are complementary in depth and field of view, the AO imaging data collected so far of lensed quasars are still very scarce. With Gemini-North, Courbin et al. (COU02 (2002)) obtained the first AO images of a gravitational lens, for the Einstein ring PKS 1830-21. These observations were followed up at the VLT in AO in order to confirm a double lensing galaxy (Meylan et al. MEY05 (2005)). More recently, Auger et al. (AUG08 (2008)) used AO to observe the doubly imaged quasar SBS 1520+53. These two targets are easy for AO, as they are located a few arcseconds away from a bright natural guide star. Systematic AO imaging of all other lensed quasars requires laser guide star (LGS). McKean et al. (MCK07 (2007)) obtained the first AO/LGS images at the Keck of a lensed quasar to search for substructures in the lensing galaxy.
In the present paper, we describe the first AO/LGS images of a gravitational lens at the VLT: the doubly imaged quasar SDSS J0806+2006, at . This quasar has been found to be gravitationally lensed from a systematic search for strong lens systems in the Sloan Digital Sky Survey (Inada et al. INA06 (2006)). The angular separation between the two quasar images is and the early-type lensing galaxy has been found to be at from deep VLT optical spectroscopy (Eigenbrod et al. EIG07 (2007)). Our new VLT AO/LGS images, further improved with image deconvolution, allow us to derive milli-arcsecond astrometry of the quasar images, as well as improved models for the lensing galaxy. We see these observations as a test bench for systematic VLT AO imaging of gravitationally lensed quasars.

2 Observations and reduction
2.1 VLT adaptive optics observations
Our AO/LGS -band images of SDSS J0806+2006 were obtained in service mode at the ESO Paranal Observatory with the near-infrared camera CONICA (the COude Near-Infrared CAmera), which is mounted on the AO system NAOS (Nasmyth Adaptive Optics System), installed at the Nasmyth B focus of the VLT-UT4. This instrument uses an LGS Facility, in operation at Paranal Observatory since April 2007. The LGS is an artificial source replacing the natural guide star as a reference object for AO image correction. A natural guide star is still required to correct for the tip-tilt motions, which are not sensed by the LGS, but the natural guide star can be much fainter () than without the LGS. In addition, the natural guide star can be as far as 55 away from the science target. The S27 CONICA camera was used, with a pixel size of 27.0530.019 mas, resulting in a field of view of 2828″(Amico et al. AMI08 (2008)). A set of 7 exposures of 120 s each were obtained in the band on 2008 January 7, at a mean airmass of 1.4, under seeing conditions in the range 0.65″-1.0″. We used the star U0975_07317639 (V=14.2), located 44.6″ from SDSS J0806+2006, as a reference tip-tilt star. These relatively poor observing conditions led to a Strehl ratio on-target of only 6%, with a final full width half at maximum spatial resolution of 0.16 on the coadded image. The point spread function (PSF) varied from frame to frame, with an FWHM varying from 0.13″ to 0.19″ and an ellipticity varying between 0.0 and 0.2.
Standard near-IR reduction procedures were applied to subtract the dark and to flat-field the images using a normalized twilight flat field. The sky subtraction and the co-addition of the reduced dithered frames were performed using the xdimsum IRAF111IRAF is distributed by the National Optical Astronomy Observatories, which are operated by the Association of Universities for Research in Astronomy, Inc., under cooperative agreement with the National Science Foundation. package. The sky frames were computed using the 3 images taken nearest in time to the frame considered. The standard star S301-D, observed on the same night as SDSS J0806+2006, was reduced in a similar way to the science data. From aperture photometry, we derived a zeropoint mag/s. In this calculation we adopted a Paranal extinction coefficient of 0.06 mag per unit airmass in the band. The large uncertainty on the zeropoint reflects the inaccuracy of absolute photometry with AO systems due to seeing variations, PSF halo variations and angular anisoplanatism (e.g. Esslinger & Edmunds ESS98 (1998)). The error on the relative photometry between images A and B of SDSS J0806+2006 should be less than 0.05 mag (Esslinger & Edmunds ESS98 (1998)) due to the small PSF variation over the 2″2″field covered by the lens system.
2.2 VLT spectroscopy
A set of 4 low-resolution spectra of SDSS J0806+2006 is available, obtained with the FORS1 instrument mounted on the ESO-VLT at the Paranal Observatory (Chile). Using these data, taken on 2006 April 22, Eigenbrod et al. (EIG07 (2007)) measured the redshift of the lensing galaxy. In the following, we analyze the spectra again in order to infer the broad emission line flux ratio of the quasar images and to estimate the dust content of the lensing galaxy. The details of the observations and reduction of the spectra can be found in Eigenbrod et al. (2006a ; 2006b ; EIG07 (2007)).
All of the observations were carried out using multi-object spectroscopy (MOS). The object slit encompasses images A-B and the lensing galaxy. The other slits were placed on 4 stars, that were used as flux calibrators and as reference PSFs in order to deblend the quasar images. The wavelength range 4450 8650 Å was covered with a resolving power R = at the central wavelength.
The final combined 2D spectrum of SDSS J0806+2006 was spatially deconvolved using the spectral version of the MCS deconvolution algorithm (Courbin et al. COU00 (2000); Sect. 3.2), leading to individual 1D quasar spectra, free of any mutual contamination. These spectra were eventually corrected from the spectrograph response curve and from differential atmospheric extinction using tabulated Paranal extinction curves.
3 Analysis
3.1 Imaging: deconvolution and profile fitting
| Model | d.o.f. | PA | (″) | ||
|---|---|---|---|---|---|
| GdV | 1.06 | 16372 | 78.2 6.8 | 0.88 0.02 | 8.90.3 |
| Exp | 1.03 | 16372 | 83.9 6.8 | 0.91 0.01 | 7.00.1 |
| ID | (″) | (″) | -Magnitude |
|---|---|---|---|
| A | 17.19 0.14 | ||
| B | 18.00 0.14 | ||
| G | 17.56 0.18 |
We analyzed our AO/LGS images in two ways. First, we applied the MCS image deconvolution algorithm (Magain et al. magain (1998)). As no star was available in the immediate vicinity of SDSS J0806+2006, we built the PSF on the relatively isolated quasar image A (Fig. 1). The resolution in the final deconvolved image was chosen to be 0.055″ FWHM. The frame was decomposed into an analytical channel containing the point sources and a numerical channel containing an image of the lensing galaxy. The result of the deconvolution technique is shown in the right panel of Fig. 1. We measured the position of the lensing galaxy using Gaussian fitting on the numerical channel of the deconvolution. The astrometry and photometry of the quasar images were returned as analytical parameters of the point-source channel of the deconvolution.
Second, we also analyzed the images by modeling the quasar images and the galaxy light distributions using GALFIT (v2.0.3c; Peng et al. PEN02 (2002)). For this purpose we used quasar image A as our PSF model and simultaneously fit the 2 quasar images and an analytical galaxy profile, convolved with the PSF. The parameters of the lensing galaxy are displayed in Table 1 for de Vaucouleurs (GdV) and exponential-disk (Exp) light profiles. Both models lead to equally good fits to the data, given our signal-to-noise, with a slightly better formal fit for the exponential profile. However, as the spectrum of the lensing galaxy is typical of an early type galaxy (Eigenbrod et al. EIG07 (2007)), we use in the following the morphological properties derived from the de Vaucouleurs model. In Table 1, we give the reduced , the number of degrees of freedom (d.o.f.), the galaxy PA (east of north), the axis ratio , and the effective radius . The error bars associated to the galaxy parameters are formal error bars of the fit and do not include systematic errors associated with the choice of surface brightness profile. These systematic errors are likely to be dominant for the effective radius, , and axis ratio, , as well as for the magnitude of the galaxy
The deconvolution procedure and the GALFIT minimization lead to photometric measurements compatible within 0.05 mag and astrometric measurements compatible within 0.005″. We summarize the astrometry and photometry of SDSS J0806+2006 in Table 2. The photometry is in the Vega system. The astrometry of the point sources is given by the deconvolution process, while the position of the lensing galaxy is given by GALFIT. Measuring the position of the numerical lensing galaxy of the MCS deconvolution gives consistent results. The error bars quoted in Table 2 are error bars including the estimated systematic errors.
We find that the separation between the quasar images is 0.1″ more than the one presented in Inada et al. (INA06 (2006)), incompatible with their quoted error bars. An overestimate by about 6% of the CONICA pixel size would allow both data measurements to be reconciled. However, the CONICA pixel size has been recently confirmed by new measurements from Sicardy et al. (private communication) and by our measurements of the relative astrometry of 4 stars in the field of SDSS J0806+2006.
| Model | (″) | or | or | ( days) | ||||
|---|---|---|---|---|---|---|---|---|
| SIS+ | 0.74 | 0.017 | 56.8 | 36.3 | 0.351 | 0.342 | 0.841 | 0.833 |
| SIE | 0.76 | 0.042 | 76.6 | 36.2 | 0.356 | 0.356 | 0.850 | 0.850 |
3.2 Spectroscopy
The original deconvolution of the 2D spectrum of SDSS J0806+2006 presented by Eigenbrod et al. (EIG07 (2007)) is aimed at measuring the redshift of the lensing galaxy. We optimize here the deconvolution in order to improve the signal-to-noise ratio in the spectra of the quasar images and minimize the contamination of the point-like sources by the extended lensing galaxy.
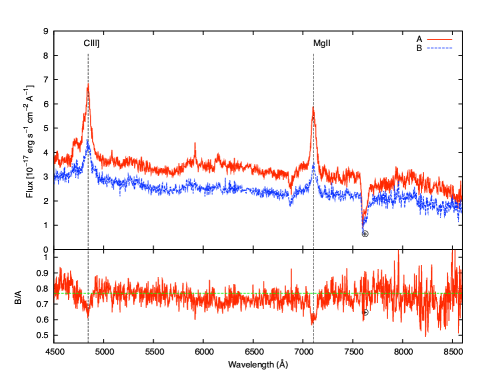
The spectra of the quasar images are shown in Fig. 2. Although the conditions were photometric during the observations, the spectra are not corrected from the flux loss due to the finite slit width. Still, the relative fluxes are correct since the slit clipping is the same for the two quasar images and since FORS1 uses an atmospheric refraction corrector.
The spectral ratio between the quasar images provides a good diagnostic of the presence of differential microlensing and differential extinction (e.g. Sluse et al. SLU07 (2007)). The imprint of quasar broad emission lines (BEL) is clearly visible in (Fig. 2), which is otherwise flat over the observed wavelength range. This is a clear signature of differential microlensing between the continuum emission region and the broad emission line region. Indeed, the Einstein radius of a microlens located in the lensing galaxy is about 0.0012 pc (projected in the source plane). Consequently, the continuum emission region, with a size pc , is more likely microlensed than the much larger broad emission line region. The flux ratio in the continuum is found to be , while the ratio in the Mg ii and C iii] is found to be . Interestingly, the BEL measurement also agrees with the flux ratio measured in the band, i.e., . This is consistent with the need for the band continuum emission to arise from a larger region than the optical continuum emission. Like Inada et al. (INA06 (2006)), we do not detect any significant chromatic change of in our spectra. This indicates that differential extinction between the quasar lensed images is small. Although microlensing could induce chromatic variations in the quasar flux ratios (Wambsganss & Paczyǹski WAM91 (1991)), the absence of such changes in microlensed quasars is not uncommon.
Finally, there is an apparent change in the flux ratio between April 2005 and April 2006. Inada et al. (INA06 (2006)) report in the continuum spectral ratio and in the optical images, while we measure . This is compatible with an increase of 10% in the micro-magnification between April 2005 and April 2006. Systematic errors in the spectral extraction and in the image flux measurements, along with the combined effects of intrinsic variability and a time delay might also explain the observed difference.
4 Lens Modeling
Due to the mismatch between the astrometry exposed in Table 2 and the one in the discovery paper (Inada et al. INA06 (2006)), we present new mass models of the lensing galaxy. Two standard mass models are used: a singular isothermal sphere with an external shear (SIS+) model and a singular isothermal ellipsoid (SIE) model. Both models have eight parameters: the Einstein radius , the shear or ellipticity and their respective position angles ( or ), the position of the lens galaxy, and the position and flux of the source quasar. We have 8 nominal constraints (the positions of A, B, and G, the flux of A and B). The PA of the galaxy light distribution can also be used to constrain the SIE mass model. Indeed, statistical studies find correlations between the position angles but not between the axis ratios of the visible and total mass distributions (Keeton et al. KEE97 (1997), Ferreras et al. FER08 (2008)). In conclusion, the SIS+ model has 0 d.o.f., while the SIE model has 1 d.o.f. We used the quasar and galaxy positions reported in Table 2 and the flux ratio 0.455 0.050 measured in the broad emission lines. We chose this flux ratio because it is less affected by microlensing than the continuum flux ratio.
We fit the data using LENSMODEL (v1.99g) (Keeton KEE01 (2001)). The results are summarized in Table 3. In addition to the model parameters, we give the local convergence and shear at the location of the lensed images as derived from the magnification tensor. The SIS+ model fits the data perfectly, as expected (d.o.f.= 0). The shear is found to be very small (0.017). The reduced for the SIE model is . This model shows that there is excellent agreement between the PA of the light and of the mass distributions. These results differ significantly from those presented in Inada et al. (INA06 (2006)). The origin of this discrepancy is the significantly different relative astrometry of SDSS J0806+2006 obtained with our AO imaging.
5 Conclusions
We obtained the first VLT images of a gravitationally lensed quasar using AO and LGS. Using image deconvolution we derived accurate astrometry of the quasar images and of the lensing galaxy. This astrometry is significantly different from the one in Inada et al. (INA06 (2006)) and is not due to a systematic error in the pixel size of the instrument used.
We find that a simple isothermal mass model can account for the new astrometry, with no need of strong external shear. The predicted time delay for this model, days, is well-suited to an accurate measurement using photometric light curves (see simulations by Eigenbrod et al. EIG05 (2005)).
Our VLT optical spectra show that SDSS J0806+2006 is affected neither by chromatic microlensing nor by dust extinction. The continuum flux ratio based on these spectra agrees within 10% with the one derived by Inada et al. one year before, suggesting low-amplitude microlensing-induced variations. SDSS J0806+2006 is therefore a clean lens system to use either for determining of or for the study of the mass distribution in the lensing galaxy, based on a time-delay measurement.
The accuracy of the relative positions of the lensed images derived from our observations of SDSS J0806+2006 is similar to the typical accuracy derived from the HST data of other lensed quasars (e.g. Impey et al. IMP98 (1998), Claeskens et al. CLA06 (2006)). This demonstrates that ground-based AO imaging with the help of LGS can be fully competitive with HST observations in the near-IR. About 90% of the lensed quasars observable with the VLT are either bright enough to be used as a tip-tilt reference or have potential tip-tilt stars with V 17 within a 55″radius. This is promising for future systematic observations of gravitational lenses with adaptative optics and laser guide star.
Acknowledgements.
We thank C. Lidman, N. Ageorges, P. Amico and L. Tacconi-Garman for extensive discussions concerning CONICA pixel size and use of the LGS facility. We also thank B. Sicardy for providing ESO with the new CONICA pixel size prior to publication. We are indebted to the anonymous referee for the valuable comments on the first version of this letter. This work is partly supported by the Swiss National Science Foundation (SNSF).References
- (1) Amico, P., Lidman, C., Pompei, E. 2008, VLT NaCo user’s Manual v83.3, Doc. No. VLT-MAN-ESO-14200-2761
- (2) Auger, M. W., Fassnacht, C. D., Wong, K. C. et al., 2008, ApJ, 673, 778
- (3) Avila G., Rupprecht, G., Beckers, J. M. 1997, SPIE, 2871, 1135
- (4) Claeskens, J.-F., Sluse, D., Surdej, J. 2007, Proceedings of the 41st ESLAB Symposium ”The Impact of HST on European Astronomy”, arXiv 0806.0567v1
- (5) Claeskens, J.-F., Sluse, D., Riaud, P., Surdej, J. 2006, A&A, 451, 865
- (6) Claeskens, J.F., Surdej, J. 2002 A&ARv, 10, 263
- (7) Courbin, F., Magain, P., Kirkove, M., & Sohy S. 2000, ApJ, 529, 1136
- (8) Courbin, F., Meylan, G., Kneib, J.-P., Lidman, C., 2002, ApJ, 575, 95
- (9) Eigenbrod, A., Courbin, F., Vuissoz, C., Meylan, G., Saha, P. et al. 2005, A&A, 436, 25
- (10) Eigenbrod, A., Courbin, F., Dye, S. et al. 2006, A&A, 451, 747
- (11) Eigenbrod, A., Courbin, F., Meylan, G., Vuissoz, C., Magain, P. 2006, A&A, 451, 759
- (12) Eigenbrod, A., Courbin, F., Meylan, G. 2007, A&A, 465, 51
- (13) Esslinger, O., Edmunds, M. G. 1998, A&AS, 129, 617
- (14) Ferreras, I., Saha, P., Burles, S. 2008, MNRAS, 383, 857
- (15) Inada, N., Oguri, M., Becker, R.H. et al. 2006, AJ, 131, 1934
- (16) Impey, C. D., Falco, E. E., Kochanek, C. S. et al. 1998, ApJ, 509, 551
- (17) Keeton C. R., Kochanek, C. S., Seljak, U. 1997, ApJ, 482, 604
- (18) Keeton C. R. astro-ph/0102341
- (19) Kochanek, C.S. in Gravitational lensing: strong, weak and micro; Saas-Fee Advanced Course 33. Edited by G. Meylan, P. Jetzer and P. North.
- (20) Koopmans, L. V. E., Treu, T. 2002, ApJ, 568, 5
- (21) Magain, P., Courbin, F., Sohy, S. 1998, ApJ, 494, 472
- (22) McKean, J.P., Koopmans, L.V.E., Flack, C.E., et al. 2007, MNRAS, 378, 109
- (23) Mao, S., Schneider, P., 1998, MNRAS, 295, 587
- (24) Metcalf, B., 2005, ApJ, 622, 72
- (25) Meylan, G., Courbin, F., Lidman, C., Kneib, J.-P., Tacconi-Garman, L. E., 2005, A&A, 438, L37
- (26) Muñoz, J. A., Falco, E. E., Kochanek, C. S. et al. Ap&SS, 263, 51
- (27) Peng, C. Y., Ho, L. C., Impey, C. D., Rix, H.-W. 2002, AJ, 124, 266
- (28) Refsdal, S., 1964, MNRAS, 128, 307
- (29) Schechter, P.L., Moore, C.B. 1993, AJ, 105, 1
- (30) Sluse, D., Claeskens, J.-F., Hutsemékers, D., et al. 2007, A&A, 468, 885
- (31) Wambsganss, J., Paczyński B. 1991, AJ, 102, 864