Mass as a Calibration of the Jet Energy Scale at ATLAS
Abstract
Top-antitop pairs will be copiously produced at the LHC, at a rate of roughly one per second at an instantaneous luminosity of cm-2s-1. These events have low background and produce large numbers of jets via the hadronic decay of the W’s which may be used to calibrate the jet energy scale and resolution with experimental data and simulations.
I JET RECONSTRUCTION AT ATLAS
The ATLAS calorimeter atlas is non-compensating. Its calibration may be performed either globally or locally. Global calibration is a top-down technique where hadronic objects from specific physics processes are reconstructed relative to a fixed (global) electromagnetic scale. Cells may be combined along the - direction to form cell towers, out of which tower jets may be reconstructed after applying cell and calorimeter layer weights based on the deposited jet energy density. The local calibration method is a bottom-up approach which starts with the response of cells and cell clusters, to which sets of weights based on the ratio of the deposited energy to the signal reconstructed on the electromagnetic energy scale, as determined with simulations, are applied. From such calibrated topological clusters we reconstruct topological jets.
In what follows we present a simulation study designed to assess the ATLAS calorimeter performance through the jet energy scale (JES) determination from the top-antitop pair simulation. The work on the universal JES definition is still in progress. For the study presented here we use two simple formulas:
| (1) |
The first of the two equations relates the energy of the true (particle) jet to that of the measured (reconstructed) jet . The scale factor depends on energy, pseudorapidity (), jet resolution () and instantaneous luminosity (). The second equation provides a transition from the true jet to the quark that gave rise to the jet. The true jet-parton scale factor depends on the parton energy, jet cone size and the pileup resulting from additional proton collisions in a bunch crossing, which is proportional to the instantaneous luminosity .
II JET ENERGY SCALE FROM THE TOP-ANTITOP SIGNAL
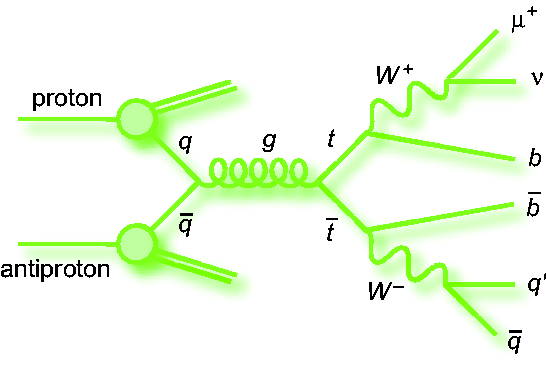
The top-antitop events considered here (Fig. 1, left) have been generated using MC@NLO mcatnlo and simulated with GEANT4 geant . Four types of reconstructed events with various jet settings were compared: the seeded cone jet algorithm cone-alg with parameter set at 0.4 and 0.7, and the algorithm kt-alg with 111In literature the parameter of the algorithm is also commonly referred to as . and 0.6. Among the various cuts applied, events with at least 4 jets with GeV/ were chosen, and pairs of non--tagged jets are selected as the jet candidates. Partons in this case are quarks from the decay. and may be extracted from Fig. 2. Using and , for cone jets with we find and .
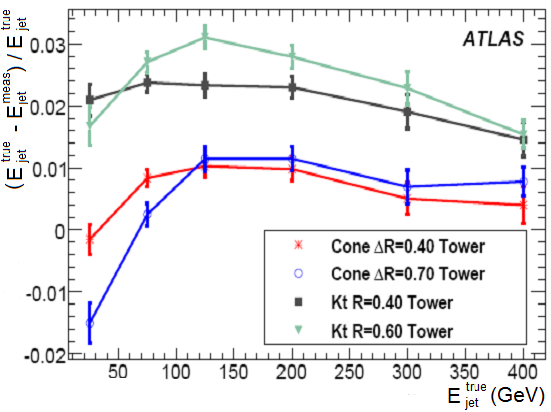
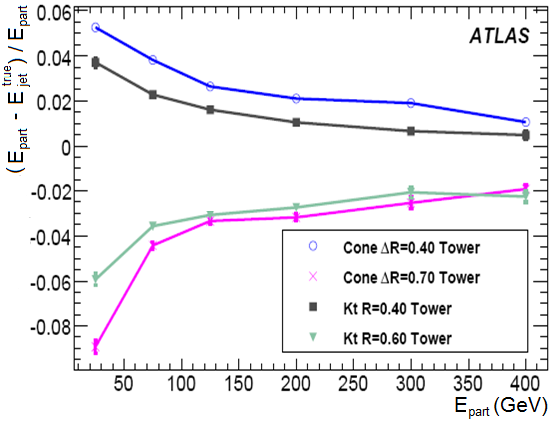
From Fig. 2 it is clear that the performance of the reconstructed jets relative to the true jets and true jets relative to the partons for the energy range shown is best for the seeded cone jet algorithm with and the algorithm with . We select the cone algorithm with as the default and use it on jets reconstructed from towers and from topological clusters (Fig. 3, left). We observe that, without pileup effects included, the resolution does not change with the reconstruction method and note that it varies between 8 and 19% for the energy range shown. In the same figure we also consider the effects of pileup, a consequence of the increased luminosity giving rise to the proportional number of multiple interactions. For a luminosity of cm-2s-1 the expected average number of these pileup events is 2.3. If pileup is included, topological clustering, which results in better noise suppression, yields better resolution, especially in the lower energy range. For example, for jet energies around 50 GeV, average energy resolution is decreased by only 2.5% relative to the pileup-free events, whereas the tower method yields 10% worse resolution. Cone algorithm with reconstructed from the topological clusters is thus the best choice for the jets in the top-antitop process.
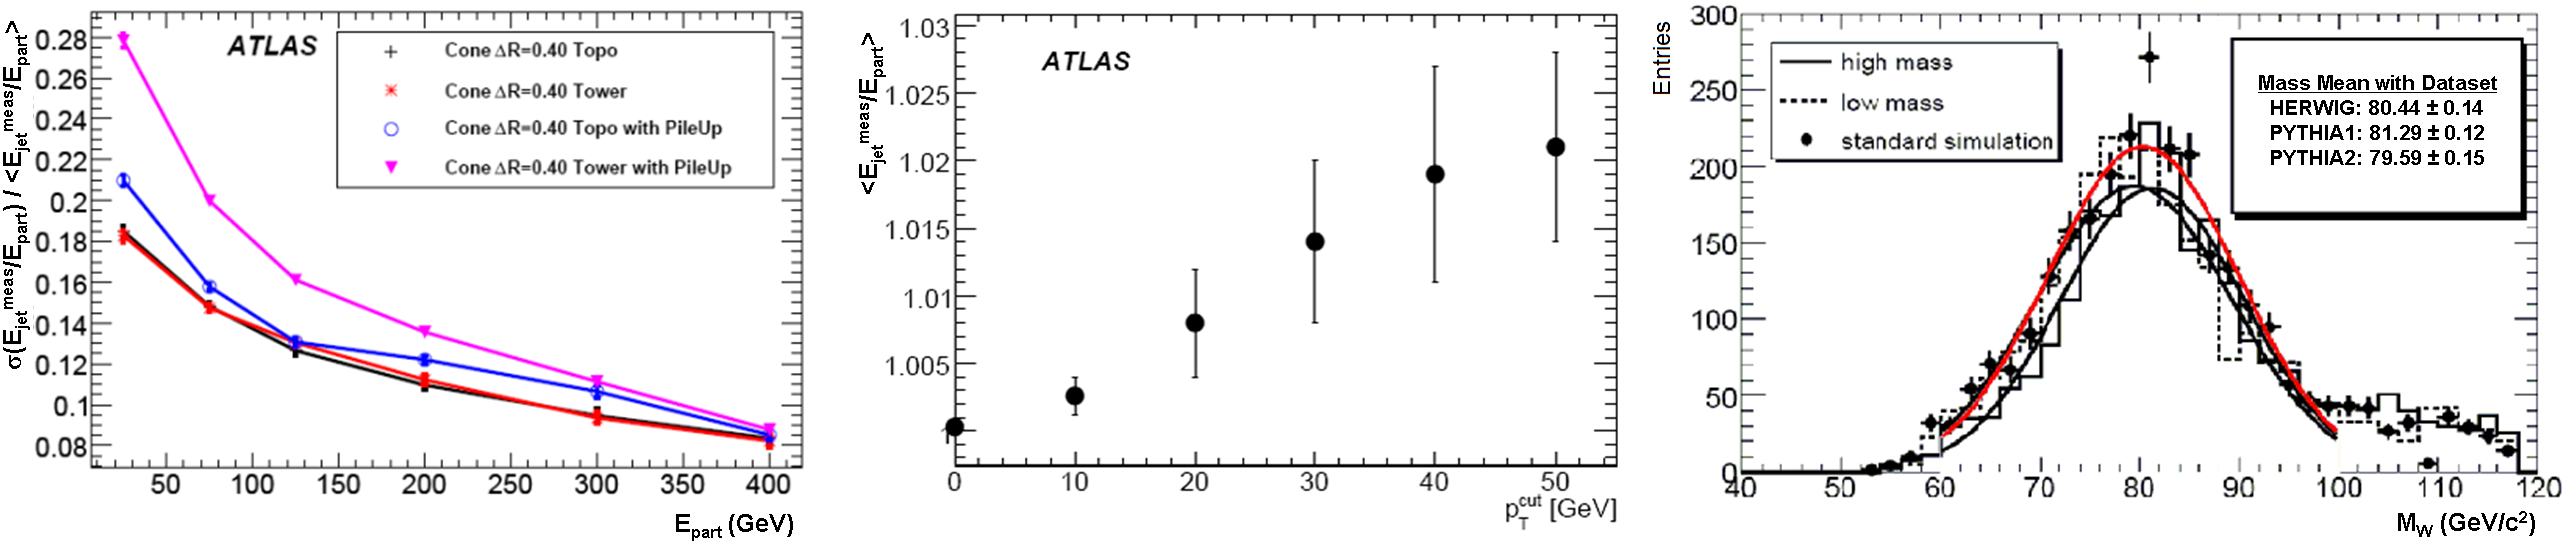
An applied cut on the measured jets biases the available momentum phase space toward higher values (hence, higher energy values) resulting in higher values of the jet energy scale (Fig. 3, center). The error bars correspond to uncertainties in if the resolution is varied by 20% (roughly the worst case scenario according to the results above). The 40 GeV/ cut used throughout this analysis thus results in a 2% uncertainty. For a 40 GeV/ cut the bias on the mass was found to be about GeV/.
In order to study the influence of initial and final-state radiation, three datasets with different showering settings were used: one set with MC@NLO + HERWIG mcatnlo herwig and two sets with AcerMC + PYTHIA acermc pythia (Fig. 3, right). The mean mass from the three measurements is slightly higher than the PDG value due to the cut bias. The spread between the maximum and the minimum values is about 1.7 GeV/.
III CONCLUSIONS
In this work we have determined the values for , the measured jet-to-true jet scale, and , the true jet-parton energy scale, for the top-antitop channel. Events were reconstructed using local calibration. The value of was found to be 1.032 for the top-antitop signal. We also considered jet resolution, shown to vary between 8 and 19%, and examined the effects of the cut, gluon radiation settings and pileup on the jet energy scale for the t-tbar signal.
Acknowledgements.
The author gratefully acknowledges James Proudfoot, Jerome Schwindling, David Miller, Ryszard Stroynowski, Jingbo Ye, Peter Loch and Bruce Mellado for their help in preparation of these proceedings.References
- (1) G. Aad et al. [ATLAS Collaboration], JINST 3, S08003 (2008)
- (2) S. Frixione and B. R. Webber, JHEP 0206, 029 (2002) [arXiv:hep-ph/0204244].
- (3) J. Allison et al., Comput. Phys. Commun. 178, 331 (2008).
- (4) G. C. Blazey et al., arXiv:hep-ex/0005012.
-
(5)
S. Catani, Y. L. Dokshitzer and B. R. Webber,
Phys. Lett. B 285, 291 (1992).
S. D. Ellis and D. E. Soper, Phys. Rev. D 48, 3160 (1993) [arXiv:hep-ph/9305266]. - (6) G. Corcella et al., JHEP 0101, 010 (2001) [arXiv:hep-ph/0011363].
- (7) B. P. Kersevan and E. Richter-Was, arXiv:hep-ph/0405247.
- (8) T. Sjostrand, P. Eden, C. Friberg, L. Lonnblad, G. Miu, S. Mrenna and E. Norrbin, Comput. Phys. Commun. 135, 238 (2001) [arXiv:hep-ph/0010017].