First 450 m dust continuum mapping of the massive star-forming region NGC 3576 with the P-ArTéMiS bolometer camera111This publication is based on data acquired with the Atacama Pathfinder Experiment (APEX) in ESO program 080.C-0722. APEX is a collaboration between the Max-Planck-Institut für Radioastronomie, the European Southern Observatory, and the Onsala Space Observatory. , 222Tables 1 & 2 and Figs. 2 & 3 are only available in electronic form.
Abstract
Context. The earliest phases of massive star formation are currently much debated.
Aims. In an effort to make progress, we took a census of Class 0-like protostellar dense cores in the NGC 3576 region, one of the nearest and most luminous embedded sites of high-mass star formation in the Galaxy.
Methods. We used the P-ArTéMiS bolometer camera on the APEX telescope to produce the first 450 m dust continuum map of the filamentary dense clump associated with NGC 3576.
Results. Combining our 450 m observations with existing data at other wavelengths, we have identified seven massive protostellar sources along the NGC 3576 filament and placed them in the – evolutionary diagram for protostars.
Conclusions. Comparison with theoretical evolutionary tracks suggests that these seven protostellar sources will evolve into massive stars with masses 15–50. Four sources are classified as candidate high-mass Class 0 objects, two sources as massive Class I objects, and one source appears to be at an intermediate stage.
Key Words.:
stars: formation – stars: circumstellar matter – ISM: clouds – ISM: structure – ISM: individual objects (NGC 3576) – submillimeter1 Introduction
The process of massive star formation remains poorly understood and is the subject of major ongoing debate (Zinnecker & Yorke 2007). From the observational perspective, there is a growing body of evidence to suggest that most, if not all, high-mass () stars form in a clustered environment ( de Wit et al. 2005). There is no widely accepted evolutionary scenario for high-mass star formation, although a tentative sequence of empirical phases has been identified: from infrared dark cloud cores, to hot cores, hypercompact to ultracompact, compact and classical HII regions. On the theoretical front, it is unclear whether high-mass stars form by direct cloud core collapse and subsequent accretion as a result of a scaled-up version of the process believed to be at work in low-mass protostars (McKee & Tan 2003), or by other processes such as competitive accretion and coalescence of intermediate-mass protostars in dense protoclusters (Bonnell et al. 2004).
Decisive progress in this field will require high-resolution kinematical and modeling studies of high-mass protostellar objects and their embedded, cluster-forming environments at (sub)millimeter wavelengths. While such comprehensive studies are becoming feasible in the intermediate-mass regime (cf. Peretto et al. 2006, 2007), they are virtually impossible in the high-mass regime due to the lack of angular resolution and mapping speed of current submillimeter facilities. A major step forward will be provided by the upcoming ALMA interferometer when it becomes fully operational around 2013. In order to prepare for future ALMA studies, it is important to identify a number of candidate massive protostars and embedded protoclusters in the southern hemisphere. While several SIMBA 1.2 mm continuum surveys are available (e.g. Hill et al. 2005, Beltrán et al. 2006), current searches for massive protostars in the southern sky lack both the angular resolution and submillimeter spectral coverage to provide an adequate characterization of the detected sources.
At a distance of 2.4 kpc (Persi et al. 1994), NGC 3576 (also known as RCW 57 and G291.27-0.70) is one of the most luminous giant HII regions in our Galaxy at optical, infrared, and radio wavelengths (e.g. De Pree et al. 1999). It is embedded at the center of a filamentary dense clump observed in both 1.2 mm dust continuum emission (Hill et al. 2005) and tracers of dense molecular gas such as NH3 (Purcell et al. 2008). A deeply embedded near-IR cluster of more than 130 young stellar objects (YSOs) is known to be associated with this region (Persi et al. 1994). In addition, two 6.7 GHz methanol masers and a total of nine 22 GHz water masers (Caswell 2004, Purcell et al. 2008) have been detected along the extent of the cluster-forming clump. The NGC 3576 region is therefore an excellent laboratory for studying the embedded phases of massive star formation. Due to its southern declination, NGC 3576 is a potential target of choice for future high-resolution investigations with ALMA.
Here, we report the results of the first 450 m dust continuum mapping observations of the NGC 3576 star-forming region, taken with the P-ArTéMiS bolometer camera on the APEX 12-m telescope. Section 2 describes the instrument and provides details about the observing run and data reduction. Section 3 presents our mapping results which are discussed in Section 4.
2 Observations and data reduction
Our 450 m observations of NGC 3576 were made in March 2007 and November 2007 with the P-ArTéMiS bolometer
array on the Atacama Pathfinder Experiment (APEX) telescope located at an altitude of 5100 m at Llano de Chajnantor in Chile.
P-ArTéMiS is a –pixel prototype of the ArTéMiS bolometer camera currently being built by CEA Saclay for APEX.
ArTéMiS333See http://www.apex-telescope.org/instruments/pi/artemis/
ArTéMiS stands for “ARchitectures de bolomètres pour des TElescopes à grand champ de vue dans le domaine sub-MIllimétrique au Sol” in French.
is a large-format camera with a total of 5760 bolometric pixels which will operate simultaneously at 450 m, 350 m,
and 200 m in the Cassegrain cabin of APEX (e.g. Talvard et al. 2006, 2008).
It uses the technology successfully developed by CEA for the PACS photometer instrument in the 60–210 m wavelength regime
on the Space Observatory (e.g. Simoens et al. 2004, Billot et al. 2006). Unlike classical bolometer arrays, such as LABOCA
on APEX, the PACS and (P-)ArTéMiS instruments do not use feedhorns to concentrate the incoming submillimeter radiation, but act
more like CCD cameras in the optical domain.
The advantage of such a filled-array design is that the entire field of
view of the camera is instantaneously fully sampled, and thus “jiggling” is not required to produce fully-sampled images.
The P-ArTéMiS prototype was built with the objective of demonstrating the feasibility and potential of the full ArTéMiS instrument.
P-ArTéMiS was first tested at 450 m on the KOSMA 3m telescope
in March 2006 and January 2007. It was then taken to Chile for initial tests on APEX during the second half of March 2007
under technical time allocated by the APEX Board, and then during ESO and Onsala scientific time in November 2007.
P-ArTéMiS uses a detector array produced as part of the -PACS project, but not selected for the space mission,
which was modified to operate at 450 m by adding a silicon-based filtering system on its surface (cf. Revéret et al. 2006).
The P-ArTéMiS bolometers are operated at 300 mK inside a conventional He-refilling cryostat.
During the 2007 runs, P-ArTéMiS was installed by our team at the visitor focus in the Nasmyth “A” cabin of the APEX telescope.
Eight individual maps, corresponding to a total effective integration time of 3.6 hr, were obtained with P-ArTéMiS at m toward the NGC 3576 region using a total-power, on-the-fly scanning mode. Each of these maps consisted of a series of scans in either Azimuth or Right Ascension taken with a scanning speed of 16″/sec or 20″/sec. The cross-scan step between consecutive scans was either 2″ or 4″. The sizes of the maps ranged from to . The atmospheric opacity at zenith was monitored by taking skydips with P-ArTéMiS and was found to be between 0.6 and 0.8 at m, corresponding to an amount of precipitable water vapor (PWV) between 0.5 mm and 0.7 mm. No dedicated pointing model was derived for P-ArTéMiS, but the pointing corrections proved to be very similar to, i.e. within of, the corrections appropriate for the APEX-2A instrument. Pointing, focus, and calibration measurements were achieved by taking both short ‘spiral’ scans and longer on-the-fly beam maps of Mars and Saturn. We estimated the absolute pointing accuracy to be and the absolute calibration uncertainty to be . The noise equivalent flux density (NEFD) per detector was 2 Jy.s1/2 . and the pixel separation between detectors on the sky was . The individual maps of NGC 3576 were registered with a relative positional accuracy of and a relative calibration uncertainty of . As estimated from our maps of Mars (whose angular diameter was in November 2007), the main beam had a full width at half maximum (FWHM) and contained of the power, the rest being distributed in an “error beam” extending up to an angular radius of . On-line data reduction was performed with the BoA software developed for LABOCA (Schuller, Beelen et al., in prep.). Off-line data reduction, including baseline subtraction, removal of correlated skynoise and noise, as well as subtraction of uncorrelated noise using a method exploiting the high level of redundancy in the data (Roussel et al., in prep.), was performed with in-house IDL routines.
3 Mapping results and analysis
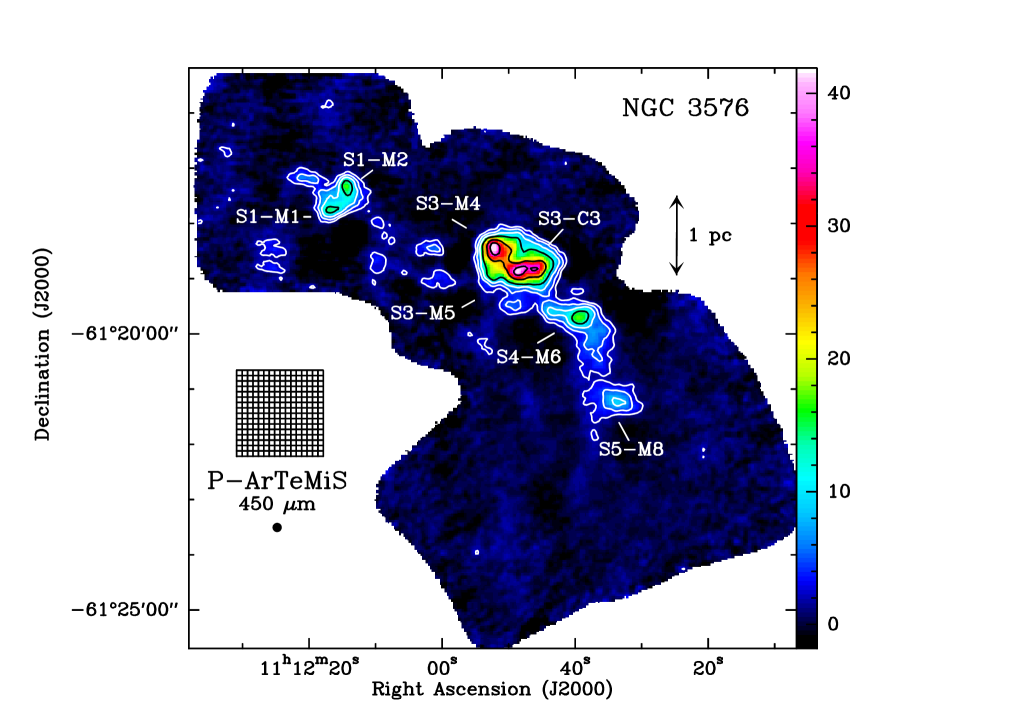
Co-adding the eight individual P-ArTéMiS maps of NGC 3576, we obtained the m mosaic shown in Fig. 1. At least seven localized dust emission peaks can be identified in this mosaic, which have been labeled here following the nomenclature of Purcell et al. (2008). They are distributed in four parsec-scale clumps labeled S1, S3, S4, and S5. The positions and flux densities measured for these compact P-ArTéMiS sources are given in online Table 1.
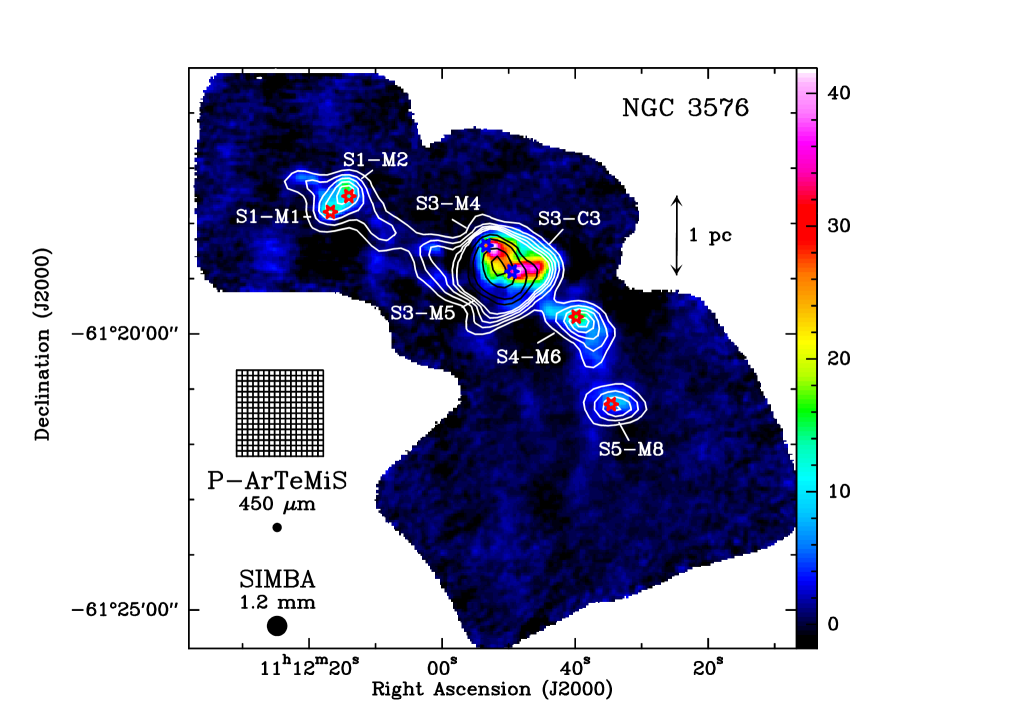
While the m emission peaks are well correlated with the 1.2 mm peaks detected by Hill et al. (2005) with SIMBA on the SEST, the factor of gain in angular resolution provided by P-ArTéMiS and the absence of confusion by free-free emission (see below) allowed us to resolve at least two of the SIMBA peaks (S1 and S3) into multiple m dust continuum sources (see online Fig. 2).
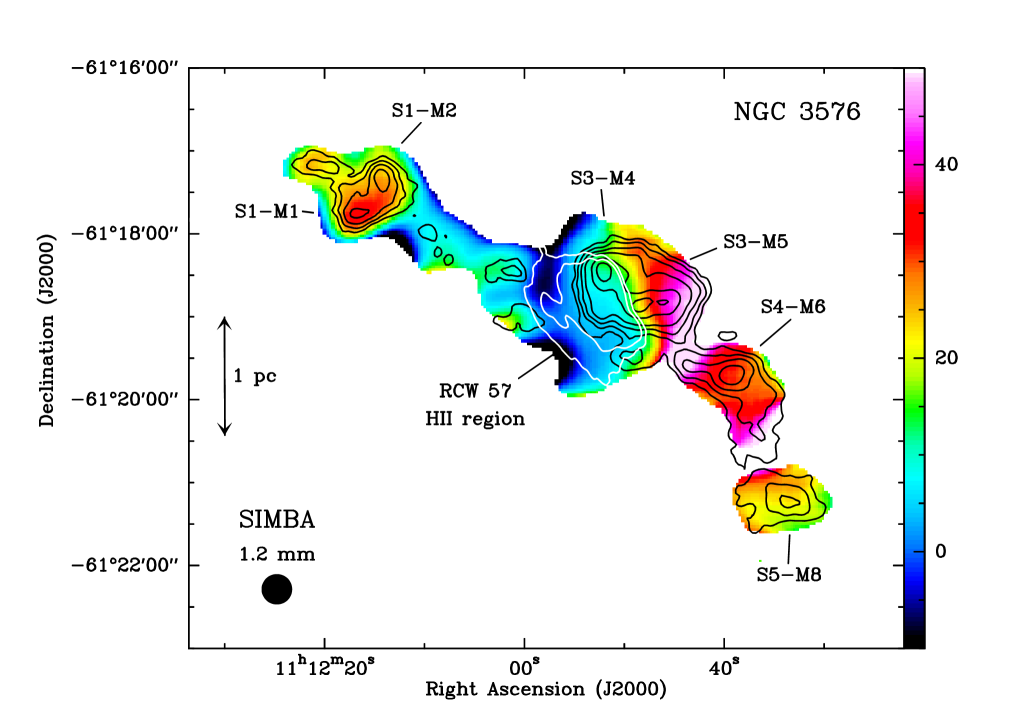
To further compare our P-ArTéMiS m mosaic with the SIMBA 1.2 mm map obtained by Hill et al. (2005), we smoothed the P-ArTéMiS data to the 22″ resolution of the SIMBA data, regridded the maps onto the same grid, and produced a map of the 450 m to 1.2 mm flux density ratio over the region where significant 1.2 mm continuum emission was detected by SIMBA. The resulting ratio map is shown in online Fig. 3. Over most of the area with significant emission at both m and 1.2 mm, the ratio ranges between and . These values are consistent with the spectral dependence expected for optically thin emission from dust with an emissivity index (e.g. Hildebrand 1983) and a temperature 10–30 K. In the eastern part of the S3 clump, however, the observed ratio is much lower, with values as small as 1.5–7.5 (cf. online Fig. 3). Such values of the flux ratio are inconsistent with dust emission unless the dust temperature is unrealistically low, 5–7 K, for a parsec-scale clump. This reflects the fact that the 1.2 mm emission observed with SIMBA toward the S3 clump is strongly contaminated by free-free radiation from the RCW 57 HII region (marked by white contours in Fig. 3). Extrapolating the 1.3 cm continuum emission measured by ATCA (Purcell et al. 2008) to 1.2 mm with the spectrum of optically thin free-free radiation, we estimate that free-free emission contributes more than 50% of the 1.2 mm flux densities observed with SIMBA in the eastern part of the S3 clump.
2
3
3.1 Detection of embedded protostars and derived properties
Two of the seven compact P-ArTéMiS sources listed in online Table 1, S3-M4 and S3-M5, are closely associated with 6.7 GHz methanol masers (see Fig. 2) and bright MSX sources. The four P-ArTéMiS sources S1-M1, S1-M2, S4-M6, S5-M8 were not detected by MSX but are closely associated with 22 GHz water masers (see Fig. 2). The seventh P-ArTéMiS source, labeled S3-C3 here, also remained undetected by MSX but coincides with a warm ( 30–40 K) ammonia core recently identified by Purcell et al. (2008) with ATCA (and labeled C3 by these authors). These associations indicate that the 0.1–0.4 pc dusty dense cores detected with P-ArTéMiS contain at least one protostellar object each.
While the (HPBW) angular resolution of P-ArTéMiS at 450 m is hardly sufficient to resolve individual condensations/envelopes within the dust cores at the distance of NGC 3576, our data can be used to estimate the masses and bolometric luminosities of the dominant protostellar sources as follows:
1
| Source | Coordinates | Remarks | |||||
| (Jy/beam) | (Jy) | (K) | |||||
| 11 | |||||||
| (1) | (2) | (3) | (4) | (5) | (6) | (7) | (8) |
| S1-M1 | 12m16.6s | 17′51″ | H2O maser, no MSX | ||||
| S1-M2 | 12m14.2s | 17′26″ | H2O maser, no MSX | ||||
| S3-M4 | 11m53.2s | 18′27″ | CH3OH maser, MSX | ||||
| S3-M5 | 11m49.65s | 18′52″ | CH3OH maser, MSX | ||||
| S3-C3 | 11m47.5s | 18′49″ | NH3 peak (C3), no MSX | ||||
| S4-M6 | 11m40.5s | 19′43″ | H2O maser, no MSX | ||||
| S5-M8 | 11m34.3s | 21′17″ | H2O maser, no MSX | ||||
-
a
Lower limit to for the dust source after correcting for free-free emission.
Assuming optically thin dust continuum emission at 450 m, the gas masses of the sources were derived from the measured flux densities using where is the dust opacity per unit (gas dust) mass column density at , and is the Planck function for the dust temperature . We adopted , which is consistent with the dust opacity law avocated by Hildebrand (1983) and appropriate in regions of moderately high gas densities ( – cf. Henning et al. 1995). The mean dust temperature of each core was estimated from the observed 450 m to 1.2 mm flux density ratio (cf. Fig. 3) assuming optically thin dust emission with an emissivity index (Hildebrand 1983). The results, given in Col. 7 of Table 1, generally agree with the gas kinetic temperatures derived from the NH3 observations of Purcell et al. (2008). Because of free-free contamination in the eastern part of the S3 clump (see above), our method provides only lower limits to the dust temperatures of S3-M4 and S3-M5. For these two cores, we thus relied on the gas temperature estimates of Purcell et al. (2008). The adopted dust temperatures and the corresponding core masses are listed in Col. 2 and Col. 3 of online Table 2, respectively. Column 4 provides an estimate of the envelope mass, , within a diameter of 0.03 pc of the dominant protostellar object in each core (where 0.03 pc AU is the typical fragmentation lengthscale observed in nearby cluster-forming regions – cf. Peretto et al. 2007). was obtained by first calculating the mass corresponding to the peak flux density in the 10″ beam (given in Col. 4 of Table 1 and corresponding to a 0.12 pc aperture at 2.4 kpc), and then applying a scaling factor of to that mass, assuming a density distribution so that the measured mass scales as the aperture size. A mean column density and a mean volume density for each core are also given in Col. 8 and Col. 9 of Table 2.
The bolometric luminosity of the dominant protostellar object in each core was estimated by fitting the observed SIMBA, P-ArTéMiS, and MSX flux densities (or upper limits) with the large grid of protostellar spectral energy distributions (SEDs) computed by Robitaille et al. (2006, 2007), using their online SED fitting tool. Unfortunately, no -MIPS observations of NGC 3576 are available yet, consequently resulting in poorly-sampled SEDs and large uncertainties on . Coupling a SED fitting approach with our P-ArTéMiS 450 m results nevertheless allowed us to derive a useful range of possible values for each protostellar core, which is given in Col. 5 of Table 2.
2
| Core | ||||||||
| (K) | () | () | () | () | (K) | () | () | |
| (1) | (2) | (3) | (4) | (5) | (6) | (7) | (8) | (9) |
| S1-M1 | 21 | 250 | 21 | 500– | 0.1–0.5 | |||
| S1-M2 | 16 | 540 | 45 | 500– | 0.2–1.1 | |||
| S3-M4 | 35 | 400 | 30 | 0.9–3 | 0.01–0.03 | 120–170 | ||
| S3-M5 | 35 | 460 | 29 | 0.5–2.5 | 0.02–0.04 | 110–160 | ||
| S3-C3 | 33 | 490 | 29 | 0.5–10 | 0.03–0.2 | |||
| S4-M6 | 19 | 350 | 26 | 500– | 0.1–0.6 | |||
| S5-M8 | 13.5 | 500 | 42 | 500– | 0.15–1.0 |
-
Notes: Column (3) gives the core mass derived from integrated over a 30″ diameter (Col. 5 of Table 1); uncertainty is a factor of on either side due to the uncertain value of . Column (4) is the envelope mass inferred for the dominant object in each core (see text); estimated uncertainty is a factor of on either side. Column (5) gives the bolometric luminosity estimated from , , and MSX flux densities (or upper limits), using the fitting routine of Robitaille et al. (2007).
4 Discussion and conclusions
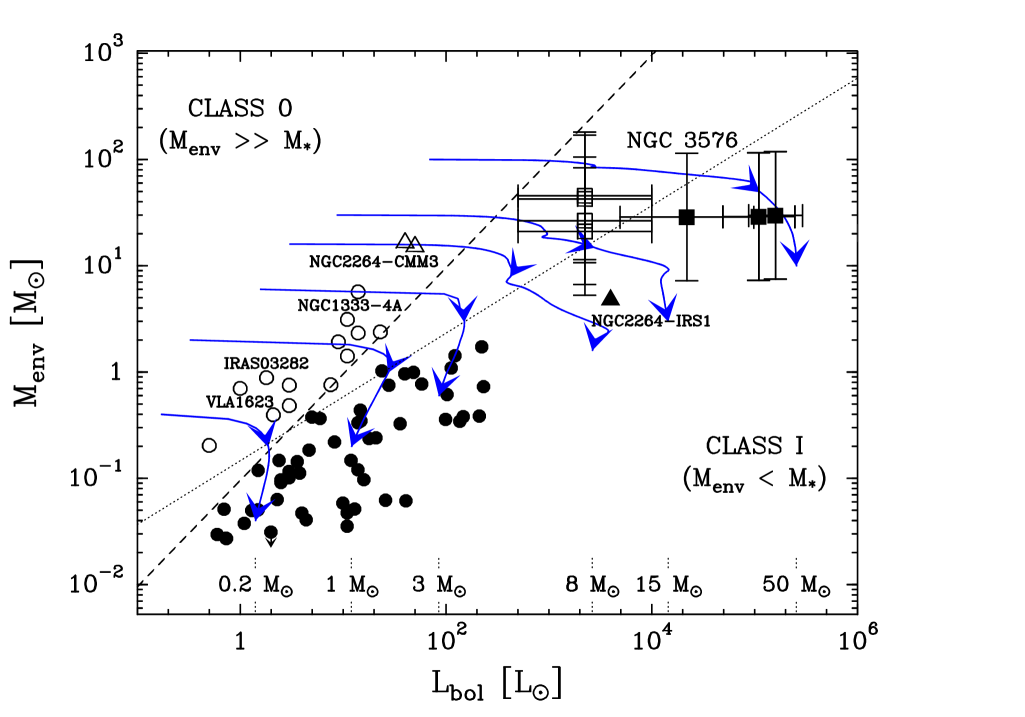
To put our present results in the context of similar observations of lower-mass Class 0 and Class I protostellar objects and to facilitate comparison, Fig. 4 shows the locations of the dominant sources of NGC 3576 in the – evolutionary diagram for protostars (cf. André & Montmerle 1994, Saraceno et al. 1996, André et al. 2000, Molinari et al. 2008). The sources were placed in Fig. 4 under the assumption that the most luminous object in each core (dominating in Table 2) coincides with the column density peak of that core (dominating ). Evolutionary tracks, computed assuming each protostar forms from a bounded condensation of finite initial mass and has , where is the protostellar radius and is the interior stellar luminosity (Stahler 1988, Hosokawa & Omukai 2008), are shown. The mass accretion rate and the envelope mass were assumed to be related by , where is the typical star formation efficiency for individual cores (cf. Matzner & McKee 2000) and yr is the characteristic timescale of protostellar evolution, leading to and functions declining exponentially with time (see Bontemps et al. 1996). It can be seen that the two tracks corresponding to final stellar masses of and , respectively, bracket the locations of the NGC 3576 objects in the – diagram, suggesting that these objects will evolve into stars of masses between and . The relative positions of the NGC 3576 sources in Fig. 4 also support the view that S1-M1, S1-M2, S4-M6, and S5-M8 are observed at significantly earlier evolutionary stages than are S3-M4 and S3-M5, while S3-C3 appears to be at an intermediate evolutionary stage. Despite relatively large uncertainties, the values derived for both the evolutionary indicator (André et al. 2000, Bontemps et al. 1996) and the indicator (Myers et al. 1998) (see Col. 6 and Col. 7 of Table 2, respectively) indeed suggest that the cores S1-M1, S1-M2, S4-M6, S5-M8 contain at least one massive Class 0 object each and that the cores S3-M4, S3-M5 are dominated by a massive Class I object. Recall that bona-fide low-mass Class 0 objects are characterized by and K (cf. André et al. 2000).
Our P-ArTéMiS 450 m results in NGC 3576 illustrate the unique potential of the future ArTéMiS bolometer camera for studies of star-forming regions in the southern hemisphere with APEX. With a factor of 9 more pixels than P-ArTéMiS at 450 m, and significantly better detectors, ArTéMiS will be nearly two orders of magnitude faster than P-ArTéMiS for mapping extended fields. Furhermore, in addition to 450 m images, ArTéMiS will simultaneously deliver 350 m and 200 m images, which will provide much better sampling of protostellar SEDs near their peak, hence improved bolometric luminosities. The colors measured between 450 m and 200 m will also lead to improved dust temperature estimates and will greatly help to discriminate between self-luminous accreting protostars and externally heated, starless cores. Combining extensive LABOCA surveys at 870 m (such as ATLASGAL – Schuller, Menten et al., in prep.) with follow-up imaging at 200–450 m with ArTéMiS will make it possible to identify and characterize a large number of candidate massive protostars in the southern sky. These candidate protostars can then be studied in greater detail with ALMA in order to shed light on the formation process of high-mass stars. In this way, APEX can truly fulfill its role of “ALMA pathfinder”.
Acknowledgements.
We are grateful to the APEX Board for awarding us technical time on APEX in March 2007. We would like to thank the APEX staff in Chile for their support during and prior to the observations. We acknowledge financial support from the French national programs on stellar and ISM physics (PNPS and PCMI), as well as the French National Research Agency (ANR).References
- André & Montmerle (1994) André, P., & Montmerle, T. 1994, ApJ, 420, 837
- André, Ward-Thompson, & Barsony (2000) André, P., Ward-Thompson,D., & Barsony, M. 2000, in Protostars and Planets IV, Eds V. Mannings et al., p. 59
- Beltrán et al. (2006) Beltrán, M. T., Brand, J., Cesaroni, R. et al. 2006, A&A, 447, 221
- Billot et al. (2006) Billot, N. et al. 2006, Proc. SPIE, Vol. 6275, p. 62650
- Bonnell, Vine, & Bate (2004) Bonnell, I. A., Vine, S. G., & Bate, M. R. 2004, MNRAS, 349, 735
- Bontemps et al. (1996) Bontemps, S., André, P., Terebey, S., & Cabrit, S. 1996, A&A, 311, 858
- Caswell (2004) Caswell, J.L. 2004, MNRAS, 351, 279
- De Pree, Nysewander, & Goss (1999) De Pree, C.G., Nysewander, M.C., Goss, W.M. 1999, AJ, 117, 2902
- de Wit et al. (2005) de Wit, W.J., Testi, L., Palla, F. et al. 2005, A&A, 437, 247
- Henning, Michel, & Stognienko (1995) Henning, Th., Michel, B., & Stognienko, R. 1995, Planet. Space Sci., 43, 1333
- Hidebrand (1983) Hildebrand, R.H. 1983, QJRAS, 24, 267
- Hill et al. (2005) Hill, T., Burton, M., Minier, V. et al. 2005, MNRAS, 363, 405
- Hosokawa & Omukai (2008) Hosokawa, T., & Omukai, K. 2008, ApJ (astro-ph/arXiv:0806.4122)
- Matzner & McKee (2000) Matzner, C. & McKee, C. 2000, ApJ, 545, 364
- Mc Kee & Tan (2003) Mc Kee, C. & Tan, J., 2003, ApJ, 585, 850
- Molinari et al. (2008) Molinari, S., Pezzuto, S., Cesaroni, R. et al. 2008, A&A, 481, 345
- Myers et al. (1998) Myers, P.C., Adams, F.C., Chen, H., & Schaff, E. 1998, ApJ, 492, 703
- Peretto et al. (2006) Peretto, N., André, P., & Belloche, A. 2006, A&A, 445, 979
- Peretto et al. (2007) Peretto, N., Hennebelle, P., & André, P. 2007, A&A, 464, 983
- Persi et al. (1994) Persi, P., Roth, M., Tapia, M. et al. 1994, A&A, 282, 474
- Purcell et al. (2008) Purcell, C.R., Minier, V., Longmore, S.N. et al. 2008, MNRAS
- Revéret et al. (2006) Revéret, V., Rodriguez, L., André, P. et al. 2006, Proc. SPIE, Vol. 6275, p. 627502
- Robitaille et al. (2006) Robitaille, T.P., Whitney, B.A., Indebetouw, R., Wood, K., & Denzmore, P. 2006, ApJS, 167, 256
- Robitaille et al. (2007) Robitaille, T.P., Whitney, B.A., Indebetouw, R., & Wood, K. 2007, ApJS, 169, 328
- Saraceno et al. (1996) Saraceno, P., André, P., Ceccarelli, C. et al. 1996, A&A, 309, 827
- Simoens et al. (2004) Simoens, F., Agnèse, P. et al. 2004, Proc. SPIE, Vol. 5498, p. 177
- Stahler (1988) Stahler S.W. 1988, ApJ, 332, 804
- Talvard et al. (2006) Talvard, M., André, P., Rodriguez, L., Minier, V. et al. 2006, Proc. SPIE, Vol. 6275, p. 627503
- Zinnecker & Yorke (2007) Zinnecker, H., & Yorke, H.W. 2007, ARA&A, 45, 481