The cosmic origin of carbon and manganese
Abstract:
We have determined carbon abundances for 51 dwarf stars and manganese abundances for 95 dwarf stars in two distinct and well defined stellar populations - the Galactic thin and thick disks. As these two populations have different chemical histories we have been able to, through a differential abundance analysis using high-resolution spectra, constrain the formation sites for carbon and manganese in the Galactic disk(s).
The analysis of carbon is based on the forbidden [C i] line at 872.7 nm which is an abundance indicator that is insensitive to errors in the stellar atmosphere parameters. Combining these data with our previously published oxygen abundances, based on the forbidden [O i] line at 630.0 nm, we can form very robust [C/O] ratios that we then used to investigate the origin of carbon and the chemical evolution of the Galactic thin and thick disks. We find that the [C/Fe] versus [Fe/H] abundance trends for the thin and thick disks are totally merged and being flat for sub-solar metallicities. The thin disk that extends to higher metallicities then shows a shallow decline in [C/Fe] from and up to . The [C/O] versus [O/H] trends are well separated between the two disks (due to differences in the oxygen abundances) and bear great resemblance with the [Fe/O] versus [O/H] trends. Our interpretation of our abundance trends is that the sources that are responsible for the carbon enrichment in the Galactic thin and thick disks have operated on a time-scale very similar to those that are responsible for the Fe and Y enrichment (i.e., SN Ia and AGB stars, respectively).
For manganese, when comparing our Mn abundances with O abundances for the same stars we find that the abundance trends in the stars with kinematics typical of the thick disk can be explained by metallicity dependent yields from SN II. Furthermore, the [Mn/O] versus [O/H] trend in the halo is flat. We conclude that the simplest interpretation of our data is that manganese most likely is produced in SN II and that the Mn yields for such SNae must be metallicity dependent.
1 Stellar sample, observations, and stellar parameters

The stellar samples are subsets of the in total 102 F and G dwarf stars we presented in [5, 7]. On the basis of their kinematic properties the stars have been classified to be likely members of either the thin or the thick Galactic disk. For a detailed description of the kinematical selection criteria and the kinematical properties of the stars we refer the reader to [5, 7, 8].
High-resolution spectroscopic observations were carried out with three different spectrographs. First, 69 stars were observed with FEROS in 2000 and 2001 when it was mounted on the ESO 1.5-m telescope on La Silla. Second, another 33 stars were observed with SOFIN on the Nordic Optical Telescope on La Palma in 2002. These FEROS and SOFIN spectra with their wide spectral coverage were used to determine the stellar parameters, as well as for the determination of Mn abundances. Third, a subset of 51 stars already observed with FEROS and SOFIN were observed in 2004 with the CES spectrograph on the ESO 3.6-m telescope on La Silla. These spectra with their very limited spectral coverage (only Å) but extremely high resolution () and high signal-to-noise () were used to analyse the forbidden carbon line, [C i], at 8727 Å.
We use the one-dimensional, plane-parallel, LTE, Uppsala marcs stellar model atmospheres [14, 12, 3]. Surface gravities () were determined from Hipparcos parallaxes, effective temperatures () were determined by requiring that the abundances derived from Fe i lines with different excitation energies should all yield the same [Fe/H], and the microturbulence parameter () by requiring all Fe i lines should yield the same abundances independent of line strength (). All parameters were taken from our previous studies [5, 7] wherein the iterative process to tune the stellar parameters also is fully described.
2 Carbon
The forbidden carbon line is located in the left wing of a Si i line and is blended by an Fe i line. The contribution from this blending line to the joint [C i]-Fe i line profile is generally negligible at sub-solar metallicities while it in the Sun is estimated to be between 0.1 pm and 0.5 pm [2], and will grow in size for stars with super-solar [Fe/H]. Figure 1 shows the observed and the synthetic spectra for the Sun. From our analysis of the solar spectrum we get a solar carbon abundance of when the blending Fe i line is taken into account and when it is neglected. Both are in good agreement with the recent analysis by [2, 4] who found a best value of using 3-D stellar atmosphere models.
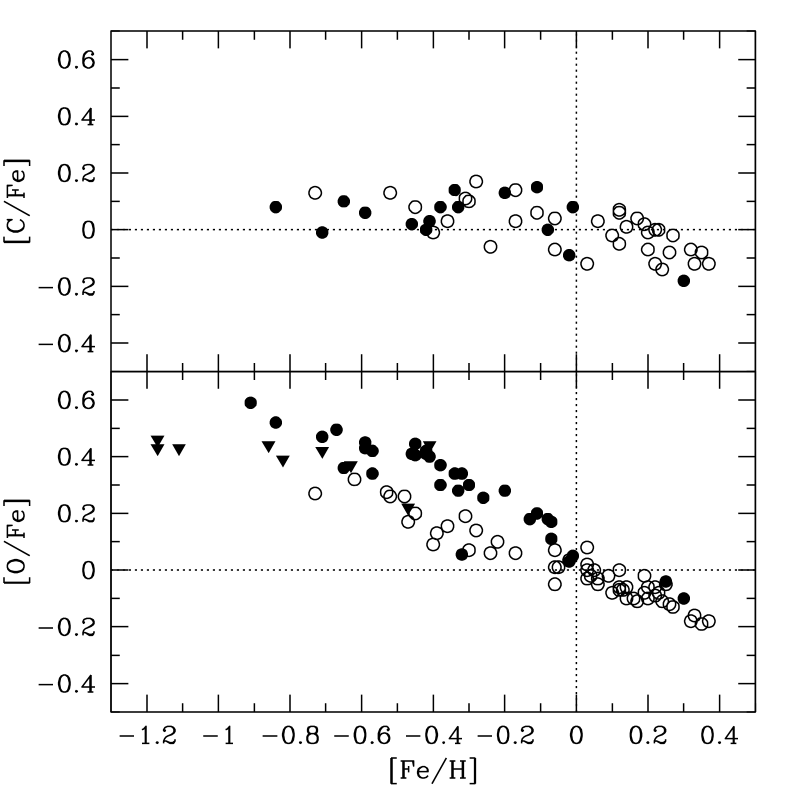

The resulting abundance trends are shown in Fig. 2. [C/Fe] versus [Fe/H] for the thin and thick disks are fully merged and at sub-solar metallicities the [C/Fe] values agree within with no particular slope. For the [C/Fe] values decrease with increasing [Fe/H]. The [C/O] versus [O/H] trends for the thin and thick disks are clearly separated. The thin disk shows a shallow increase in [C/O] with [O/H] whilst the thick disk first has a flat [C/O] trend that increases sharply at . The great resemblance with the observed [Fe/O] versus [O/H] trends also shown in Fig. 2 indicates that C and Fe originate from objects that evolve on similar time scales.
Our thick disk [O/Fe] trend shows a constant over-abundance of oxygen at low [Fe/H] and clear break and subsequent downturn at , a signature that normally is interpreted as the onset of SN Ia [18]. Our [C/Fe] show no such trend, instead [C/Fe] have roughly solar values for . Hence, we may infer that carbon enrichment happens on the same time scale as the enrichment from SN Ia. Hence the increase in Fe production is matched by enrichment of C. This is also supported by [11] who predict, if low and intermediate mass stars are important, that there first would be a flat [C/O] plateau for the thick disk that then (at roughly solar [O/H]) should sharply increase, to be followed by a shallow thin disk [C/O] trend at higher [C/O] ratios.


Furthermore, the trend of [C/Y] versus [Y/H] (Y abundances taken from [7]) shows a flat trend for which turns to a steadily declining trend for which is very similar to what we see for [C/Fe] versus [Fe/H] (see Fig. 2). [C/Y] vs [Fe/H] is flat for both the thin and the thick disk samples at all metallicities. As Y is mainly produced in the s-process in AGB stars [19]) the most straightforward interpretation of the lack of trends is that C and Y are made in objects that enrich the interstellar medium on the same time scale and that their major components are indeed made in the same objects, namely low and intermediate mass stars in the AGB phase.
In light of our own as well as other studies in the literature [15, 10, 11, 1, 9] we feel that the source(s) of carbon is not yet settled but that there is growing evidence that a complicated, and finely tuned, set of objects contribute to the enrichment of carbon in galaxies. As we discussed in [8], based on our own results only we would conclude that the main source for carbon in the Galaxy is low and intermediate mass stars. However, it appears that massive stars played a significant rôle for the carbon enrichment at low metallicities (i.e. halo and metal-poor thick disk) whereas low and intermediate mass stars dominate more and more at higher metallicities, i.e. that they have been the major contributors to the carbon enrichment in the thin disk and the metal-rich thick disk.
3 Manganese
We derive Mn abundances through spectral synthesis of four Mn i lines at 539.4, 549.2, 601.3, and 601.6 nm, taking the hyperfine structure splitting of the lines into account (see [13] for details). In order to study the origin of Mn we have combined our new Mn abundances with oxygen abundances. Fe is made both in SN II and in SN Ia. By using oxygen, which is only made in SN II, as the reference element we simplify the interpretation of the abundance data. For our stars we took the oxygen abundances from our analysis of the forbidden oxygen line at 630.0 nm [6, 7]. and added data from a number of other studies of (mainly) giant stars in the disks and halo of the Milky Way (see [13] for references to the different sources). Figure 4 shows the trend of [Mn/O] versus [O/H]. For the stars with kinematics typical of the thin disk we see a steady increase in [Mn/O] as [O/H] increases. Stars with kinematics typical of the thick disk show a similar trend, albeit with an offset of dex, for . For higher [O/H] there is a hint of a faster increase in [Mn/O].

For the halo and metal-poor thick disk, , the [Mn/O] trend is flat. This indicates that the production of Mn and O are well balanced. Moreover, we know from the study of [6] that the archetypal signature of SN Ia in the thick disk do not occur until [O/H] = 0. Hence the up-going trend we see after [O/H] must be interpreted as being due to metallicity dependent Mn yields in SN II. The rising trend seen for the thin disk sample could also be interpreted in this fashion. Although here we do know that SN Ia contribute to the chemical enrichment and hence the increase might also be due to these objects. Our interpretation is that these data, to first order, can be explained by metallicity dependent yields in SN II. This is, essentially, in agreement with the conclusions in [16].
4 Summary
We have used a two well-defined samples of thin and thick disk stars, both with their own chemical histories, to put further constraints on the cosmic production sites of carbon and manganese. Our findings indicate that carbon in the Milky Way disk mainly comes from low and intermediate mass stars (SN Ia and AGB stars) while manganese is likely to depend on metallicity dependent yields from massive stars. For further details regarding the analysis methods and a full discussion of the results we refer the reader to Bensby & Feltzing (2006) and Feltzing et al. (2007).
References
- [1] Akerman C. J., Carigi L., Nissen P. E., Pettini M., Asplund M., 2004, A&A, 414, 931
- [2] Allende Prieto C., Lambert D. L., Asplund M., 2002, ApJ, 573, L137
- [3] Asplund M., Gustafsson B., Kiselman D., Eriksson K., 1997, A&A, 318, 521
- [4] Asplund M., Grevesse N., Sauval A. J., Allende Prieto C., Blomme R., 2005, A&A, 431, 693
- [5] Bensby, T., Feltzing, S., & Lundström, I. 2003, A&A, 410, 527
- [6] Bensby, T., Feltzing, S., & Lundström, I. 2004, A&A, 415, 155
- [7] Bensby, T., Feltzing, S., Lundström, I., & Ilyin, I. 2005, A&A, 433, 185
- [8] Bensby, T., & Feltzing, S., 2006, MNRAS, 367, 1181
- [9] Carigi L., Peimbert M., Esteban C., García-Rojas J., 2005, Astrophys. J. , (623) , 213
- [10] Chiappini C., Romano D., Matteucci F., 2003, MNRAS, 339, 63
- [11] Chiappini C., Matteucci F., Meynet G., 2003, A&A, 410, 257
- [12] Edvardsson B., Andersen J., Gustafsson B., et al., 1993, A&A, 275, 101
- [13] Feltzing, S., Fohlman, M., & Bensby, T. 2007, A&A, 467, 665
- [14] Gustafsson B., Bell R. A., Eriksson K., Nordlund A., 1975, A&A, 42, 407
- [15] Gustafsson B., Karlsson T., Olsson E., Edvardsson B., Ryde N., 1999, A&A, 342, 426
- [16] McWilliam A., Rich R.M., & Smecker-Hane T.A., 2003, Astrophys. J. , (592) , L21
- [17] Nissen P.E., Primas F., Asplund M., & Lambert D.L., 2002, A&A, 390, 235
- [18] Tinsley B. M., 1979, Astrophys. J. , (229) , 1046
- [19] Travaglio C., Gallino R., Arnone E., Cowan J., Jordan F., Sneden C., 2004, Astrophys. J. , (601) , 864