DISCOVERY OF MOLECULAR SHELLS ASSOCIATED WITH SUPERNOVA REMNANTS. I. KESTEVEN 69
Abstract
Supernova remnant (SNR) Kes 69 is morphologically characterized by brightened radio, infrared, and X-ray emission on the southeastern rim, with the 1720 MHz OH masers detected in the northeastern and southeastern regions at various local standard rest (LSR) velocities. We have performed a millimeter observation in CO and HCO+ lines toward Kes 69. From the northeastern compact maser region, 12CO and 13CO emission’s peaks around and , which are consistent with the masers’ LSR velocities, are detected. In the southeast, a molecular (12CO) arc is revealed at 77–, well coincident with the partial SNR shell detected in the radio continuum and mid-infrared observations. An HCO+ emission is found to arise from a radio peak on the shell. Both the molecular arc and the HCO+ emission at seem to be consistent with the presence of extended OH masers along the southeastern boundary of Kes 69. The morphology correspondence between the CO arc and other band emission of the Kes 69 shell provides strong evidence for the association between SNR Kes 69 and the component of molecular gas. The multiwavelength emissions along the southeastern shell can be accounted for by the impact of the SNR shock on a dense, clumpy patch of molecular gas. This pre-existing gas is likely to be a part of the cooled debris of the material swept up by the progenitor’s stellar wind. The association of SNR Kes 69 with the molecular cloud at the systemic velocity of enables us to place the SNR at a kinematic distance of 5.2 kpc.
Subject headings:
ISM: individual (Kes 69, G21.80.6) – ISM: molecules – supernova remnants1. Introduction
The progenitors of core-collapse supernovae are most probably formed in giant molecular clouds (MCs). Due to the short lifetime, they are not far away from their matrices when they explode. Therefore it is common that the supernova remnants (SNRs) are located in the vicinity of MCs and may encounter them in evolution. The association with MCs often results in irregular morphology of the SNRs in multiwavelengths, which indicates sophisticated shock interaction with the inhomogeneous environmental medium. About 20 SNRs have been discovered to be physically interacting with ambient molecular gas based on the detection of the 1720 MHz OH masers (Frail et al. 1996), which are believed to be a tracer of the shock interaction with MCs (Lockett et al. 1999; Frail & Mitchell 1998; Wardle & Yusef-Zadeh 2002).
SNR Kesteven 69 is thought to be probably associated with MCs, because of the OH masers detected toward this remnant; however, the masers are found at various local standard rest (LSR) velocities and at various projected locations. Green et al. (1997) detected a compact OH maser using the Very Large Array (VLA) and the Australia Telescope Compact Array (ATCA) at , which is located projectionally in the northeastern part of the remnant. Recently Hewitt, Yusef-Zadeh, & Wardle (2008) not only found that this compact maser also has faint emission at , but also detected extended OH maser emission at the velocity of with the Green Bank Telescope observation and the VLA archival observation toward the southern bright radio shell. The different LSR systemic velocities imply the MCs at different distances that may be impacted by the SNR shock wave. Therefore investigation is needed to clarify at which systemic velocity the maser emission is the product of the Kes 69 shock interaction.
Kes 69 has an irregular X-ray morphology, as observed by ROSAT and Einstein, inside an incomplete radio shell (Seward 1990; Yusef-Zadeh et al. 2003). The Spitzer Infrared Array Camera (IRAC) mid-infrared observation toward Kes 69 shows an arc at 4.5m in the same location as the southeastern radio shell (Reach et al. 2006). The extended OH emission along the southern incomplete radio and Infrared (IR) shell hints an interaction of the SNR with the dense molecular gas in the south. If the SNR/MC association is established, a big progress can be made toward resolving the open question of the disparate velocity maser components and the distance to Kes 69 can also be determined.
Motivated by the supposed association of Kes 69 with molecular gas, we have performed millimeter CO and HCO+ observations toward this remnant. The observations and results are described in §2 and §3, and the conclusion is summarized in §4.
2. Observation and Data Reduction
The observations of millimeter molecular emissions toward SNR Kes 69 were made in two epoches during 2006 November–2007 January and 2007 October–November with the 13.7 m millimeter-wavelength telescope of the Purple Mountain Observatory at Delingha (hereafter PMOD). An SIS receiver was used to simultaneously observe the 12CO (J=1–0), 13CO (J=1–0), and C18O (J=1–0) lines. We mapped a area that contains the full extent of SNR Kes 69 via raster-scan mapping with the grid spacing of –. The main-beam efficiency in the observing epoch was 67% and elevation calibration
| Line | frequency (GHz) | noiseaaAverage rms noise of all final spectra; (K) | bbChannel separation. (km ) | FWHM (″) |
|---|---|---|---|---|
| 12CO (J=1–0) | 115.271204 | 0.29 | 0.37 | 60 |
| 13CO (J=1–0) | 110.201353 | 0.24 | 0.11 | 60 |
| C18O (J=1–0) | 109.782183 | 0.20 | 0.12 | 60 |
| HCO+ (J=1–0) | 89.188526 | 0.04 | 0.14 | 78 |
was performed. The typical system temperature was around 140–280 K. Three Acousto-Optical spectrometers (AOS) were used as the back end, and the corresponding spectral coverages were 145 MHz for 12CO (J=1–0) and 43 MHz for both 13CO (J=1–0) and C18O (J=1–0), all divided into 1024 channels. The observed velocity ranges were – for 12CO, 11– for 13CO (J=1–0), and 10– for C18O (J=1–0). We also chose two points for the HCO+ (J=1–0) line observation with long-time integration [122 minutes for point (, ) and 134 minutes for (, )], with the velocity range to . The baseline subtraction was performed with low-order polynomial fit. In Table 1 we list some observational parameters, such as the frequencies, the average rms noises of all final spectra, the channel separations, and the FWHM. All data were reduced using the GILDAS/CLASS package111http://www.iram.fr/IRAMFR/GILDAS.
The HI line emission data of the archival VLA Galactic Plane Survey (VGPS; Stil et al. 2006) were also processed. The observations were made by the VLA and the Green Bank Telescope, presented with the beam-size of , the velocity resolution of , and the rms noise of 2 K per channel. The processed Spitzer IRAC (Fazio et al. 2004) Basic Calibrated Data were used here (PID: 146, PI: Ed Churchwell), which are available in the archive of the Spitzer Science Center and include flat-field correction, linearity and flux calibrations, and dark subtraction. The final mosaic m IR image was produced by further processing with the custom IDL software (Huang et al. 2004). We also used the archived Spitzer Multiband Imaging Photometer (MIPS; Rieke et al. 2004) Post Basic Calibrated Data to present the mid-IR m image, which were obtained from the Micron Survey of the Inner Galactic Disk Program (PID: 20597, PI: Sean Carey). The 1.4 GHz radio continuum emission data were obtained from the NRAO VLA Sky Survey (NVSS; Condon et al. 1998).
3. Results
3.1. The CO and HCO+ Emissions

Figure 1 shows three CO spectra toward the center ( ) of the mapping area. There are several velocity components in the velocity range 0– in the 12CO (J=1–0) spectrum, and no 12CO emission is detected out of this range in the whole mapping area. The 12CO emission peaks appear in the intervals –12, 40–60, 60–76, 76–100, and 107–. We have found no morphological correspondence between the CO emission in the velocity intervals 2– and 40– and the emission from Kes 69 in any other waveband. The molecular component at around also shows no morphological correspondence, which is near the tangent point in this direction. Applying the rotation curve of Clemens (1985) together with (Reid 1993) and , the tangent point in this direction is at 7.4 kpc at . For the 12CO emission, we focused our analysis on the velocity intervals 60–76 and 76–100, which respectively cover and at which the OH masers were detected. The 13CO (J=1–0) emission is prominent at around and 82, at which the 12CO emission is strong. The intensity of the C18O (J=1–0) emission is too weak to examine its spatial distribution.
We have produced 12CO intensity maps with interval between 60 and (Fig. 2) to examine the molecular gas around 69.3 , at which the compact OH maser is seen. In the northeastern compact maser region, some faint diffuse 12CO emission are present at 60–. A distinct cloud at 69–76 is seen in the west.
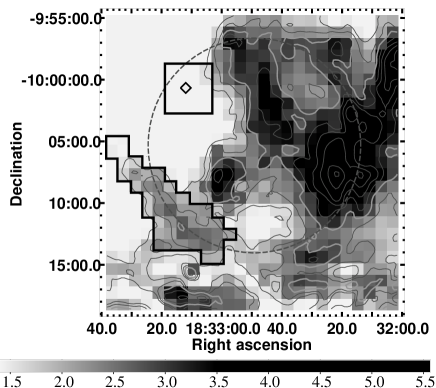
We have also produced 12CO intensity maps over the velocity range of 76–92 with interval (Fig. 3).By comparison with the radio continuum emission, an arc of the molecular gas at 77– is
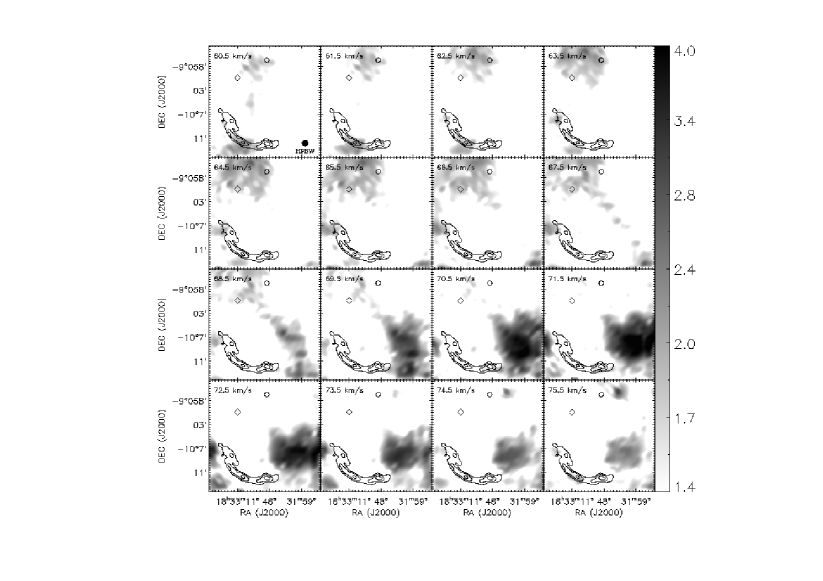
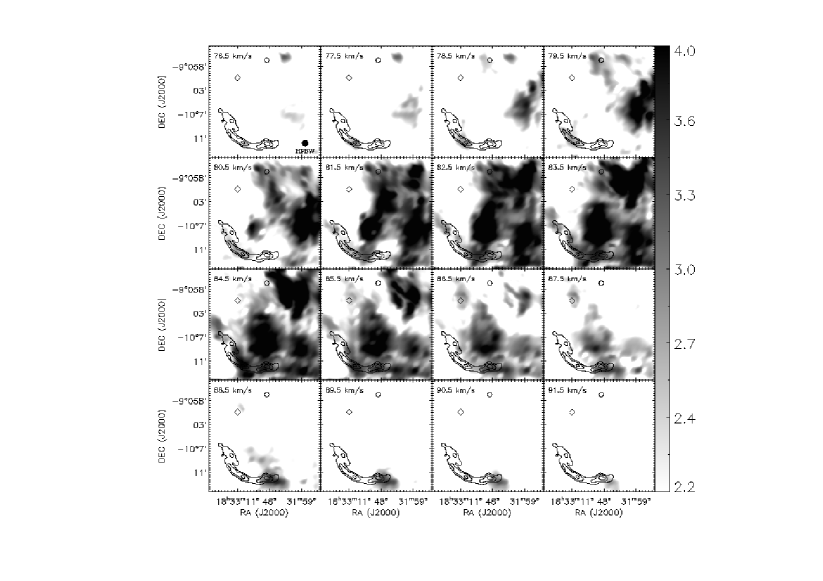
strikingly coincident along the southeastern rim. This arc is clearly seen in the close-up intensity images at 80–81 (Fig. 4) and 79– (Fig. 5). In the northwest (see Figs. 4 and 5), there is another section of molecular arc, which can even be discerned in the wider range 79– (Fig.3). The two sections of molecular arcs are seen in similar velocity range and can be threaded with a circle of angular radius . Some bright, complicated 12CO features are present in the field of view at 80–. There may be a contribution from the HII region G21.902–0.368 in the northwest, where the recombination line at 79.5 has been detected (Lockman 1989). There is also a molecular cloudlet at 87–, coincident with the strongest southern radio peak, at the western end of the incomplete radio shell. If this small cloud is associated with the SNR, the radio peak can be accounted for by the impact of the remnant shock on it, because of the drastic shock deceleration and hence the magnetic field compression and amplification.
| Gaussian Components | ||||
|---|---|---|---|---|
| Line | Center (km s-1) | FWHM (km s-1) | (K) | (K km s-1) |
| 12CO (J=1–0) | 84.7 | 5.2 | 2.4 | 13.4 |
| 13CO (J=1–0) | 84.9 | 2.4 | 0.5 | 1.2 |
| Molecular Gas Parameters | ||||
| bbSee text for the two estimating methods. | bbSee text for the two estimating methods. | (K)ccThe excitation temperature calculated from the maximum 12CO(J=1–0) emission point in the region. | CO)ddThe optical depth of the 13CO (J=1–0) line. | |
| Gaussian components: | 2.4 / 1.6 | / ee (see §3.3). | 7.8 | 0.2 |
| Residual partffDetermined by subtracting the Gaussian components centered at and after the multiple Gaussian fitting for the 12CO (J=1–0) emission in the velocity range 70–. : | 2.2 | ee (see §3.3). | ||
| The wholeggCombination of the Gaussian components around and the residual part. : | 4.6 | ee (see §3.3). | ||
| Gaussian Components | ||||
|---|---|---|---|---|
| Line | Center (km s-1) | FWHM (km s-1) | (K) | (K km s-1) |
| 12CO (J=1–0) | 85.0 | 3.4 | 3.9 | 14.3 |
| 13CO (J=1–0) | 84.9 | 2.4 | 0.5 | 1.2 |
| HCO+ (J=1–0) | 85.0 | 2.2 | 0.2 | 0.5 |
| Molecular Gas Parameters | ||||
| CO) | ||||
| 1.3 | 3.5 | 0.13 | ||

The CO spectra from the northeastern compact OH maser region and the southeastern shell region are shown in Figure 6 (the two regions for CO spectrum extraction are shown in Figure 4). For the former region, the 12CO and 13CO emissions peak at both and (both with a signal-to-noise ratio (S/N)3), essentially in agreement with the velocities at which the single maser arises (Green et al. 1997; Hewitt et al. 2008). The 12CO and 13CO lines at have complicated profiles, each of which can be phenomenologically fitted with a combination of at least three Gaussians. The lines at are slightly broadened in the blue wings. For the latter region, there are 12CO and 13CO lines at , with blue wings broadened (although the wing may be contaminated by the peaks). The profile of each line is divided into a Gaussian at and a residual part in the blue wing, with the fitted and derived parameters summarized in Table 2.
In the derivation, we used two methods to estimate the H2 column density and molecular mass. In the first method, the H2 column density is estimated by the use of the conversion factor CO) (Dame et al. 2001). In the second method, we assume local thermodynamical equilibrium (LTE) for the gas and optically thick condition for the 12CO (J=1–0) line and use the relation CO) (Frerking et al. 1982).
There seems to be a weak feature at in the 13CO line profile of the southeastern region, which could be either a broadened part of the component or a chance coincidence of an irrelevant, unperturbed cloud in the line of sight. We performed a multiple Gaussian fit incorporating this feature and derived a molecular gas mass for this feature, which is about two orders lower than the virial mass, indicating that the cloud is perturbed. In view of this and the clear shell-like appearance at 80–, we treat it simply as a small part in the broadened wing of the gas.

In the long-time pointing observation toward the southern strongest radio peak or the cloudlet mentioned above, which targets at (, ), no HCO+ signal was detected. However, HCO+ emission was detected in the pointing observation toward another radio peak at (, ) on the southeastern shell. The 12CO, 13CO, and HCO+ spectra of this point are shown in Figure 7. The HCO+ emission appears to be prominent only at , at which both the 12CO and 13CO emission peak, too. We calculated the column density of HCO+ assuming that the HCO+ emission is in LTE with the same excitation temperature as the 12CO emission ( K) and is optically thin. For comparison with the CO column density, we smoothed the CO (J=1–0) data to the same angular resolution as the HCO+ observation, and the results are listed in Table 3. Considering the 12COCO ratio (30–70) of the general interstellar medium (Langer 1992 and references therein), the HCO+/CO abundance ratio is 5. It is somewhat less than that of undisturbed cold MCs such as TMC-1 or L134N (; Ohishi, Irvine, & Kaifu 1992). The HCO+ abundance is expected to be reduced in a slow, nondissociating shock, unless some enhanced ionization is present (Iglesias & Silk 1978; Elitzur 1983). We note that the extended maser emission on the southern rim is found at the same LSR velocity (Hewitt et al. 2008), which implies that the dense molecular gas at this velocity is disturbed by C-type shock. For the origin of HCO+ emission, though, further observation is needed to make a decision.
3.2. Morphological correlation in multiwavelengths
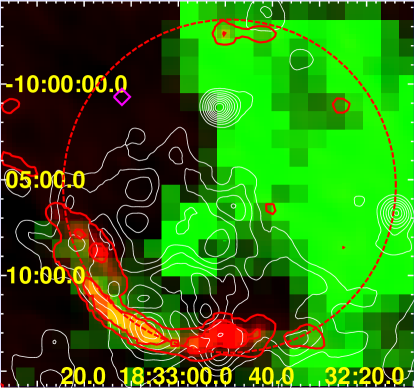
Combination of the multiwavelength observations toward Kes 69 (Fig. 5) shows some interesting morphological correlation.
First, the southeastern 77– molecular shell is not only coincident well with the 1.4 GHz radio shell (as pointed out above), but also (as seen in Fig. 8) with the mid-IR “ridge” described in Reach et al. (2006). This mid-IR ridge is prominent in 4.5m, with a relatively high brightness in 5.8m. A part of the m floclike emission in the southeast is also aligned with the molecular shell (Fig. 8). The presence of the molecular shell is consistent with the HCO+ and extended 1720 MHz OH maser emission at along the southern rim. This correspondence in morphological features is most probably another signature of the SNR-MC interaction, in addition to the 1720 MHz OH masers detected in Kes 69.
Second, as described above, both the sections of molecular arcs at – in the southeast and the northwest seem to be aligned along a circle. A faint 1.4 GHz bar in the north (highlighted by a red contour in Fig. 5) is also along this circle. Moreover, as noted by Yusef-Zadeh et al. (2003), there is a faint radio shell in the northwest in the low-resolution 330 MHz image of Kes 69 (Kassim 1992), which is confused with the HII region G21.902–0.368. We note that the peak of this patch of radio emission roughly coincides with the northwestern section of the molecular arc.
These morphological correlations demonstrate that Kes 69 is associated with the giant MC at the systemic velocity of . This association is strengthened by the detection of the extended and compact 1720 MHz OH maser emission and the HCO+ emission at from the SNR region.
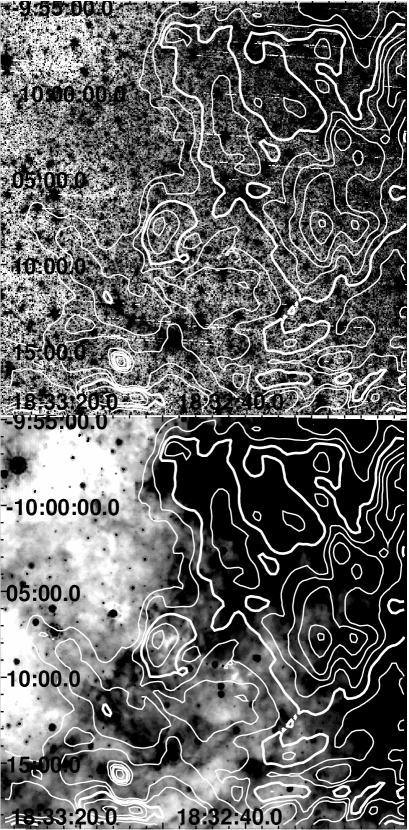
The southeastern half of the circle is roughly X-ray bright, while the other half appears to be X-ray faint but covered by the 79– molecular gas. This brightness anticorrelation between the X-ray and CO emission, however, does not imply that the molecular gas in the northwestern half obscures the X-rays. We estimate the hydrogen column density of this gas (in the interval 79–) to be . If there were an X-ray emitting gas, with similar properties to that observed in the southeast (temperature and intervening hydrogen column ; Yusef-Zadeh et al. 2003), behind this northwestern molecular gas, then an extra extinction by the gas would only cause an decrease in the 0.5–2 keV X-ray flux and this X-ray emission could have been observable. Thus we conclude that the X-ray faintness in the northwest is not caused by the absorption of the diffuse 79– molecular gas, whether this gas is connected to the cloud or not.
3.3. The Dynamics
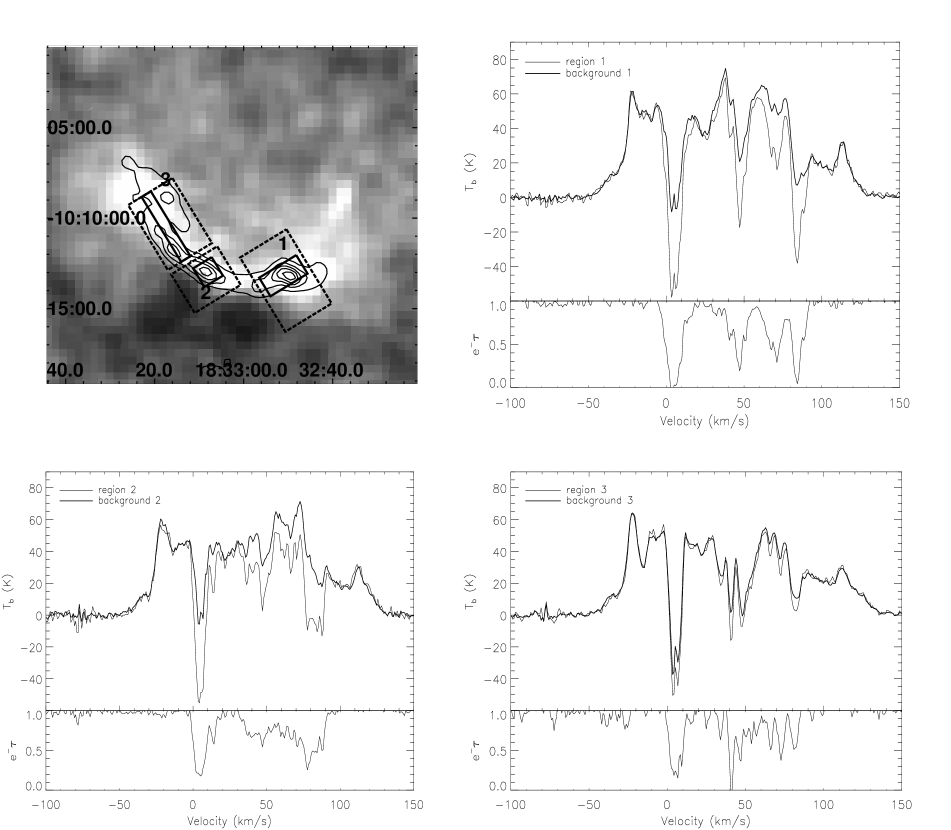
The association between SNR Kes 69 and the MC at systemic velocity facilitates a convincing determination of the kinematic distance to the remnant. The systemic velocity is suggestive of two candidate kinematic distances to the SNR/MC association, 5.2 kpc and 9.6 kpc. The choice can be made with the aid of the HI absorption along the line of sight. Following the method used in Tian, Leahy, & Wang (2007) and Tian & Leahy (2008a), we produced three HI spectra of regions along the southeastern shell of Kes 69, as shown in Figure 9. Distinct absorption features appear at 4, 6, 15, 40, 48, 67, 70, 82, and . The 12CO components along the shell around 5 and 50 (Fig. 6) can, due to the corresponding absorption features in the HI spectra, can be related to the chance-coincident foreground gas. No HI absorption features are present around the tangent point velocity , which indicates that the SNR is in front of the tangent point (at 7.4 kpc). Hence, the distance to the SNR is . We note that a similar estimate has in the meantime been given by Tian & Leahy (2008b).
The southeastern molecular arc is revealed above to be coincident with the radio and IR shell and move at a velocity of order (matching the blueshifted line broadening which reflects the velocity component in the line of sight). The broadened blue wing of the line profile of the molecular arc implies that the giant molecular cloud may have suffered a perturbation from the rear side. Three scenarios regarding the dynamical relation between the molecular arc and the SNR are discussed below.
First, the arc is likely to be a flake of molecular gas that is shocked by the slow transmitted cloud shock after the SNR blast wave hits the molecular cloud. In this case, the radio continuum emission may arise from the SNR shock that is blocked by dense cloud (Frail & Mitchell 1998) or the blast wave that propagates in the intercloud medium (Blandford & Cowie 1982), and the thermal X-ray emission may be ascribed to the hot gas behind the shocked molecular gas or just behind the blast wave. Thus there can be a crude pressure balance between the cloud shock and the X-ray emitting hot gas (Zel’dovich & Raizer 1967; McKee & Cowie 1975): , where denotes the number density of the hydrogen atoms ahead of the cloud shock, the density of the undisturbed intercloud medium, and the velocity of the blast wave. Velocity is related to the postshock temperature as , where is the hydrogen atom mass and is the average atomic weight. Adopting from the ROSAT X-ray observation (Yusef-Zadeh et al. 2003), we have and , implying that the blast wave hits a very dense matter in the molecular arc (here is assumed to be similar to the mean density of the X-ray emitting gas, , as obtained from a reproduced ROSAT X-ray spectral analysis222 The mean density of the X-ray-emitting gas is estimated as (where is used for scaling) from the volume emission measure of an elliptical region (with half-axes ), for which a volume of an oblate spheroid (with half-axes ) is assumed. ). In this scenario, assuming an adiabatic expansion and adopting the SNR extent represented by the circle of radius (§3.2) or , the SNR’s age is estimated as kyr and the explosion energy is (where ).
The 4.5m and 5.8m mid-IR emissions are suggested to be likely dominated by lines of shocked gas (Reach et al. 2006). They note that the 5.8m emission is relatively strong, but it is not clear whether H2 or [Fe II] lines (as likely mechanisms) are responsible for this emission, unlike the case of IC 443, in which the [Fe II] and H2 lines are very clearly segregated to the northern and southern regions of the remnant, respectively (see Rho et al. 2001). The H2 emission seems to be consistent with the slow molecular shock, while [Fe II] emission could not be ruled out with the present observations if the SNR shocks propagate in a complicated multi-phase medium. The m emission along the arc is likely to arise from the shocked molecular gas (e.g., OH and H2O), shock-heated dust grains, and even probably ions. The OH maser, HCO+, and H2O (if any) emissions are consistent with a C-type molecular shock.
Second, let us discuss the scenario in which the arc represents the interstellar material swept up all the way by the SNR shock wave. The mass of the southeastern molecular arc is in the range of 0.5– , with the gas mass observed in the whole line profile adopted as the upper limit and that of the broadened part as the lower limit (Table 2). In the swept-up case, the southeastern arc consists of the molecular gas that was originally of mean density –, distributed in an approximate 1/8th volume of a sphere of radius (considering the one-sided line broadening). In this scenario, the velocity of the SNR shock is represented by the arc’s slow expansion (), which would imply that the SNR is in the radiative phase. The explosion energy of the SNR, (Chevalier 1974), would have seemed to be normal, despite the seldom large age for X-ray-bright SNRs. However, the X-rays are bright along the southern shell and two X-ray emission peaks are essentially coincident with the two radio peaks (Fig. 5; toward which the pointing molecular line observation was made). A radiative shock as slow as could not be responsible for such X-rays along the SNR rim. On the other hand, to accelerate particles to relativistic energies for emitting radio synchrotron, the lower limit of the shock velocity is (Draine & McKee 1993): , where is the ionization fraction, the efficiency of the particle acceleration of the shock, and the preshock molecular gas temperature. It is much larger than the observed expansion velocity of the molecular shell, and thus new particle acceleration would be difficult to take place at this shock. The existing relativistic electrons would rapidly stream freely away from the shock front for a very low ionization fraction (Blandford & Cowie 1982). Moreover, because of the ambipolar diffusion, the magnetic field will separate from the neutral gas in a timescale (Blandford & Cowie 1982): (where is the magnetic field strength in the unshocked gas, the density compression ratio, and the shell thickness), very likely to be smaller than the remnant age in this case (even for ). Therefore, such a slow expansion of molecular cloud is difficult to account for the SNR’s radio emission. In view of the above points, this scenario does not apply to the molecular shell of Kes 69.
Third, the molecular shell may be the debris of the cooled, condensed material, which was swept up by the stellar wind of the supernova progenitor from the molecular gas [] and is now hit by the SNR shock. This possibility could be compatible with the first scenario and naturally explain why there is pre-existing, very dense material that is now hit by the SNR shock. A molecular wind-bubble shell has recently been discovered coincident with the ring nebula G79.29+0.46 surrounding a luminous blue variable star (Rizzo et al. 2008), which provides an instance for this scenario. If there was a stellar-wind bubble, it was created (Castor et al. 1975; Weaver et al. 1977) yr ago, where is the mechanical luminosity of the stellar wind in units of , and the present velocity of the shell is . This velocity is comparable to the blueshift in the broadened line profile of the molecular gas along the shell.
There appears to be a blowout morphology outlined by the extension of the radio/CO shell to the northeast out of the circle (Figs. 4 and 5), somewhat similar to the blowout morphology in SNR N132D (e.g., Dickel & Milne 1995; Xiao & Chen 2008). Actually, SNR N132D, which is in the vicinity of an MC, has been suggested to be shaped by the shock impacting on the stellar wind-bubble shell (Hughes 1987; Chen et al. 2003). The northeastern compact masers at both 69 and are projected in the blowout region. In this case, as a possibility, the maser could arise from a dense clump deviating from the systemic velocity by a strong perturbation, although it cannot be excluded from being nonassociated with the same SNR.
4. Summary
We have performed a millimeter observation in CO and HCO+ lines
toward SNR Kes 69.
From the northeastern compact 1720 MHz OH maser region,
the 12CO and 13CO emission’s peaks around
and , which are consistent with the masers’ LSR
velocities are detected.
In the southeast, a molecular (12CO J=1–0) arc is revealed at
77–, well coincident with the partial
SNR shell detected in the 1.4 GHz radio continuum and
mid-IR observations. An HCO+ emission is found to arise
from a radio peak on the shell. Both the molecular arc and the
HCO+ emission at seem to be consistent with the
presence of the extended 1720 MHz OH emission along the southeastern
boundary of Kes 69. The morphology correspondence between the CO
emission and other band emission of the Kes 69 shell provides strong
evidence for the association of the SNR with the
component of molecular gas. There is another section of molecular
arc at 79– in the northwest. Both the molecular arcs,
together with the faint northern radio features, seem to be distributed
along a circle of radius .
The multiwavelength emissions along the southeastern shell can be
explained by the impact of the SNR shock on a dense, clumpy patch of
molecular gas. This pre-existing gas is likely to be a part of the
cooled, clumpy debris of the interstellar molecular gas swept up by the
progenitor’s stellar wind. The association
between SNR Kes 69 and the MC at the systemic velocity
enables us to place the SNR at a kinematic distance of 5.2 kpc.
Note added in proof. In another observation in CO lines toward SNR Kes 75, we similarly discover a molecular shell, a part of which follows the bright partial SNR shell seen in X-rays, mid-IR, and radio continuum, and provide effective evidence for the association between Kes 75 and the adjacent MC (Su et al. 2009). Molecular shells are probably common in a number of SNRs but have rarely been studied.
References
- (1)
- (2) Blandford, R. D., & Cowie, L. L. 1982, ApJ, 260, 625
- (3)
- (4) Castor, J., McCray, R., & Weaver, R. 1975, ApJ, 200, L107
- (5)
- (6) Chen, Y., Zhang, F., Williams, R. M., & Wang, Q. D. 2003, ApJ, 595, 227
- (7)
- (8) Chevalier, R., A. 1974, ApJ, 188, 501
- (9)
- (10) Clemens, D. P. 1985, ApJ, 295, 422
- (11)
- (12) Condon, J. J., Cotton, W. D., Greisen, E. W., Yin, Q. F., Perley, R. A., Taylor , G. B., & Broderiek, J. J. 1998, AJ, 115, 1693
- (13)
- (14) Dame, T. M., Hartmann, D., & Thaddeus, P. 2001, ApJ, 547, 792
- (15)
- (16) Dickel, J. R. & Milne, D. K. 1995, AJ, 109, 200
- (17)
- (18) Draine, B. T. & McKee, C. F. 1993, ARA&A, 31, 373
- (19)
- (20) Elitzur, M. 1983, ApJ, 267, 174
- (21)
- (22) Fazio, G. G., et al. 2004, ApJS, 154, 10
- (23)
- (24) Frail, D. A., Goss, W. M., Reynoso, E. M., Giacani, E. B., Green, A. J., & Otrupcek, R. 1996, AJ, 111, 1651
- (25)
- (26) Frail, D. A. & Mitchell, G. F. 1998, ApJ, 508, 690
- (27)
- (28) Frerking, M. A., Langer, W. D., & Wilson, R. W. 1982, ApJ, 262, 590
- (29)
- (30) Green, A. J., Frail, D. A., Goss, W. M., & Otrupced, R. 1997, AJ, 114, 2058
- (31)
- (32) Hewitt, J. W., Yusef-Zadeh, F., & Wardle, M. 2008, ApJ, 683, 189
- (33)
- (34) Huang, J.-S., Barmby, P., Fazio, G. G., Willner, S. P., Wilson, G., Rigopoulou, D., Alonso-Herrero, A., Dole, H., Egami, E., Le Floc’h, E., Papovich, C., Prez-Gonzlez, P. G., Rigby, J., Engelbracht, C. W., Gordon, K., Hines, D., Rieke, M., Rieke, G. H., Meisenheimer, K., & Miyazaki, S. 2004, ApJS, 154, 44
- (35)
- (36) Hughes, J. P. 1987, ApJ, 314, 103
- (37)
- (38) Iglesias, E. R., & Silk, J. 1978, ApJ, 226, 851
- (39)
- (40) Kassim, N. 1992, AJ, 103, 943
- (41)
- (42) Langer, W. D. 1992, IAUS, 150, 193
- (43)
- (44) Lockett, P., Gauthier, E., & Elitzur, M. 1999, ApJ, 511, L235
- (45)
- (46) Lockman, F. J. 1989, ApJS, 71, 469
- (47)
- (48) McKee, C. F. & Cowie, L. L. 1975, ApJ, 195, 715
- (49)
- (50) Ohishi, M., Irvine, W. M., & Kaifu, N. 1992, in IAU Symp. 150; Astrochemistry of Cosmic Phenomena, ed; P. D. Singh (Dordrecht: Kluwer), 171
- (51)
- (52) Reach, W. T., et al. 2006, AJ, 131, 1479
- (53)
- (54) Reid, M. J. 1993, ARA& A, 31, 345
- (55)
- (56) Rho, J., Jarrett, T. H., Cutri, R. M., & Reach, W. T. 2001, ApJ, 547, 885
- (57)
- (58) Rieke, G. H., et al. 2004, ApJS, 154, 25
- (59)
- (60) Rizzo, J. R., Jimenez-Esteban, F. M., & Ortiz, E. 2008, ApJ, 681, 355
- (61)
- (62) Seward, F. D. 1990, ApJS, 73, 781
- (63)
- (64) Su, Y., Chen, Y., Yang, J., Koo, B.-C., Zhou, Xin., Jeong, I.-G., & Zhang, C.-G. 2009, ApJ, in press (arXiv:0810.5447)
- (65)
- (66) Stil, J. M., et al. 2006, AJ, 132, 1158
- (67)
- (68) Tian, W. W. & Leahy, D. A. 2008a, ApJ, 677, 292
- (69)
- (70) Tian, W. W. & Leahy, D. A. 2008b, MNRAS, 391, L54
- (71)
- (72) Tian, W. W., Leahy, D. A., & Wang, Q. D. 2007, A&A, 474, 541
- (73)
- (74) Wardle, M. & Yusef-Zadeh, F., 2002, Science, 296, 2350
- (75)
- (76) Weaver, R., McCray, R., Castor, J., Shapiro, P., & Moore, R. 1977, ApJ, 218, 377
- (77)
- (78) Xiao, X. & Chen, Y. 2008, AdSpR, 41, 416
- (79)
- (80) Yusef-Zadeh, F., Wardle, M., Rho, J., & Sakano, M. 2003, ApJ, 585, 319
- (81)
- (82) Zel’dovich, Ya. B. & Raizer, Yu. M. 1967, Physics of Shock wWaves and High-Temperature Hydrodynamic Phenomena (New York: Academic)