1\Yearpublication\Yearsubmission\Month\Volume\Issue
Towards an Accurate Model for the Antennae Galaxies
Abstract
In the framework of hierarchical structure formation ellipticals can form from merging of smaller disk galaxies. The nearby interacting ’Antennae’ galaxy pair (NGC 4038/39) is one of the best-studied local systems of merging spirals, thus presenting us with an ideal laboratory for the study of galaxy evolution models. The Antennae are believed to be in a state prior to their final encounter with rapid subsequent merging, which puts them in the first position of the Toomre (1977) merger sequence. Here we present first numerical high-resolution, self-consistent, smoothed particle hydrodynamics (SPH) simulations of the Antennae system, including star formation and stellar feedback, and compare our results to VLA HI observations by Hibbard et al. (2001). We are able to obtain a close, but not yet perfect match to the observed morphology and kinematics of the system.
keywords:
galaxies: evolution – galaxies: interaction – galaxies: individual (NGC 4038, NGC 4039) –methods: numerical
1 Introduction
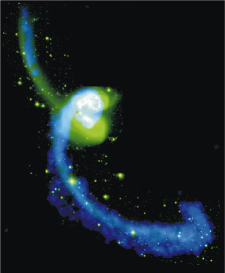
The ’Antennae’ galaxies (NGC 4038/39, Arp 244, VV245) are a well-known, archetypal example of a spiral-spiralgalaxy merger (see Fig. 1). They are nicknamed after their spectacular appearance with a prominent pair of tidal tails, which was already noted in early optical images (e.g. Duncan 1923, Schweizer 1978). At present there is a hugeamount of data collected for the Antennae both fromground- and space-based telescopes, covering a wide range of wavelength regimes. Recent examples include: optical HST WFPC data (Whitmore et al. 1999), near-IR WIRC (Brandl et al. 2005) and mid-IR IRAC (Wang et al. 2004) imaging, and Chandra ACIS-S X-ray observations (Baldi et al. 2006). The elongated tails are a clear sign of tidal interaction of nearly equal-mass galaxies (Toomre & Toomre 1972). They form kinematically by gravitational tides exerted during the interaction process and their morphology and velocity fields give strong hints on the encounter geometry and history. This makes the Antennae galaxies a key system for investigating galaxy interactions and their associated physical phenomena. Starting from the first numerical model by Toomre & Toomre (1972), where they used the restricted N-body method to model the evolution of the disks, there have been many attempts to obtain numerical ’look-alikes’ for the Antennae galaxies. Barnes (1988) was the first to use self-consistent N-body models with multiple components consisting of a bulge, a disk, and dark halo with a mass ratio of 1:3:16 and a total mass of . Dubinski, Mihos & Hernquist (1996) used the extent of the tidal features in the Antennae to probe the amount of dark matter in these galaxies. Mihos, Bothun & Richstone (1993) were the first to include gas dynamics and star formation into their dynamical model of the Antennae galaxies. For the latest review of the Antennae models we would also like to refer to the results presented by Hibbard (2003). However, most of the Antennae models are still based on the orbital parameters given in Toomre & Toomre (1972). Here we want to extend the probed parameter space in order to find orbital parameters which allow for a closer fit to the observed morphological and kinematical data of the Antennae. We use medium-resolution VLA HI mappings of the Antennae (”, ) by Hibbard et al. (2001) for comparison with our models. In this case it is advantageous to use the cold atomic gas as a sensitive tracer of the large-scale dynamics of the system as it is unlikely to be disturbed by star formation. Recently, there has been a debate about the exact distance to the Antennae, ranging from a modest Mpc (Saviane et al. 2008), based on photometry of the tip of the red giant branch, to Mpc (Schweizer et al. 2008), based on observations of a supernova of type Ia. Sometimes even higher and lower values have been quoted (e.g. Zezas & Fabbiano 2002, Rubin, Ford & D’Odorico 1970). A widely-used, intermediate distance to the Antennae is Mpc, which is derived from the systemic recession velocity relative to the Local Group assuming a Hubble constant of (Whitmore et al. 1999). In this paper the distance will be adopted as part of the model matching process.
2 Numerical setup
For our high-resolution model of the Antennae galaxies we set up equilibrium galaxy models following Springel, diMatteo & Hernquist (2005). Each model consists of a NFW halo (Navarro, Frenk & White 1997) which is then converted to a Hernquist (1990) profile dark matter halo. Embedded in the dark halo is a stellar Hernquist (1990) bulge component, and an additional exponential stellar andgaseous disk. The ratio of luminous to dark matter, or, the baryon mass fraction, is , where NGC 4038 is modeled as an ’Sc-type galaxy’ with a bulge-to-disk ratio of B/D = 0.2 and NGC 4039 as an ’Sb-type galaxy’ with a B/D = 0.4. Each galaxy has a total mass of . As a starting point for our models we adopted the baryon mass fraction and the total masses from Barnes (1988). The initial gas fraction in the disks was chosen to be 20%, which amounts to and , respectively. Further parameters for the two model galaxies are summarized in Tab. 1. All simulations are run on the local ALTIX SGI supercomputer using the fully parallel smoothed particle hydrodynamics (SPH) (see e.g. Monaghan 1992) code Gadget2 (Springel 2005). The simulations include a prescription of radiative cooling for primordial hydrogen and helium (Katz, Weinberg & Hernquist 1996). We also model star formation and supernova feedback, following the sub-grid multiphase prescription as described by Springel & Hernquist (2003), but exclude supernovae-driven galactic winds. Initially the galaxies move on elliptical Keplerian orbits () with a pericentric separation kpc and an initial separation of one virial radius kpc. We ran a set of low-resolution simulations, going through iterative cycles, while varying the scaling parameters, the orientation of the disks and the viewing angle, until we obtained a good match with the observational data. However, this resulted in a rather high adopted distance to the Antennae of Mpc if we choose to apply no spatial scaling. This merger geometry was then re-simulated at high-resolution including star formation and radiative cooling. The total number of particles was 1,600,000, of which NGC 4038 and NGC4039 contributed 105,000 and 180,000 bulge particles, 420,000 and 360,000 disk particles, and 105,000 and 90,000 gas particles, respectively. Furthermore, each galaxy consisted of dark matter halo particles. The particle numbers were chosen in this particular way for dynamical reasons, i.e. to ensure that all particles in the baryonic component have exactly the same masses in order to minimize two-body relaxation effects. The gravitational softening parameters for stellar and gaseous particles were set to kpc and for the dark matter halo particles to kpc, and the system was evolved for a total time of Gyr.
| Modeled Property | NGC 4038 | NGC 4039 |
|---|---|---|
| Disk scale length | 3.31 kpc | 3.29 kpc |
| Disk scale height | 0.66 kpc | 0.66 kpc |
| Bulge scale length | 0.66 kpc | 0.66 kpc |
| Maximum rotational velocity | 169 km/s | 170 km/s |
3 Results
Fig. 3 shows the evolution of the Antennae merger morphology as a function of time. In our simulation, we set the origin of the time such that the galaxies pass pericenter at a time Gyr (upper panel in Fig. 3), and have their final encounter at Gyr. Star formation is mostly confined to the central regions of the simulated galaxies.
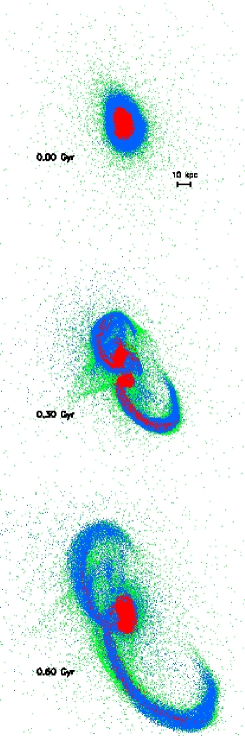
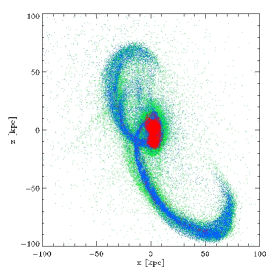
At the time we stopped our calculations, Gyr, the galaxies still show elongated tidal tails and clear signs of a tidally disturbed morphology at their centers. They have not yet transformed into an elliptical-like merger remnant (see, e.g. Naab & Burkert 2003, Naab, Jesseit & Burkert 2006, Johansson, Naab & Burkert 2008). We obtain our ’best fit’ at a time shortly before the second encounter, that is 600 Myr after pericenter and 220 Myr before the final merger (see Figs. 2 and lower panel in Fig. 3). In the position-velocity diagram (Fig. 4) we see three projections in the a) X-Z (plane-of-the-sky), b) X-Vy and c) Vy-Z planes. Only gas particles are shown, where blue and red particles indicate particles from NGC 4039 and 4038, respectively.
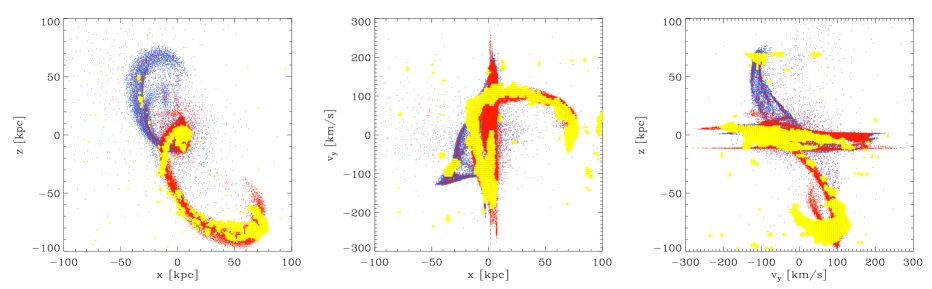
Comparing the model with observations (overlaid in yellow), we obtain a good fit with the observed morphology of the system (left panel in Fig. 4). However, the agreement with the observed velocities of the northern tail could be improved. In this region the data show overallsmaller values (right panel in Fig.4). This could be achieved by slight changes of the orientation of NGC 4039 with respect to the orbital plane and/or by choosing a slightly different viewing angle. Also the spatial and kinematical data at the bending end of the southern tail still need adaptation (middle/right panel in Fig. 4), which may be achieved by adopting a flat distribution for the initial gas disks. Our model is similar to the model by Hibbard (2003), but in addition we included gas dynamics, star formation, and feedback in our simulations.
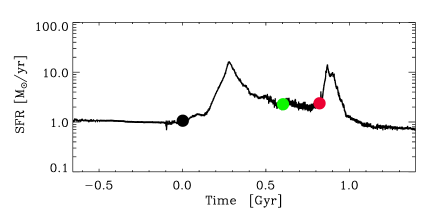
In contrast to observations, we do not see enhanced star formation in the ’overlap’ region at the time of ’best fit’ as is observed in the Antennae (see, e.g. Wang et al. 2004). This may be due to the fact that a significant amount of gas has already been consumed by the starburst during the first encounter. This will be subject to further investigations. Fig. 5 shows the global star formation rate (SFR) of the simulated Antennae system. The star formation history in the two galaxies is dominated by two major starbursts resulting from gas funneled to the galactic centers after the first ( Gyr, black dot) and second passage ( Gyr, red dot). At the time of best fit ( Gyr, green dot) we have a SFR of which lies below the range of observed values. Zhang, Fall & Whitmore (2001) report a SFR of 4 21 derived from the total flux within the disks of the Antennae either directly (lower value) or with a correction for extinction (upper value). Stanford et al. (1990) give a SFR of for the total system. Our result is qualitatively consistent with the low values of the total SFR of reported in the Antennae simulations by Mihos, Bothun & Richstone (1993).
4 Summary & Outlook
In this work we have presented first steps towards a good numerical model for the Antennae galaxies. The simulations include star formation and stellar feedback using sub-grid physics as proposed by Springel & Hernquist (2003). We are able to obtain a close match to the observed morphology of the system, while a perfect fit to the kinematical HI data is still to be achieved. Our goal is to investigate in detail the history and distribution of newly formed stars in the Antennae galaxies, in particular in the ’overlap’ region of the two progenitor disks. Close comparison to observations then enables us to adjust the star formation prescriptions used in numerical simulations and figure out the important physical properties controlling star formation in interacting galaxies. In this spirit, it is worth examining alternative formulations for the star formation laws in numerical simulations, see e.g. Barnes’ (2005) shock-induced star formation model for the ’Mice’ galaxies. There is a number of possible processes relevant for the enhanced star formation in the Antennae merger, specifically in the ’overlap’ region. One idea is that collisions of giant molecular clouds (GMCs) during the merger process could trigger starbursts (Noguchi 1991) in interacting galaxies. As the disk filling factor of GMCs is rather low (), Jog & Solomon (1992) proposed that a hot ionized, high-pressure gas medium, resulting from fast collisions between HI clouds, could cause a radiative shock compression in the outer layers of pre-existing GMCs, thereby inducing bursts of star formation. Elmegreen & Efremov (1997) advocate high-pressure regions, which originate in the large-scale shocks of interacting galaxies, for being the driver of bound star cluster formation, while, lately, Renaud et al. (2008) raised the idea that compressive tidal modes in galaxy mergers could play an important role for the formation of globular clusters. It would also be interesting to study whether one can form candidates for tidal dwarf galaxies in the tails of the merger as is observed in the southern tidal arm of the Antennae (Schweizer 1978, Mirabel, Dottori & Lutz 1992, see also Wetzstein, Naab & Burkert 2007).
Acknowledgements.
This work was funded by the DFG priority program SPP 1177 “Witnesses of Cosmic History: Formation and evolution of galaxies, black holes, and their environment”. The numerical simulations were performed on the local SGI-Altix 3700 Bx2, which was partly funded by the Cluster of Excellence: “Origin and Structure of the Universe”.References
- [1] Baldi, A., Raymond, J.C., Fabbiano, G., Zezas, A., Rots, A.H., Schweizer, F., King, A.R., Ponman, T.J.: 2006, ApJ 636, 158
- [2] Barnes, J.,E.: 1988, ApJ 331, 699
- [3] Barnes, J.,E.: 2004, MNRAS 350, 798
- [4] Brandl, B.R., Clark, D.M., Eikenberry, S.S., et al.: 2005, ApJ 635, 280
- [5] Dubinski, J., Mihos, J.C., Hernquist, L.: 1996, ApJ 462, 576
- [6] Duncan, J.C.: 1923, ApJ 57, 137
- [7] Elmegreen, B.G., Efremov, Y.N.: 1997, ApJ 480, 235
- [8] Hernquist, L.: 1990, ApJ 356, 359
- [9] Hibbard, J.E.: 2003, BAAS, 35, 1413; and “http://www.cv.nrao.edu/ jhibbard/n4038/n4038sim/”
- [10] Hibbard, J.E., van der Hulst, J.M., Barnes, J.E., Rich, R.M.: 2001, AJ 122, 2969
- [11] Jog, C.J., Solomon, P.M.: 1992, ApJ 387, 152
- [12] Johansson, P.H., Naab, T., Burkert, A.: 2008, arXiv 0802.0210v1
- [13] Katz, N., Weinberg, D.H., Hernquist, L.: 1996, ApJS 105, 19
- [14] Mihos, J.C., Bothun, G.D., Richstone, D.O.: 1993, ApJ 418, 82
- [15] Mirabel, I.F., Dottori, H., Lutz, D.: 1992, A&A 256, L19
- [16] Monaghan, J.J.: 1992, ARA&A 30, 543
- [17] Naab, T., Burkert, A.: 2003, ApJ 597, 893
- [18] Naab, T., Jesseit, R., Burkert, A.: 2006, MNRAS 372, 839
- [19] Navarro, J.F., Frenk, C.S., White, S.D.M.: 1997, ApJ 490, 493
- [20] Noguchi, M.: 1991, MNRAS 251, 360
- [21] Renaud, F., Boily, C.M., Fleck, J.J., Naab, T., Theis, C.: 2008, MNRAS, in press
- [22] Rubin, V.C., Ford, W.K., D’Odorico, S.: 1970, ApJ 160, 801
- [23] Saviane, I., Momany, Y., Da Costa, G.S., Rich, R.M., Hibbard, J.E.: 2008, ApJ 678, 179
- [24] Schweizer, F.: 1978, IAUS 77, 279
- [25] Schweizer, F., Burns, C.R., Madore, B.F., et al.: 2008, arXiv 0807.3955v1
- [26] Springel, V.: 2005, MNRAS 364, 1105
- [27] Springel, V., Hernquist, L.: 2003, MNRAS 339, 289
- [28] Springel, V., Di Matteo, T., Hernquist, L.: 2005, MNRAS 361, 776
- [29] Stanford, S.A., Sargent, A.I., Sanders, D.B., Scoville, N.Z.: 1990, ApJ 349, 492
- [30] Toomre, A.: 1977, in The Evolution of Galaxies and Stellar Populations, ed. B.M. Tinsley & R.B. Larson (New Haven,: Yale Univ. Press), 401
- [31] Toomre, A. & Toomre, J.: 1972, ApJ 178, 623
- [32] Wang, Z., Fazio, G.G., Ashby, M.L.N., et al.: 2004, ApJS 154, 193
- [33] Wetzstein, M., Naab, T., Burkert, A.: 2007, MNRAS 375, 805
- [34] Whitmore, B.C., Zhang, Q., Leitherer, C., Fall, S.M., Schweizer, F., Miller, B.W.: 1999, AJ 118, 1551
- [35] Zezas, A., Fabbiano, G.: 2002, ApJ 577, 762
- [36] Zhang, Q., Fall, S.M., Whitmore, B.C.: 2001, ApJ 561, 727