Discovery of Extreme Carbon Stars in the Large Magellanic Cloud
Abstract
Using Spitzer IRAC and MIPS observations of the Large Magellanic Cloud, we have identified 13 objects that have extremely red mid-IR colors. Follow-up Spitzer IRS observations of seven of these sources reveal varying amounts of SiC and C2H2 absorption as well as the presence of a broad MgS feature in at least two cases, indicating that these are extreme carbon stars. Preliminary estimates find these objects have luminosities of 4–11103 and preliminary model fitting gives mass-loss rates between 410-5 and 210-4 yr-1, higher than any known carbon-rich AGB star in the LMC. These spectral and physical properties require careful reconsideration of dust condensation and mass-loss processes for carbon stars in low metallicity environments.
Subject headings:
Magellanic Clouds — stars: AGB and post-AGB — stars: carbon — infrared: stars1. Introduction
We have undertaken a study of star formation in the Large Magellanic Cloud (LMC; Gruendl & Chu, 2008), using archival Spitzer Space Telescope observations, such as those of Surveying the Agents of a Galaxy’s Evolution (SAGE; Meixner et al., 2006). In the process of identifying young stellar objects (YSOs) we noticed 13 bright mid-IR sources (Table 1) that all had similar photometric properties with spectral energy distributions (SEDs) markedly different from those of evolved stars or YSOs: (1) they have extremely red mid-IR colors, [4.5]-[8.0]4.0; (2) their SEDs, peaking between 8 and 24 m, can be moderately well fit by blackbodies with effective temperatures of 230–320 K; (3) they all fall in a narrow range of brightness, 7.0[8.0]8.5; and (4) none of the sources have counterparts in the Two Micron All Sky Survey Point Source Catalog (2MASS PSC; Skrutskie et al., 2006) or in the Digitized Sky Survey. We dubbed these sources Extremely Red Objects (EROs).
The EROs are not likely asteroids because of their high brightnesses and lack of proper motions in SAGE observations from two epochs separated by 3 months. They cannot be background galaxies or Galactic sources, as the Spitzer Wide-area IR Extragalactic Survey (SWIRE; Lonsdale et al., 2003) and the Galactic Legacy IR Mid-Plane Survey Extraordinaire (GLIMPSE; Benjamin et al., 2003) do not have counterparts with similar mid-IR colors and brightnesses. These EROs are most likely associated with the LMC, and their high luminosities imply that their Galactic counterparts would have saturated in the SWIRE and GLIMPSE Surveys.
Queries of the SIMBAD database found that some EROs had been detected previously in either MSX or IRAS observations (e.g., Schwering, 1989). Five have been suggested as possible obscured AGB stars by Loup et al. (1997); however, many of our EROs have also been suggested to be YSO candidates (Whitney et al., 2008). As these EROs have never been confirmed or rejected as YSOs spectroscopically, we included seven among our follow-up observations of massive YSOs in the LMC using the Spitzer InfraRed Spectrograph (IRS; Houck et al., 2004). These IRS observations show unambiguously that the EROs are carbon stars; furthermore, the spectra reveal silicon carbide (SiC) absorption features. While SiC emission features are fairly common in both Galactic and LMC carbon stars, this is the first clear detection of SiC absorption for LMC carbon stars. Preliminary analysis of the IRS spectra suggests that these are extraordinary carbon stars with very high mass-loss rates. This paper reports their discovery. In §2 we describe their basic photometric properties and their possible optical and near-IR counterparts. In §3 we introduce our IRS observations and in §4 we discuss the results.
2. Photometric Observations
2.1. Mid-Infrared Observations
| Cross | Mass-Loss | ||||||||
|---|---|---|---|---|---|---|---|---|---|
| Source ID | m3.6 | m4.5 | m5.8 | m8.0 | m24.0 | m70.0 | Identification | Lbol | Rate |
| [mag] | [mag] | [mag] | [mag] | [mag] | [mag] | [] | [ yr-1] | ||
| 050231.49680535.8 | 15.92.08 | 12.75.05 | 9.91.05 | 7.26.05 | 3.06.11 | 2.09.23 | 7800 | 1.110-4 | |
| 050343.02664456.7 | 14.92.06 | 12.93.06 | 10.68.06 | 8.25.06 | 2.96.11 | 1.71.24 | IRAS 050366649 | 7000 | 1.510-4 |
| 050405.60682340.3 | 16.47.10 | 13.12.06 | 10.27.05 | 7.65.05 | 3.63.11 | 3.32aaFor non-detections a 3- upper-limit is given. | IRAS 050426827 | 4950 | 6.310-5 |
| 051301.75693351.0 | 15.87.08 | 13.70.06 | 10.69.06 | 7.78.06 | 3.35.11 | 1.59aaFor non-detections a 3- upper-limit is given. | IRAS 051336937 | 5800 | 8.910-5 |
| 051811.70703027.0 | 14.97.07 | 12.26.06 | 9.89.05 | 7.61.05 | 2.82.11 | 1.59.22 | IRAS 051877033 | 8850 | 1.310-4 |
| 051848.36693334.7 | 14.41.07 | 12.34.06 | 9.72.05 | 7.11.05 | 3.32.11 | 1.24.24 | IRAS 051916936 | 7750 | 8.310-5 |
| 052540.63700827.2 | 16.02.13 | 13.20.06 | 10.45.06 | 7.80.05 | 3.82.11 | 2.58.26 | IRAS 052607010 | 4300 | 5.910-5 |
| 052937.89724952.9 | 13.61.06 | 11.14.05 | 9.02.05 | 7.09.05 | 3.81.11 | 2.92.26 | IRAS 053057251 | 5550 | 4.210-5 |
| 053044.10714300.5 | 13.47.06 | 12.13.05 | 10.21.05 | 7.76.06 | 2.75.11 | 1.13.22 | IRAS 053157145 | 9500 | 1.710-4 |
| 054134.73694209.3 | 14.84.07 | 11.91.05 | 9.40.05 | 7.11.05 | 3.50.11 | 2.35aaFor non-detections a 3- upper-limit is given. | IRAS 054206943 | 6400 | 6.610-5 |
| 054859.98703322.5 | 15.33.08 | 13.70.06 | 11.32.06 | 8.41.06 | 2.41.11 | 0.72.22 | IRAS 054957034 | 11100 | 2.310-4 |
| 055026.08695603.1 | 14.26.05 | 11.81.05 | 9.25.05 | 6.94.05 | 3.10.11 | 2.36.23 | IRAS 055096956 | 8250 | 9.010-5 |
| 055133.60711933.9 | 14.06.06 | 11.28.05 | 9.03.05 | 7.01.05 | 3.87.11 | 3.38.26 | IRAS 055227120 | 5200 | 4.410-5 |
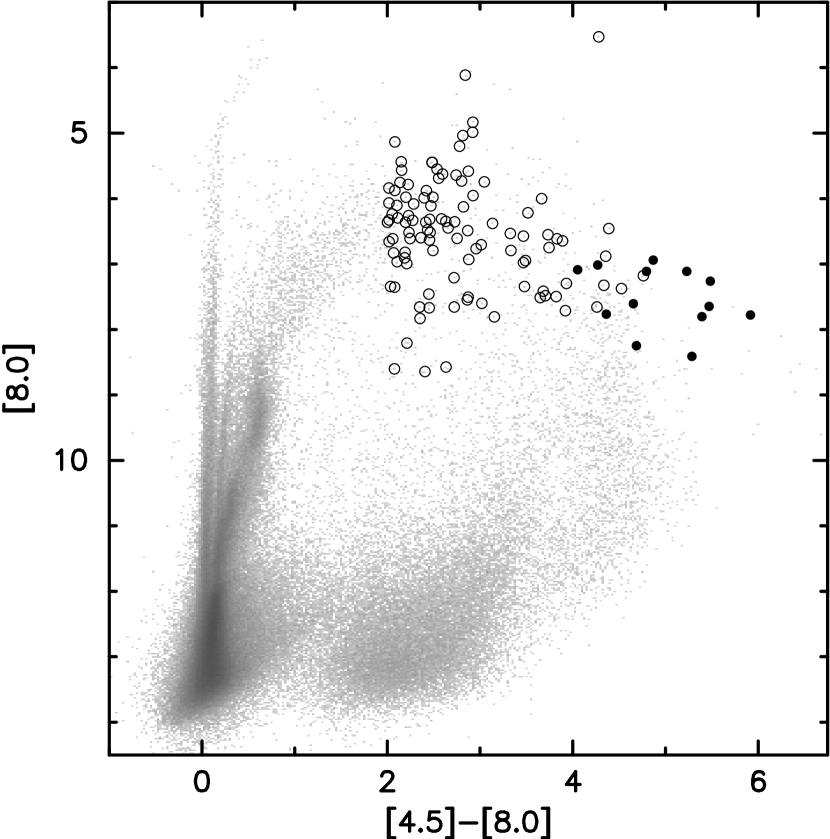
Spitzer observations of the EROs, from SAGE (Meixner et al., 2006), were made with the InfraRed Array Camera (IRAC; Fazio et al., 2004) and the Multiband Imaging Photometer for Spitzer (MIPS; Rieke et al., 2004). Aperture photometry of the EROs was obtained for the IRAC 3.6, 4.5, 5.8, and 8.0 m bands and the MIPS 24 and 70 m bands using the task phot in IRAF. A detailed description of the data reduction, photometric extraction, and uncertainties can be found in Gruendl & Chu (2008). When multiple observations were available, the photometric measurements were averaged. Table 1 presents the average photometric results: column 1 lists source names that provide epoch 2000 coordinates, columns 2–7 give flux densities and uncertainties at 3.6, 4.5, 5.8, 8.0, 24, and 70 m, and column 8 gives cross-identifications to previously known sources. Figure 1 plots the locations of the EROs in a mid-IR [8.0] vs. [4.5][8.0] color-magnitude diagram along with other red sources classified as evolved stars by Gruendl & Chu (2008). The EROs are at the extreme red end of the tail formed by the evolved stars.
2.2. Complementary Near-Infrared and Optical Photometry
None of the EROs have a counterpart in the 2MASS PSC. Thus, we obtained deeper near-IR observations at and -bands for six of the EROs using the IR Side Port Imager (ISPI; van der Bliek et al., 2004) on the Blanco 4m telescope at the Cerro Tololo Inter-American Observatory in 2007 February. The resulting images have a typical effective exposure time of 300 s and 600 s in the and -bands, respectively, and are flux-calibrated using stars in the 2MASS PSC. The angular resolution of the images is typically 10 and the astrometric accuracy is better than 02. For a more detailed description of the near-IR data reduction, see Gruendl & Chu (2008).
Table 2 presents the near-IR photometry and 3- upper limits for the six EROs observed. Only two EROs, 051301.75693351.0 and 053044.10714300.5, have near-IR counterparts projected within 02 as indicated in the last column of the table. To supplement our ISPI observations, we have used the Magellanic Clouds Point Source Catalog from the InfraRed Survey Facility (IRSF; Kato et al., 2007). This survey has an astrometric accuracy of 01 and 90% completeness limits of 18.5 and 17.4 for mJ and mK, respectively. IRSF sources with spatial coincidence of 1″ or better are also included in Table 2. Only two IRSF sources are within 02 or less from their respective EROs and are the same counterparts identified by our ISPI observations. The other three IRSF sources are included for completeness but are unlikely to be near-IR counterparts to the EROs.
| Source ID | mJ | mK | Offset |
|---|---|---|---|
| [mag] | [mag] | [″] | |
| ISPI Observations | |||
| 050231.49680535.8 | 19.67 | 18.63 | |
| 050405.60682340.3 | 19.84 | 18.60 | |
| 051301.75693351.0 | 16.910.05 | 16.650.06 | 0.2 |
| 052937.89724952.9 | 19.52 | 18.74 | |
| 053044.10714300.5 | 17.790.07 | 16.770.07 | 0.2 |
| 055026.08695603.1 | 19.82 | 18.74 | |
| Possible Counterparts in IRSF Catalog | |||
| 051301.75693351.0 | 16.980.02 | 16.270.06 | 0.1 |
| 051848.36693334.7 | 17.270.03aaDoubtful counterpart | 16.660.12aaDoubtful counterpart | 1.0 |
| 053044.10714300.5 | 18.540.08 | 17.230.22 | 0.2 |
| 052540.63700827.2 | 17.770.04aaDoubtful counterpart | 17.080.17aaDoubtful counterpart | 0.7 |
| 054134.73694209.3 | 19.610.21aaDoubtful counterpart | 16.700.09aaDoubtful counterpart | 0.6 |
To search for optical counterparts, we used the optical photometry from the Magellanic Clouds Photometric Survey (MCPS; Zaritsky et al., 2004) which has an astrometric accuracy of 05 and is generally complete to m20. We find that three EROs have faint (m19) optical sources within 1′′, but are likely unrelated as none have a spatial coincidence better than 07. In Figure 2 we combine all photometric data for each source to get a broad SED extending from the optical to 70 m.

3. IRS Observations
Seven EROs were included in our Spitzer IRS survey of YSOs (PID=40650), which used the Short-Low (SL) modules to obtain spectra over 5.2–14.5 m with spectral resolution () of 64–128, and the Short-High (SH) and Long-High (LH) modules to obtain spectra over 9.9–37.2 m with spectral resolution of 600. Background observations with the same integration times were made in nearby regions with low surface brightnesses in the IRAS 12 and 25 m maps.
To extract spectra, we used the basic calibrated data (BCD) from the Spitzer Science Center’s pipeline. Rogue pixels and flagged data were cleaned using the IRSCLEAN package (ver 1.9). Multiple exposures for each slit position were median averaged. The background was then removed in each module by subtracting the cleaned BCD image data at the background position. For the SL modules, an additional local background was subtracted by differencing the two nod positions. Spectra were extracted using the SMART software (Higdon et al., 2004) with a full aperture extraction for the SH and LH modules and the tapered column point source method for the SL modules. The SH and LH spectra were automatically defringed using the IRSFRINGE package (ver 1.1). To combine all spectra, we used the SL extracted spectra to set the flux level (as their background subtraction was more robust) and then applied a multiplicative scale factor for the SH and LH spectra based on the continuum where the spectra overlapped. The resulting spectra span the wavelength range from 5.2 to 37.2 m. A more detailed description is presented in Seale et al. (2009) which reports the results of our IRS survey of LMC YSO candidates.
4. Results
Figure 3 presents the IRS spectra of seven EROs along with the IRAC and MIPS mid-IR photometry. Clearly, these spectra are dominated by dust continuum emission. Interestingly, the 11.3 m SiC feature is detected in absorption in nearly all spectra; in Figure 3 the spectra have been ordered from top to bottom based on the strength of the SiC absorption feature. In addition, the C2H2 (acetylene) 13.7 m absorption feature appears in every spectrum, and the C2H2 7.5 m absorption feature appears in some spectra. In contrast, the MgS emission feature at 26 m is clearly detected in the spectrum of 055026.08695603.1 and possibly in that of 052937.89724952.9. Finally, we note that the only source without SiC absorption, 051811.70703027.0, has a nearly featureless spectrum similar to AFGL 618 (the Westbrook Nebula) a carbon-rich protoplanetary nebula (Kraemer et al., 2002; Cernicharo et al., 2001a, b).

4.1. Mass-Loss Rates
The extreme red colors of these EROs, [8.0][24]= 3–5, suggest that they have high opacities and hence high mass-loss rates, . Simple fits to the mid-IR SEDs of the EROs give bolometric luminosities in the range of 4–11103 (for a distance of 50 kpc; Feast, 1999). Preliminary analysis using the radiative transfer model DUSTY (Ivezic & Elitzur, 1995) shows that the highest optical depths () are found for 054859.98703322.5, with ’s of 270, 8.1, and 10.0 at 1, 10 and 11.3 m, respectively. Assuming a gas-to-dust ratio of 200, the estimated are in the range of 0.4– yr-1 (see Table 1). We have adjusted values of from other works to reflect a gas-to-dust ratio of 200.
Our derived values for are higher than previously known for carbon-rich AGB stars in the LMC. Furthermore, these 13 sources more than double the previously known 8 carbon-rich AGB stars in the LMC with higher than 10-5 yr-1 (van Loon et al., 1999; Groenewegen et al., 2007). More intriguingly, these sources typically exceed the maximum expected for both oxygen-rich and carbon-rich AGB stars (van Loon et al., 1999). For example, the of 054859.98703322.5, 2.310-4 yr-1, is much higher than the maximum expected for its bolometric luminosity, yr-1.
Comparisons of carbon stars in the Magellanic Clouds and the Galaxy show that does not depend on metallicity (Matsuura et al., 2005; Sloan et al., 2008), because depends on the amount of carbon available in the atmosphere, which is ultimately synthesized within these stars. These new extreme carbon stars show that the highest found in the LMC are comparable to those of their Galactic counterparts (e.g., Speck et al., 2008). The mean bolometric luminosity of the EROs, 7,100 , corresponds to main-sequence masses of 1.5–2.5 (using Fig. 20 in Vassiliadis & Wood, 1993), where the lower limit is set by the mass range to become carbon stars (1.5–5.0 ). It is puzzling that such low-mass stars could reach the highest . This might be caused by some specific combinations of abundance and pressure–temperature profile in the stellar atmosphere, resulting in an unusual condensation sequence (Lodders & Fegley, 1995). It is also possible that a carbon-rich dust disk is responsible for the SiC absorption then the based on a spherical symmetry is not valid. These possibilities will be considered in greater detail in future work.
4.2. Spectral Features
The occurrence of SiC absorption features is surprising. These features are rare in Galactic extreme carbon stars, with only two unambiguous detections (Speck et al., 1997) and another 8 more tentative detections (Pitman, Speck & Hofmeister, 2006; Speck et al., 2008). This raises the question of why the SiC absorption feature is seemingly common in the LMC extreme carbon stars.
Recent Spitzer observations show that planetary nebulae (PNe) in the LMC often show strong SiC emission (Stanghellini et al., 2007; Bernard-Salas et al., 2008), while in Galactic PNe, it is generally weak (Barlow, 1983; Rinehart et al., 2002). The presence of SiC features in EROs and PNe in the LMC suggests that (a) SiC grains are formed more abundantly in the LMC than previous recognized (e.g., Zijlstra et al., 2006); and (b) that the LMC metallicity allows SiC to form and survive in the late AGB phase and into the PN phase more efficiently than in the Galaxy. It has been hypothesized by Leisenring et al. (2008) that MgS tends to form as a mantle on pre-existing SiC grains and gives rise to the emission feature at 30 m. This hypothesis is supported by a recent study of the correlation between mass-loss rate and the amount of SiC required to model Galactic extreme carbon star spectra (Speck et al., 2008). Only two of the LMC EROs show evidence for a MgS feature at 30 m indicating that the SiC grains may not be coated for some of these objects. Current models for the effect of metallicity on condensation sequences in the Galaxy and the Magellanic Clouds (e.g., Lagadec et al., 2007; Leisenring et al., 2008; Speck et al., 2006) need to be re-analyzed in light of this discovery.
References
- Barlow (1983) Barlow, M. J., 1983, IN: Planetary nebulae; Proceedings of the Symposium, London, England, Dordrecht, D. Reidel Publishing Co., 105
- Benjamin et al. (2003) Benjamin, R. A., et al. 2003, PASP, 115, 953
- Bernard-Salas et al. (2008) Bernard-Salas, J., et al. 2008, in preparation.
- Cernicharo et al. (2001a) Cernicharo, J., Heras, A. M., Tielens, A. G. G. M., Pardo, J. R., Herpin, F., Guélin, M., & Waters, L. B. F. M. 2001a, ApJ, 546, L123
- Cernicharo et al. (2001b) Cernicharo, J., et al. 2001b, ApJ, 546, L127
- Fazio et al. (2004) Fazio, G., et al. 2004, ApJS, 154, 10
- Feast (1999) Feast, M. 1999, New Views of the Magellanic Clouds, IAU Symp. 190, 542
- Groenewegen et al. (2007) Groenewegen, M. A. T., et al. 2007, MNRAS, 376, 313
- Gruendl & Chu (2008) Gruendl, R. A., & Chu, Y.-H. 2008, ApJS, submitted.
- Higdon et al. (2004) Higdon, S. J. U., et al. 2004, PASP, 116, 975
- Houck et al. (2004) Houck, J. R., et al. 2004, ApJS, 154, 18
- Ivezic & Elitzur (1995) Ivezic, Z., & Elitzur, M. 1995, ApJ, 445, 415
- Kato et al. (2007) Kato, D., et al. 2007, PASJ, 59, 615
- Kraemer et al. (2002) Kraemer, K. E., Sloan, G. C., Price, S. D., & Walker, H. J. 2002, ApJS, 140, 389
- Lagadec et al. (2007) Lagadec, E. et al., 2007, MNRAS, 376, 1270
- Leisenring et al. (2008) Leisenring, J. M., Kemper, F., Sloan, G. C., 2008, ApJ, 681, 1557
- Lodders & Fegley (1995) Lodders, K., & Fegley, B., Jr. 1995, Meteoritics, 30, 661
- Lonsdale et al. (2003) Lonsdale, C. J., et al. 2003, PASP 115, 897
- Loup et al. (1997) Loup, C., Zijlstra, A. A., Waters, L. B. F. M., & Groenewegen, M. A. T. 1997, A&AS, 125, 419
- Matsuura et al. (2005) Matsuura M., et al. 2005, A&A, 434, 691
- Meixner et al. (2006) Meixner, M., et al. 2006, AJ, 132, 2268
- Pitman, Speck & Hofmeister (2006) Pitman, K. M., Speck, A. K., Hofmeister, A. M., 2006, MNRAS, 371, 1744
- Rieke et al. (2004) Rieke, G. H., et al. 2004, ApJS, 154, 25
- Rinehart et al. (2002) Rinehart, S. A., Houck, J. R., Smith, J. D., Wilson, J. C., 2002, MNRAS, 336, 66
- Schwering (1989) Schwering, P. B. W. 1989, A&AS, 79, 105
- Seale et al. (2009) Seale, J. P., et al. 2009, in preparation
- Skrutskie et al. (2006) Skrutskie, M. F. et al. 2006, AJ, 131, 1163
- Sloan et al. (2008) Sloan, G. C., Kraemer, K. E., Wood, P. R., Zijlstra, A. A., Bernard-Salas, J., Devost, D., & Houck, J. R. 2008, ArXiv e-prints, 807, arXiv:0807.2998
- Speck et al. (1997) Speck, A. K., Barlow, M. J., & Skinner, C. J. 1997, MNRAS, 288
- Speck et al. (2006) Speck, A. K., et al. 2006, ApJ, 650, 892
- Speck et al. (2008) Speck, A. K., Corman, A. B, Wheeler, C. H, Wakeman, K. Thompson, G. D., 2008, ApJ, in review
- Stanghellini et al. (2007) Stanghellini, L., et al. 2007, ApJ, 671, 1669
- Vassiliadis & Wood (1993) Vassiliadis E., & Wood P. R., 1993, ApJ, 413, 641
- van der Bliek et al. (2004) van der Bliek, N. S., et al. 2004, Proc. SPIE, 5492, 1582
- van Loon et al. (1999) van Loon J.Th, et al. 1999, A&A, 351, 559
- Whitney et al. (2008) Whitney, B. A. et al. 2008, AJ, 136, 18
- Zaritsky et al. (2004) Zaritsky, D., Harris, J., Thompson, I. B., & Grebel, E. K. 2004, AJ, 128, 1606
- Zijlstra et al. (2006) Zijlstra, A., et al. , 2006, MNRAS, 370, 1961