1\Yearpublication2009\Yearsubmission2005\Month11\Volume999\Issue88
later
Sigma-drop in galaxies and the sigma-metallicity degeneracy
Abstract
In some galaxies, the central velocity dispersion, , is depressed with respect to the surroundings. This sigma-drop phenomenon may have different physical origins, bearing information about the internal dynamics of the host galaxy. In this article, we stress the importance also of observational artifacts due to the -metallicity degeneracy: when a spectrum of a population is compared with a template of miss-matched metallicity, the velocity dispersion may be wrongly estimated. A sigma-drop may appear in place of a metallicity peak. The discussion is illustrated using VLT/FORS spectra of diffuse elliptical galaxies. Some of the sigma-drop galaxies reported in the literature may be analysis artifacts.
keywords:
Stellar populations – Internal kinematics – Metallicity – Galaxies1 Introduction
In a fraction of galaxies, mostly spirals but also ellipticals, the velocity dispersion is depressed in the center (e. g. Comerón et al., 2008). However, simple density profile models, like the de Vaucouleurs profile, predict a continued increase inwards. In the very center, approaching the central massive black hole, a further steep increase is even expected (Dressler & Richstone, 1990).
These observed -drops may have various physical explanations. They may indicate the absence of a central mass concentration (Dressler & Richstone, 1990) or more generally a flat density core. The latter is certainly expected in diffuse elliptical galaxies (dE) with shallow density profiles, flatter than exponential. Such examples may be found in Simien & Prugniel (2002). Still, in the list of -drop galaxies, the spiral galaxies are the majority and since the stellar kinematics is less studied in spirals it is quite probable that most of the -drops occur in spirals. Some studies suggest up to 50 % of -drops among the spirals (Comerón et al., 2008).
In spiral galaxies, a -drop may result from a young stellar population formed from a rotating gas disk funneled toward the center by the dynamical action of a bar (Wozniak et al., 2003). Simulations show that this feature may persist 1 Gyr until the newborn population mixes with the underlying population and its luminosity fades. A sustained gas supply and star formation may produce a long-lived cold stellar disk.
In this article we investigate another phenomenon affecting the detection of -drop galaxies: the -metallicity degeneracy.
2 Analysis of line-of-sight integrated spectra
To study the internal kinematics of a stellar population, an observation is compared to a template (an observed star or a population model) having the same intrinsic broadening (due to the spectrograph) and no physical broadening. The relative broadening between the two is the physical velocity dispersion. Various algorithms for measuring the internal kinematics, or line-of-sight velocity distribution (LOSVD) are available (for example Cappellari & Emsellem, 2004). They search for the optimal convolution kernel (Gaussian or Gauss-Hermite expansion) that allows to transform the cold template into the observation. But the historical algorithms, cross-correlation (Tonry & Davis, 1979), Fourier quotient (Sargent et al., 1977) or their variants as the Fourier correlation quotient (Bender, 1990) have difficulties to handle properly the noise and outliers in the signal. Preferred methods, nowadays, perform the fits in pixel space (e. g. Cappellari & Emsellem, 2004).
Whatever the algorithm that is used, one of the key issues is to find a template that matches the observation. It is known for a long time that the determined velocity dispersion depends of the spectral type and metallicity of the stellar template (e. g. Bender, 1990). Some studies use different stellar templates and average the results, this also washes out variations of the intrinsic resolution of the spectrograph. Others try to properly match the template, in particular its metallicity, or to use a linear combination of several templates (optimal template fitting).
The templates are commonly stars observed using the same setup as for the galaxy. But is is also possible to use spectra from stellar libraries, or even synthetic population templates (Vazdekis, 1999). This suppresses the need to observe a large number of reference stars, but adds the difficulty of injecting in the template spectrum the line-spread function (LSF) of the spectrograph relative to the template (Koleva et al., 2008b).
In the present article we are using the ULySS package (soon available on-line Koleva et al., 2008a) that fits a spectrum in pixel space. This package contains the tools to analyze the relative LSF, and it matches the observation with either a stellar or stellar-population spectrum after injecting this LSF. In this work, the fit will be made using population models – PegaseHR, (Le Borgne et al., 2004) with Elodie.3.1 (Prugniel & Soubiran, 2001; Prugniel et al., 2007) – parametrized with their age and metallicity. Hence, the LOSVD ( and ), age and metallicity are simultaneously determined.
This optimization is made for each spectrum. It means that for a long-slit observation we measure at once the kinematical and population profiles (Figure 2).

3 The -metallicity degeneracy
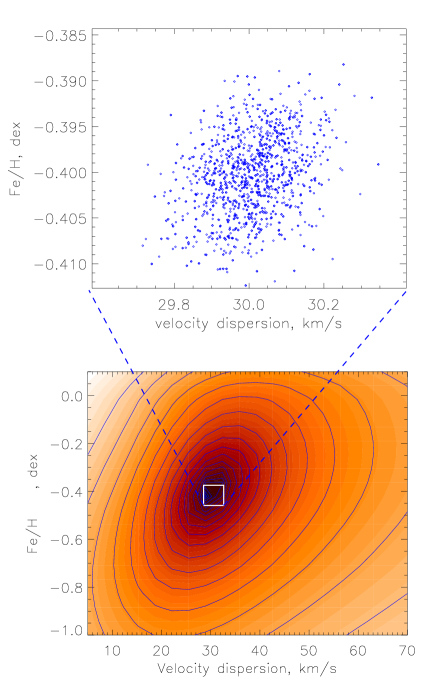
It is known, or at least suspected, for a long time that the metallicity mismatch biases the measurement (Laird & Levison, 1985), but this effect has been widely overlooked. The -metallicity degeneracy was studied in Koleva et al. (2007) and the magnitude of the effect was established from Monte-Carlo simulations. The intuitive explanation for this effect is that if the metallicity of the template is lower than that of the galaxy, its metallic lines are less deep than those of the observations, and the minimization program compensates the mismatch by decreasing (which in turn increases the depth of the absorption lines). Figure 1 presents a Monte-Carlo experiment and a map illustrating this effect. This degeneracy may be written as:

Where is in km/s, and in dex. A 0.1 dex mismatch of the metallicity results in a 4% error on the velocity dispersion. This approximate formula was determined from simulations and is valid within 30% for a wide range of parameters. The effect is stronger for smaller velocity dispersions and younger ages.
If a long-slit spectrum is analyzed with a fixed template, a central peak of metallicity will be compensated by an underestimated . If the intrinsic profile is shallow, the fitted profile may possibly display a -drop.
To illustrate this question we analyze below high quality long-slit observations of a sample of dEs obtained with FORS1 at the VLT. Figure 2 shows the LOSVD and population profiles in the center of 3 galaxies. The metallicity peaks in the center, while the age is dropping (this is an analysis with a single stellar population, the real stellar mix is certainly more complex, see Koleva et al. in preparation). The profile does not show prominent systematics (note that the instrumental velocity dispersion of these observations is 64 km/s. The reported values are still uncertain because we did not yet study the variations of the spectrograph resolution with time and seeing).
These galaxies, with peaked metallicity, are exactly the configuration where a single metallicity template would bias . To demonstrate it, Fig. 3 repeats the analysis of FCC150 with a fixed metallicity and then fixed age and metallicity. Fixing the metallicity inverts the age trend in the center: it becomes a peak instead of a drop. This is a consequence of the well known age-metallicity degeneracy, the underestimated metallicity is balanced with an older age. But at the same time the profile displays a clear minimum in the center. Fixing both the age and the metallicity increases again the -drop.
The last panel of Fig. 3 presents a test where an additive polynomial was included in the model. Such a trick is often used in the programs measuring the kinematics in order to absorb the template mismatch. We see that this method is efficient: The artificial -drop is removed.
A classical fixed template analysis would detect an artificial -drop even with data of quite lower quality.
4 Conclusion
We have shown that some -drops may be artifacts of the analysis method. They may result from a peak in the metallicity, which is actually often expected in the centers of the galaxies.
This naturally does not mean that all the -drops are of this nature, but that individual observations must be examined with caution. One has to ask the questions: (i) Is the analysis made with a fixed-metallicity template, or with an additive polynomial? (ii) Is the magnitude of the effect comparable with the sigma-metallicity degeneracy?
In the literature, we found two samples of -drop galaxies: Emsellem (2008) and Comerón et al. (2008). Half of the 20 -drop galaxies were detected in various studies using fixed-metallicity templates and the magnitude of the drops are generally consistent with them resulting from the sigma-metallicity degeneracy. Some of these studies are reducing the mismatch with an additive term, but it is difficult to determine their reliability without testing the actual analysis program.
Only recent studies, like Dumas et al. (2007), Emsellem et al. (2001), and some other based on SAURON data use an optimal template fit to each single spectrum. Unfortunately they use as a reference the Jones (1998) stellar library which has a limited coverage in metallicity and may therefore not match perfectly the observations.
We conclude that the fraction of -drop is certainlyoverestimated, and that the -metallicity degeneracy should not be neglected. Fitting in the same time the kinematics and the chemical characteristics of the population is definitely the best solution to correctly reconstruct stellar population properties.
Acknowledgements.
Mina Koleva acknowledges the financial support of the meeting organizers.References
- Bender (1990) Bender, R.: 1990, A&A, 229, 441
- Cappellari & Emsellem (2004) Cappellari, M. & Emsellem, E.: 2004, PASP, 116, 138
- Comerón et al. (2008) Comerón, S., Knapen, J. H., & Beckman, J. E.: 2008, A&A, 485, 695
- Dressler & Richstone (1990) Dressler, A. & Richstone, D. O.: 1990, ApJ, 348, 120
- Dumas et al. (2007) Dumas, G., Mundell, C. G., Emsellem, E., & Nagar, N. M.: 2007, MNRAS, 379, 1249
- Emsellem (2008) Emsellem, E.: 2008, in Mapping the Galaxy and Nearby Galaxies, ed. K. Wada & F. Combes, 139–+
- Emsellem et al. (2001) Emsellem, E., Greusard, D., Combes, F., et al.: 2001, A&A, 368, 52
- Jones (1998) Jones, L. A.: 1998, PhD thesis, AA(The University of North Carolina at Chapel Hill)
- Koleva et al. (2007) Koleva, M., Bavouzet, N., Chilingarian, I., & Prugniel, P.: 2007, in Science Perspectives for 3D Spectroscopy, ed. M. Kissler-Patig, J. R. Walsh, & M. M. Roth, 153–+
- Koleva et al. (2008a) Koleva, M., Prugniel, P., Bouchard, A., & Wu, Y.: 2008a, in prep.
- Koleva et al. (2008b) Koleva, M., Prugniel, P., Ocvirk, P., Le Borgne, D., & Soubiran, C.: 2008b, MNRAS, 385, 1998
- Laird & Levison (1985) Laird, J. B. & Levison, H. F.: 1985, AJ, 90, 2652
- Le Borgne et al. (2004) Le Borgne, D., Rocca-Volmerange, B., Prugniel, P., et al.: 2004, A&A, 425, 881
- Prugniel & Soubiran (2001) Prugniel, P. & Soubiran, C.: 2001, A&A, 369, 1048
- Prugniel et al. (2007) Prugniel, P., Soubiran, C., Koleva, M., & Le Borgne, D.: 2007, ArXiv Astrophysics e-prints: astro-ph/0703658
- Sargent et al. (1977) Sargent, W. L. W., Schechter, P. L., Boksenberg, A., & Shortridge, K.: 1977, ApJ, 212, 326
- Simien & Prugniel (2002) Simien, F. & Prugniel, P.: 2002, A&A, 384, 371
- Tonry & Davis (1979) Tonry, J. & Davis, M.: 1979, AJ, 84, 1511
- Vazdekis (1999) Vazdekis, A.: 1999, ApJ, 513, 224
- Wozniak et al. (2003) Wozniak, H., Combes, F., Emsellem, E., & Friedli, D.: 2003, A&A, 409, 469