Energy and system dependence of high- triggered two-particle near-side correlations
Abstract
Previous studies have indicated that the near-side peak of high- triggered correlations can be decomposed into two parts, the Jet and the Ridge. We present data on the yield per trigger of the Jet and the Ridge from , and collisions at = 62.4 GeV and 200 GeV and compare data on the Jet to PYTHIA 8.1 simulations for . PYTHIA describes the Jet component up to a scaling factor, meaning that PYTHIA can provide a better understanding of the Ridge by giving insight into the effects of the kinematic cuts. We present collision energy and system dependence of the Ridge yield, which should help distinguish models for the production mechanism of the Ridge.
pacs:
25.75.-qRelativistic heavy-ion collisions and 21.65.QrQuark matter and 24.85.+pQuarks, gluons, and QCD in nuclear reactions and 25.75.BhHard scattering in relativistic heavy ion collisions1 Introduction
Previous studies in collisions at = 200 GeV demonstrated that the near-side peak in high- triggered correlations can be decomposed into two structures. The Jet is narrow in both azimuth () and pseudorapidity (), similar to what is observed in , while the Ridge is narrow in azimuth but broad in pseudorapidity. The Jet component is similar to that expected from vacuum fragmentation, whereas the Ridge has properties similar to the bulk Jana ; Joern . Comparing data from and collisions at = 62.4 GeV and = 200 GeV tests whether these conclusions hold for other collision systems and energies.
Several mechanisms have been proposed for the production of the Ridge LongFlow ; MomentumKick ; Reco ; Sergei ; PlasmaInstability . These models have yielded few calculations which can be directly compared to data, in part because of the large number of factors which must be considered when theoretically calculating the experimentally measured quantitites. The results presented here should provide a good test of models for the production of the Jet and Ridge because trends expected with changing collision energy and in nuclei collided in a given model should be easier to calculate theoretically.
2 Method
Data from the STAR detector from year 3 collisions as = 200 GeV, year 4 collisions at = 62.4 GeV and = 200 GeV, and year 5 collisions at = 62.4 GeV and = 200 GeV were used for the comparison of collision systems and energies. Details of the STAR detector can be found in STARNIM . The primary detector used for these analyses was the STAR Time Projection Chamber (TPC.)
A high transverse momentum () particle is selected and the distribution of other particles in the event relative to that trigger particle in azimuth () and pseudorapidity () was determined. The of the trigger and associated particles was restricted in order to reduce the soft background; unless otherwise mentioned GeV/c and GeV/c. is normalized by the number of trigger particles. This was corrected for the single particle efficiency and for detector acceptance, which is dependent on the collision system and energy, , , , and collision multiplicity. Except for studies of dependence, the data at both energies are for 0-60% centrality, data at = 62.4 GeV are for 0-80% centrality, and data at = 200 GeV are for 0-10% centrality. data are minimum bias.
The yield measured is the number of particles associated with the trigger particle within limits on and . The Ridge was previously observed to be roughly independent of within the acceptance of the STAR TPC Joern . To extract the yield it is assumed that the Ridge is independent of . Previous studies have demonstrated that the Jet component extends to = 0.75 in the range studied here and that limited detector acceptance limits studies to 1.75 Jana ; Joern ; MeSQM . To determine the Jet yield , the projection of the distribution of particles is taken in two different ranges in pseudorapidity:
=
+
=
where the former contains only the Ridge and the latter contains both the Jet and the Ridge. The jet-like yield on the near-side is the integral over :
= .
The factor in front of the second term is the ratio of the width in the region containing the Jet and the Ridge to the width of the region containing only the Ridge. With this method for subtracting the Ridge contribution to , the systematic errors due to cancel out assuming that is roughly independent of , a reasonable assumption in the mid-rapidity range based on the available data phobosFlow1 ; phobosFlow2 . It is also assumed that the Ridge is independent of .
To determine the integration is done over the entire region to minimize the effects of statistical fluctuations in the determination of the background:
= - .
The integration over is done by fitting a Gaussian to the near-side. This partially compensates for a detector effect which causes lost tracks at 0 and 0; this effect is less than 10% in the range studied here Marek .
The raw signal has a background due to particles correlated indirectly with each other in azimuth due to their correlation with the reaction plane. This random background is given by
where is the second order harmonic in a Fourier expansion of the momentum anisotropy relative to the reaction plane, and must be subtracted in order to study the component associated with the jet. Systematic errors come from the errors on B, and . It is assumed that is the same for events with a trigger particle as for minimum bias events and that is roughly independent of . For each data set was fit in centrality bins to determine and . Details of the subtraction for collisions at = 200 GeV are given in Jana and for collisions at = 200 GeV in MeSQM . For collisions at = 62.4 GeV, the using the reaction plane as determined from tracks in the Forward Time Projection Chamber was used as the nominal value and the lower bound was determined from a multiplicity-dependent approximation as described for = 200 GeV in MeSQM . For collisions at = 62.4 GeV, and its systematic errors were taken from AuAuSixtyTwoFlow . B is fixed using the ZYAM method starZYAM .
PYTHIA 8.1 was used to simulate collisions for comparisons to . A trigger particle was selected and the distribution of particles in azimuth was calculated, as in the experimental measurements. The yield was determined as the number of charged hadrons in the range . For comparisons to data identical limits on and were applied. The minimum is the parameter in PYTHIA for the transverse momentum in the hard subprocess PYTHIAManual . A minimum value of = 0.1 GeV/c was used and events were simulated to ensure that the minimum did not affect the yield and that the statistical error was negligible. It was not necessary to study the distribution of particles in pseudorapidity since there is no Ridge in PYTHIA.
3 Results
3.1 The Jet
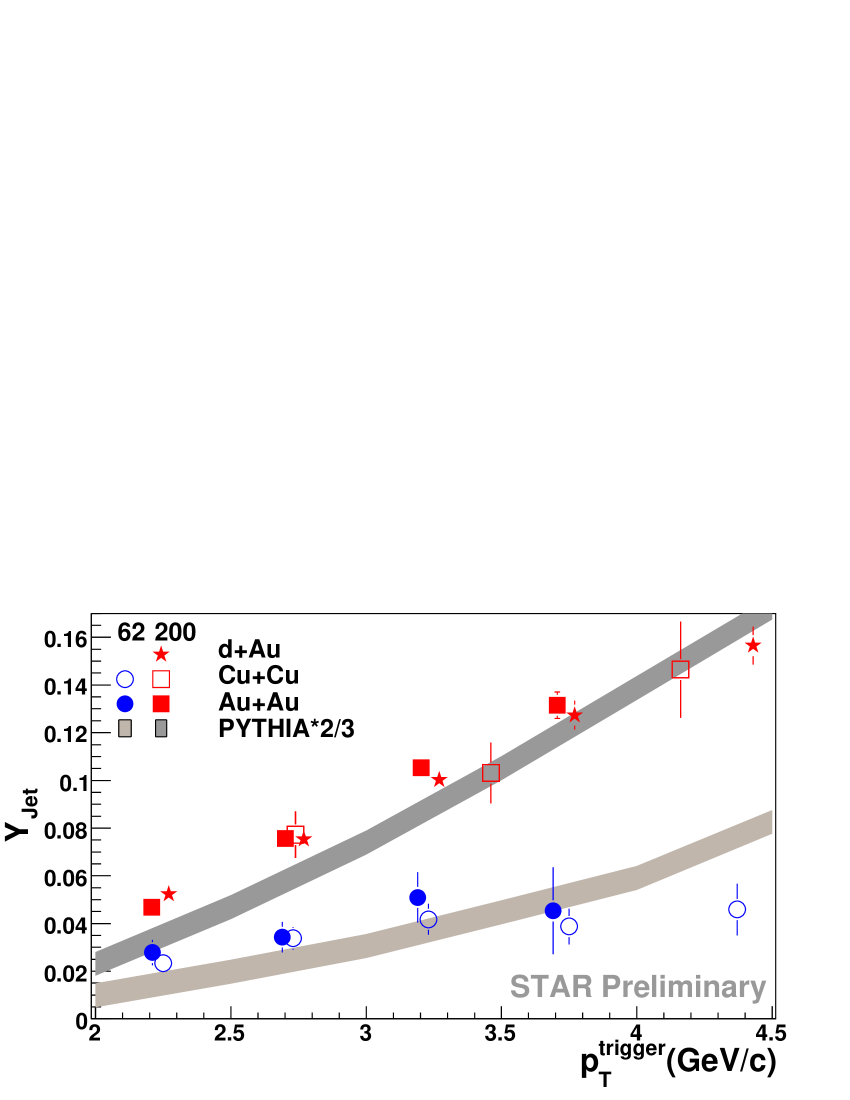
Fig. 1 compares the dependence of on for all systems and energies to the yield from PYTHIA 8.1 scaled by 2/3. An overall scaling factor of 2/3 was applied to the PYTHIA yields to match the data. The need for the scaling factor implies that PYTHIA assumes that too many particles are produced in hard processes, however, kinematic effects should still be reflected accurately in PYTHIA. The scaled PYTHIA yield describes the shape of the dependence well, with a few deviations at lower . PYTHIA describes the energy dependence of well, indicating that the energy dependence can be explained as a pQCD effect. If is dominated by pQCD effects, deviations from PYTHIA at lower would be expected. No system dependence is observed in the data, as would be expected for an effect dominated by pQCD.
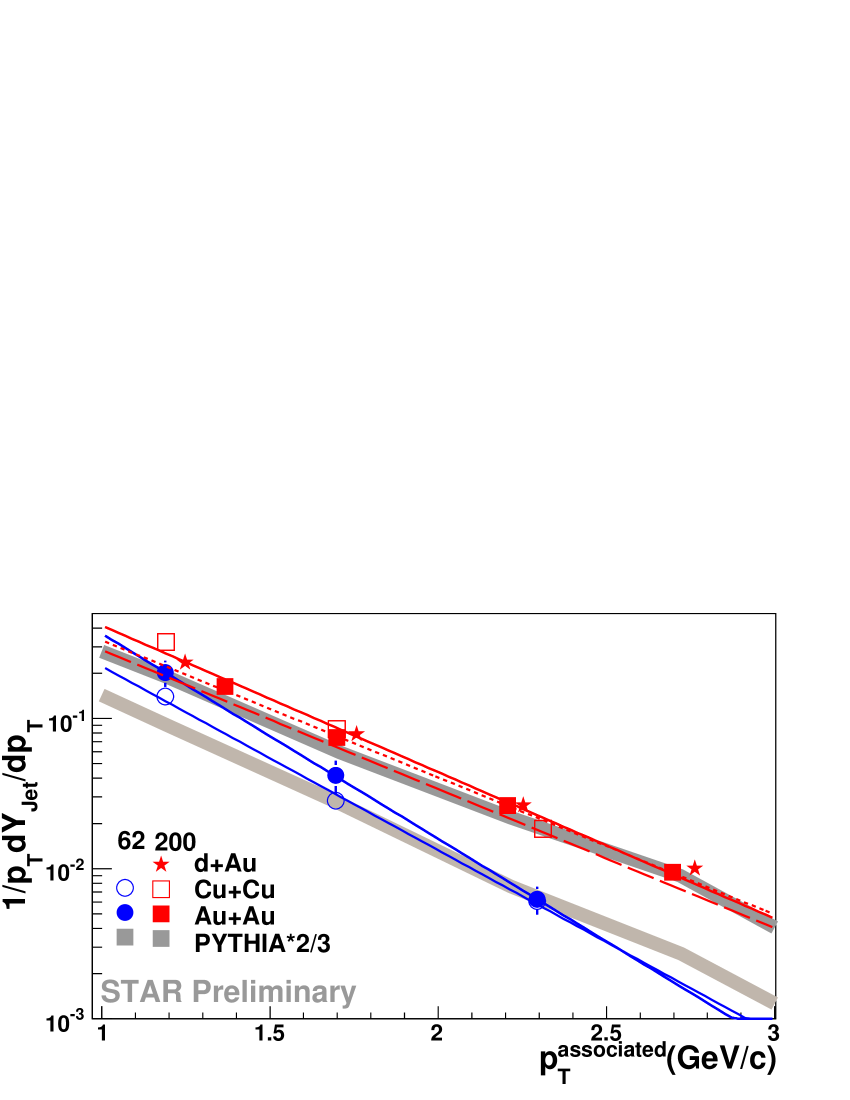
The dependence of on is shown in Fig. 2. As in Fig. 1, the scaled PYTHIA yield describes the shape of the data well and there is no system dependence. The inverse slope parameters from exponential fits to the data and to PYTHIA shown in Tab. 1 likewise support independence on collision system. Slight deviations from the scaled PYTHIA yield at lower in Fig. 2 for collisions at = 62.4 GeV are reflected in the inverse slope parameter, which is higher than that of the data.
| = 62.4 GeV | = 200 GeV | |
| h-h | h-h | |
| Jet | 317 26 | 478 8 |
| Jet | 355 21 | 445 20 |
| Jet | 469 8 | |
| PYTHIA | 424 5 | 473 3 |
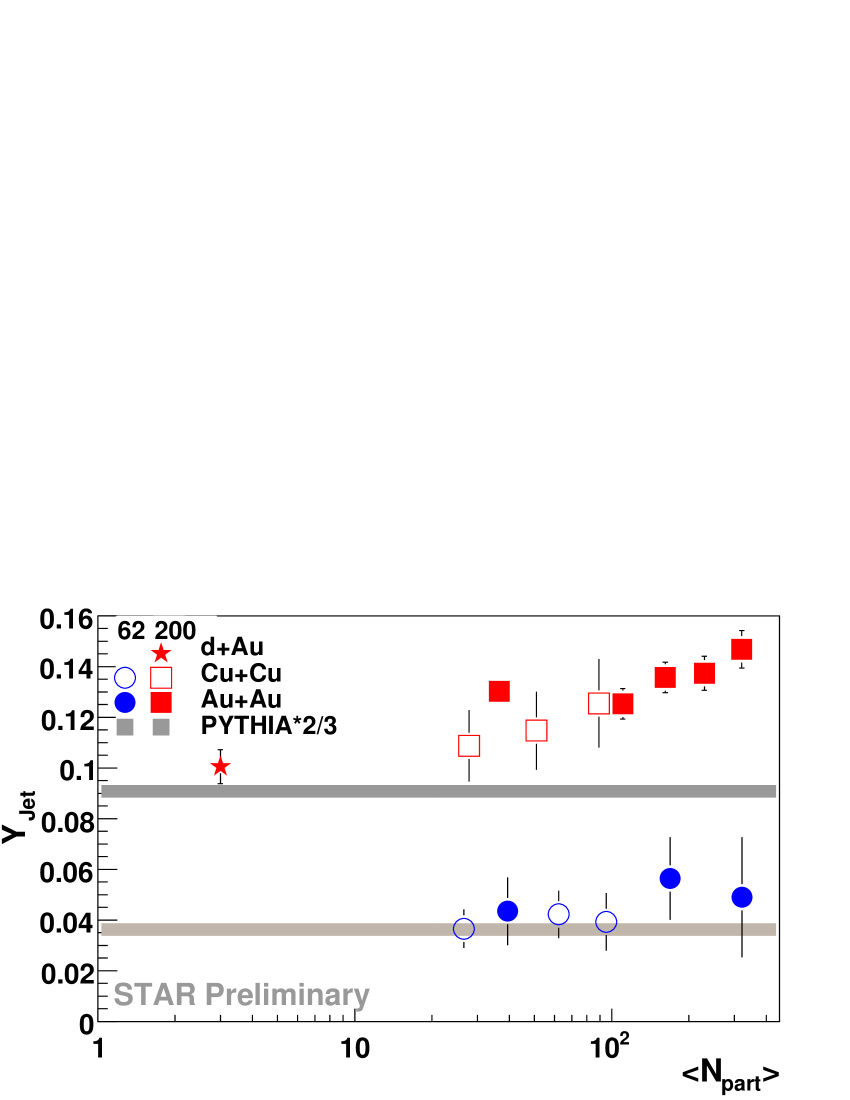
The dependence of is shown in Fig. 3 and compared to the scaled PYTHIA yield. In contrast to measurements at higher ,g which show no depedence, a small increase with is observed. This may be caused by either slight modifications of the Jet which increase with system size or some of the Ridge being misidentified as part of the Jet. If the Ridge were not completely independent of , some of the particles in the Ridge could be associated with the Jet. Since the Ridge has roughly four times as many particles than the Jet in central , this would give a smaller relative error to the Ridge than the Jet. However, the Jet has also been observed to be considerably broader in in collisions than in and collisions Joern ; Marek , which would imply modifications of the Jet in collisions. At this point models for Jet and Ridge production cannot distinguish these mechanisms.
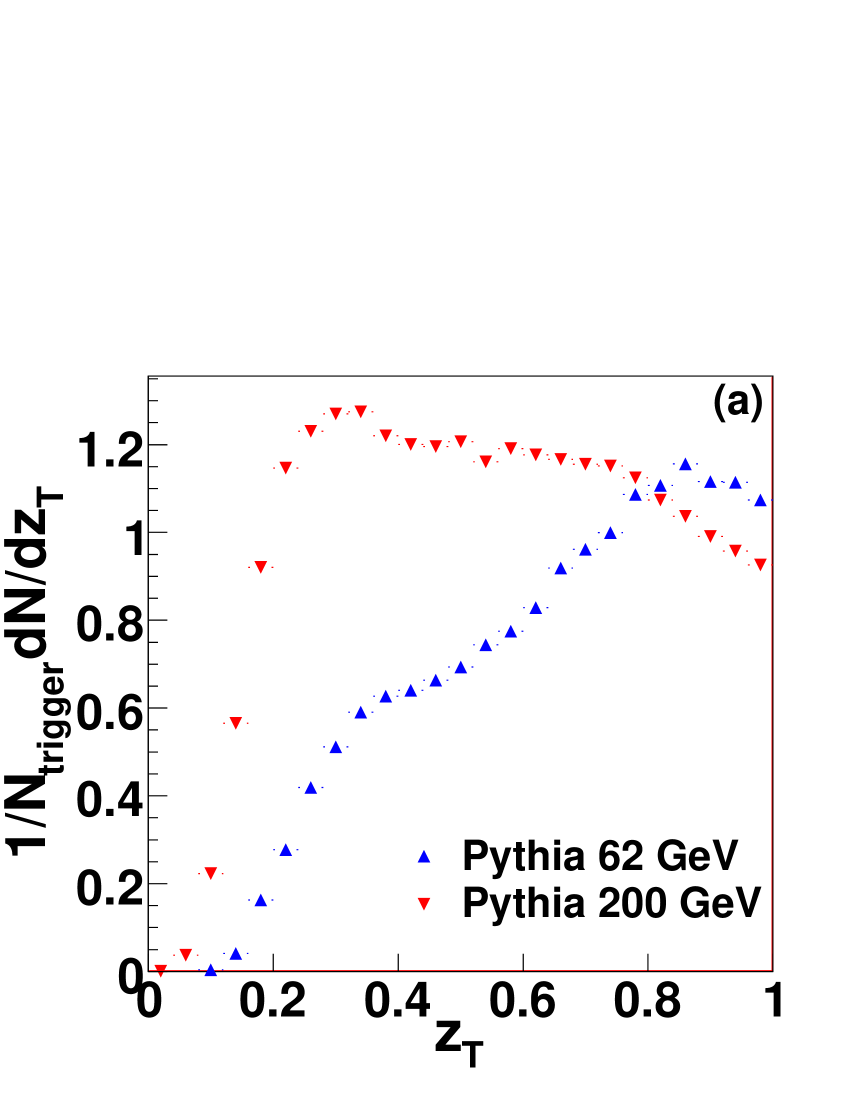
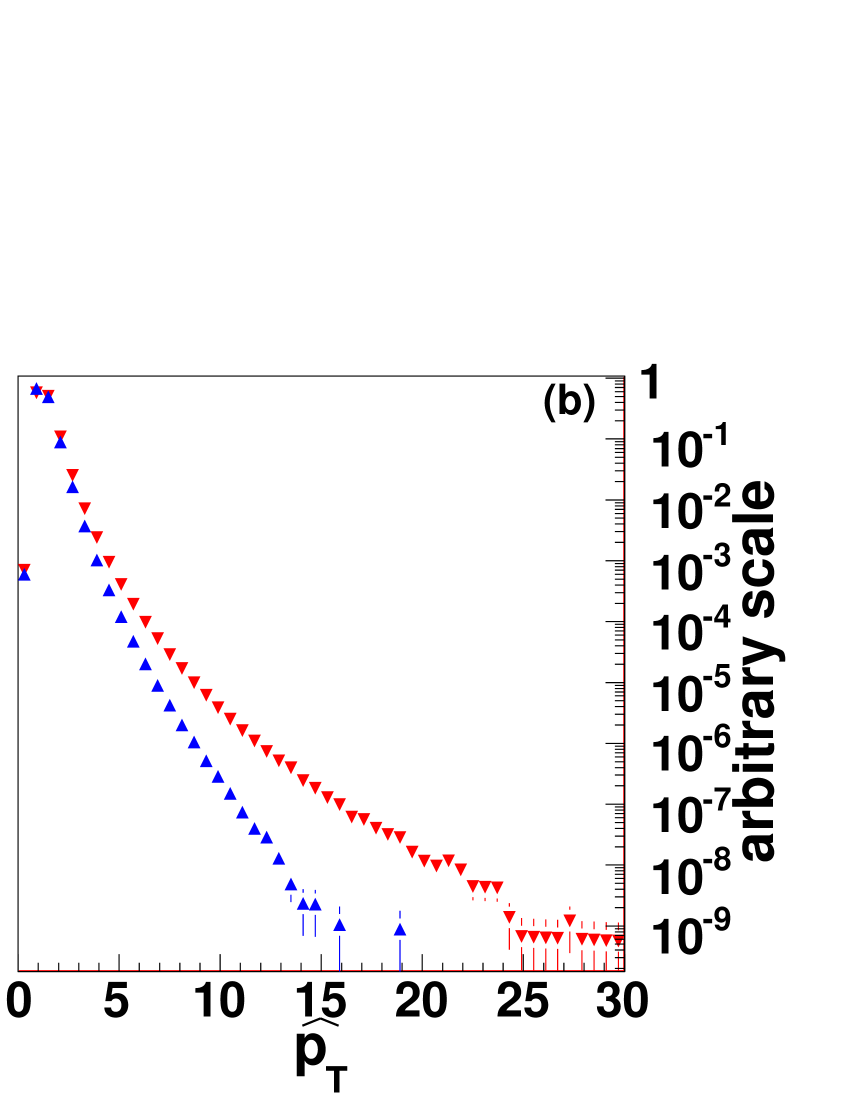
That PYTHIA describes the and dependence of fairly well implies that PYTHIA can be used to approximate the momentum fraction carried by the leading hadron, . Fig. 4 shows the distribution and the distribution of trigger particles in = / predicted by PYTHIA for = 62.4 GeV and = 200 GeV. Fig. 4(a) shows that for the same and , the mean is higher in = 62.4 GeV and therefore the mean jet energy is lower. Fig. 4(b) shows that this is caused by the steeper spectrum at = 62.4 GeV. The lower in collisions at = 62.4 GeV results from the higher mean and is a kinematic effect.
3.2 The Ridge
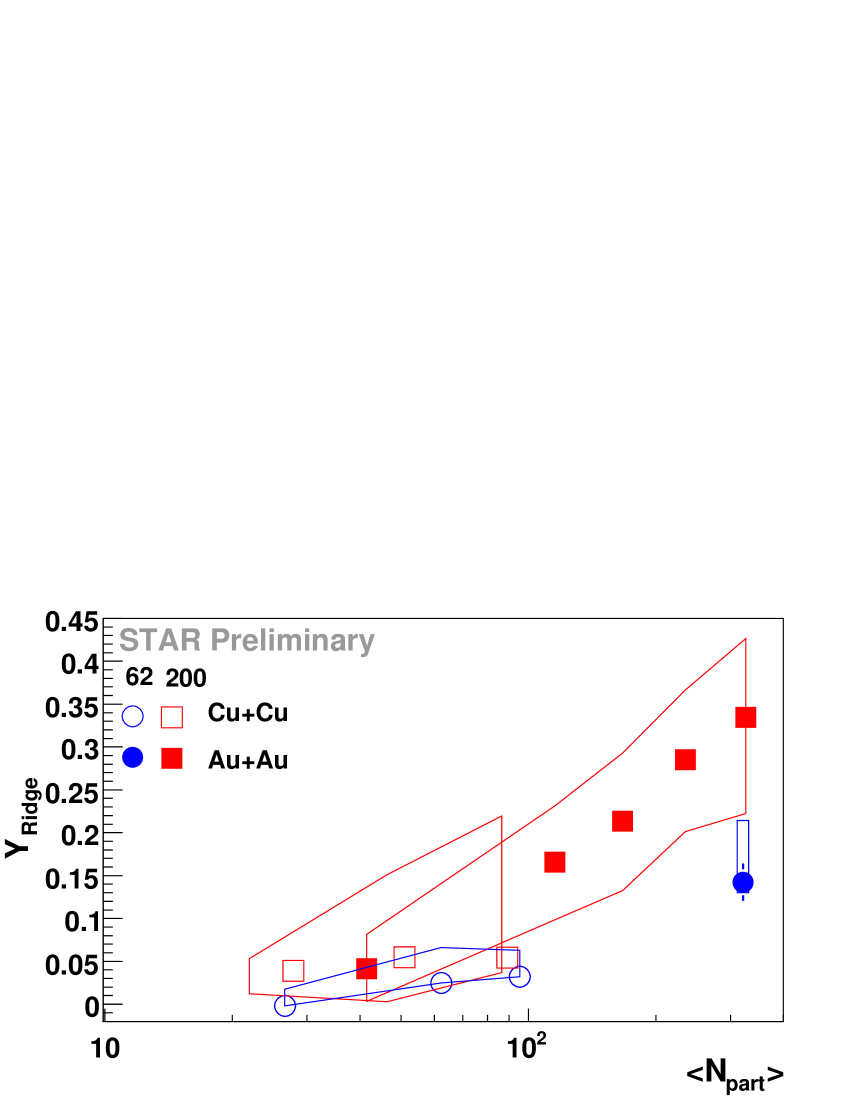
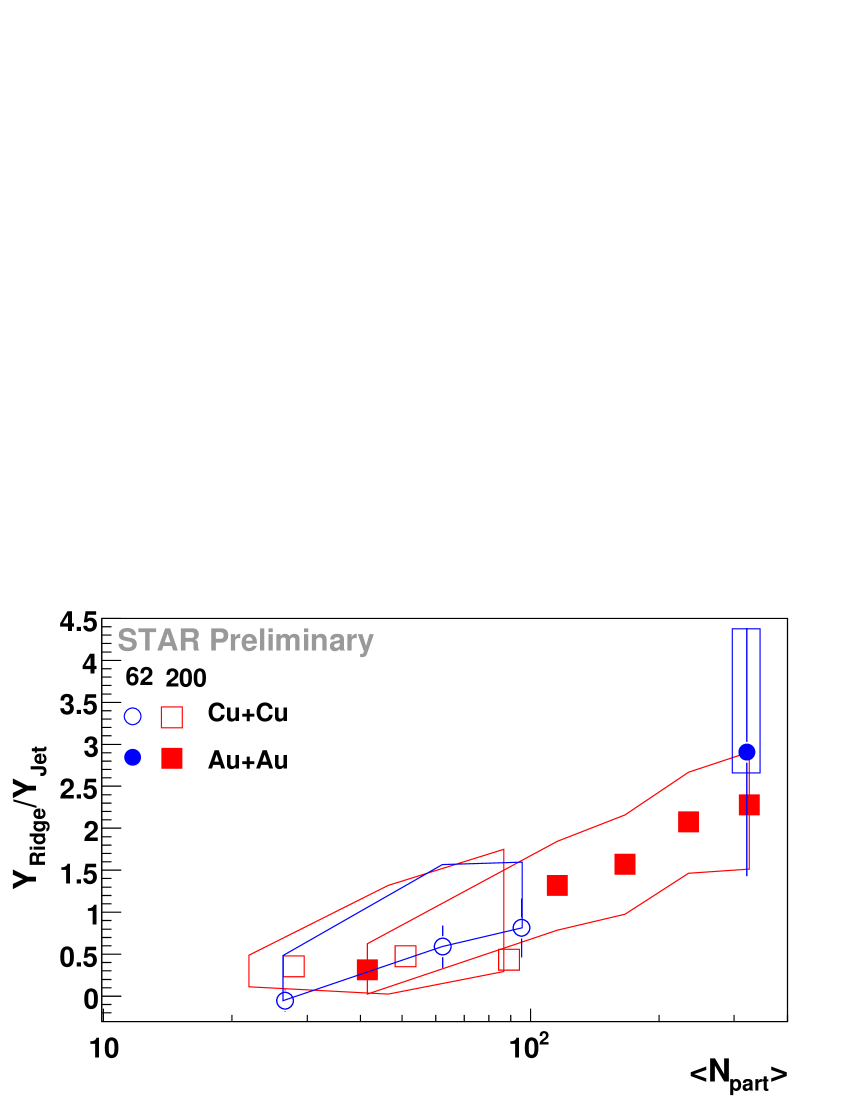
The dependence of on is given in Fig. 5. In collisions at both = 62.4 GeV and = 200 GeV increases with . As seen in Fig. 3, the yield at = 62.4 GeV is considerably smaller than at = 200 GeV. Fig. 6 shows the ratio / and shows that this ratio does not depend on . PYTHIA simulations demonstrated that the data at = 62.4 GeV likely correspond to a lower jet energy, so this implies that decreases with energy just like .
Few models have attempted to make quantitative predictions for . An exception is the momentum kick model, which is consistent with data on the energy dependence of WongEnergy . The collision energy dependence of is potentially a sensitive test of models because the dominant factor in collision energy dependence should be different for various classes of models. Models which involve parton energy loss due to interaction with the medium such as the momentum kick model should have a smaller Ridge at lower energy, as observed in the data, because the initial parton energy was lower. The radial flow+trigger bias model should predict a dependence of on the amount of radial flow in the system. An analysis similar to SergeiLatest could yield predictions for the collision system and energy dependence. Plasma instability models should depend on whether plasma instabilities are more or less likely in small systems and at lower energies. When more detailed calculations are available, it is likely that the data could exclude some production mechanisms.
4 Conclusions
The data from , , and and = 62.4 GeV and = 200 GeV demonstrate that the Jet shows no system dependence. In addition, the collision energy dependence of is described well by PYTHIA even at fairly low and the and dependencies agree with PYTHIA up to a scaling factor, with a few deviations at lower . This implies that the dominant production mechanism of the Jet is fragmentation. Deviations from PYTHIA may imply modifications of the Jet in collisions. It also implies that PYTHIA or other models can be used to determine the effect of the kinematic cuts on on the and jet energy distribution, which could be very useful for the theoretical interpretation of the Ridge.
is smaller at lower collision energies and increases with system size indepent of collision system. There is no dependence on the collision system. Data on the collision energy and system dependence could provide a robust test of models, and comparisons of to PYTHIA imply that the effects of the kinematic cuts on the distribution of jet energies can be inferred from PYTHIA.
References
- (1) J. Bielcikova (STAR), J. Phys. G 34, S929-932 (2007)
- (2) J. Putschke (STAR), J. Phys. G 34, S679-683 (2007)
- (3) N. Armesto, C. Salgado, U. Wiedemann, Phys. Rev. C 72, 064910 (2005)
- (4) C. Y. Wong, Phys. Rev. C 76, 054908 (2007)
- (5) R. Hwa, C. Chiu, Phys. Rev. C72, 034903 (2005)
- (6) S. Voloshin, Phys. Rev. B 632, 490 (2006)
- (7) A. Dumitru, Y. Nara, B. Schenke, M. Strickland, arXiv:0710.1223v2
- (8) K. H. Ackermann et al., Nucl. Inst. Meth. A 499, 624 (2003)
- (9) Nattrass C (STAR), J. Phys. G 35, 044063 (2008)
- (10) M. Bombara (STAR), J. Phys. G 35, 044065 (2008)
- (11) Back B B et al., Phys. Rev. C 72 051901 (2005)
- (12) Back B B et al., Phys. Rev. Lett. 94 122303 (2005)
- (13) B. I. Abelev et al., Phys. Rev. C 75, 054906 (2007)
- (14) Adams J et al.(STAR) 2005 Phys. Rev. Lett. 95 152301
- (15) Sjöstrand T et al.arXiv:hep-ph/0710.3820
- (16) B. I. Abelev et al.(STAR), Phys. Lett. B655, 104 (2007)
- (17) C. Y. Wong arXiv:0806.2154v1
- (18) C. A. Pruneau, S. Gavin, S. A. Voloshin, arXiv:0711.1991v2