On the Corporate Votes and their relation with Daisy Models
Abstract
The distribution of votes of one of the corporate parties in Mexico during elections of 2000, 2003 and 2006 is analyzed. After proper normalization and unfolding, the agreement of the votes distributions with those of daisy models of several ranks is good. These models are generated by retaining each level in a sequence which follows a Poisson distribution. Beyond the fact that rank daisy model resembles the distribution of the quasi-optimal distances for the Traveling Salesman Problem, no clear explanation exists for this behavior, but the agreement is not fortuitous and the possibility of a universal phenomena for corporate vote is discussed.
pacs:
89.75.-k, 87.23.GeI Introduction
Several recent efforts have been done in order to understand the subyacent dynamics in electoral systems and opinion formation TailsTies ; Castellano , from the contrarian effectGalam to the, so called, small world behaviorSmallWorld ; Herrmann . In the Brazilian elections, for instance, power law was found for the proportional voteCostaFilho1999 ; CostaFilho2006 . However, to establish a proper description of an electoral process is a hard issue since many factors and interactions appear and several aspects of them must be studied. Statistical characterization of actual processes is an important issue as well, mainly with the increasing possibility of obtaining the vote data. In the present work we incorporate the analysis on the corporate vote with a study on the statistical properties of the federal Mexican elections of 2000(E-2000), 2003(E-2003), and 2006(E-2006). Since their distributions are smooth, the existence of an analytical distribution that describes them and a model which explains them, are very tempting issues. We were successful in the first topic but the answers to the second remain open. We find a remarkable well fit of the properly unfolded distribution of votes with a family of distributions obtained in the context of spectral statistics of complex quantum systems, the called daisy models hhs . The process presented here is different from those that appears in Castellano , for instance, since the vote decision is taken due to pertain to a corporate.
In the referred electoral processes two new features appeared: i) the party who ruled for around yearsPRI became opposition and ii) the vote data are public and in an electronic formatIFE ; given . The last fact allows an extense statistical analysis, meanwhile, the former one gave the opportunity to analyze the vote distribution of the hard core or corporate voters. We shall denote this party as P2 according to the place in which it appears in the data basisPRI .
Here we present the vote distribution of this party during the elections 2000, 2003, and 2006 for the president position and places in both chambers. This distribution consist of the histogram of the number of votes per cabin obtained for each party, i.e., in how many cabins exists vote, votes and so on. The crude data histograms are presented in the next section, and the unfolding procedure together with the theoretical distribution appear in section III followed by some remarks and conclusions.
II The data
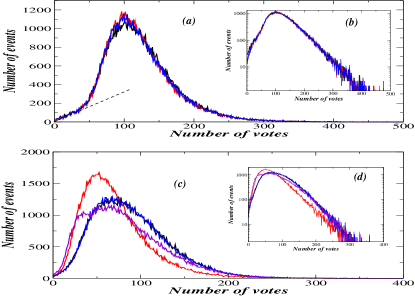
In a recent analysis of the Mexican election of 2006Baezetal the distributions of votes for all the participants were done with data obtained from the preliminary results program (PREP). For the two main parties the results are unclear and a mix of processes is expected; meanwhile for the rest of the forces clear distributions appear: power laws for small parties, annulled votes and non-registered candidates, and a smooth distribution for the third electoral force. The corporate party P2 present a histogram with a clear maximum and a tail with exponential decay. In Fig. 1(a) the histograms of the official final results for P2 are presented. The data were obtained from the electoral authorities web page IFE and on request given . By construction, each cabin admits only votes from the registered list of voters and they are distributed over all the country being a sample grid on the population aged over years oldVcard . As an exception, there exist special cabins for voters in transit but the number of them is small and do not affect the statistical results presented here. With those remarks, it is clear that the histograms are statistics. The analysis of the link with the geo-economic regions is beyond of the present work but it is of interest.
In Fig. 1(a) and 1(c) the histograms for presidential (red), deputies (black) and senators (blue) for E-2000 (upper panel) and E-2006 (lower panel) are presented and the intermediate elections for the low chamber in E-2003 (Fig. 1(c) in violet). We present the crude data with no average of any sort. Other parameters of the distributions are presented in Table 1 being the total number of cabins considered in each process the following: for E-2000, for E-2003 and for E-2006. The existence of a smooth distribution that fits the data is a very tempting issue and is the matter of the rest of the present work.
| Year | Total of votes | Avg. | S.D. |
|---|---|---|---|
| Dep. 2000 | 13734103 | 121.130 | 51.331 |
| Pres. 2000 | 13575704 | 119.695 | 50.414 |
| Sen. 2000 | 13618056 | 120.095 | 50.908 |
| Dep. 2003 | 9878787 | 81.461 | 46.700 |
| Dep. 2006 | 11339480 | 90.023 | 44.166 |
| Pres. 2006 | 8960369 | 71.136 | 38.599 |
| Sen. 2006 | 11292853 | 89.653 | 43.920 |
III Unfolding and Fitting
A direct comparison with any probabilistic distribution requires of proper normalization and unfolding of the signal, i.e. separate the secular part from the fluctuating one. To consider this procedure is important since in many cases considering the relative variable is not enough because the average could not be constant through the whole set of data. In general, the unfolding procedure is a very delicate task WeidenmullerGuhr . In the present case no a priori density can be defined, since it is not clear if the alphabetical order in which the data basis is ordered corresponds to the dynamics of the system. To test the fitting, two sorts were considered, the original order and a randomly sorted sequence of the votes. In both cases the histograms are similar but the last one gives much more stable results after the unfolding procedure, as we shall discuss below.
In order to fit the experimental data with a probability distribution we treat the number of votes as if they were differences of energies in a quantum spectrum. As in the case of energy levels, we consider the spectrum,, formed by levels
| (1) |
where is the number of votes in the cabin and we define . It is costumary to consider the integrated spectral function or integrated density , which counts the number of levels with value equal or less that . stands for the Heaveside unitary step function. The integrated density is decomposed into a secular and a fluctuating part . The former part is given by the integral of the correlation function of one point (See Ref. WeidenmullerGuhr for explanation). The sequence is mapped onto the numbers , with . The new variable is the unfolded one which has a constant density and the statistical analysis is performed on it. In the case of quantum systems is estimated applying semiclassical rules. The first term of its expansion is called, in the literature, the Thomas-Fermi estimate or, the Weyl term in the case of billiards. In practical situations this function is evaluated via polynomial fitting.
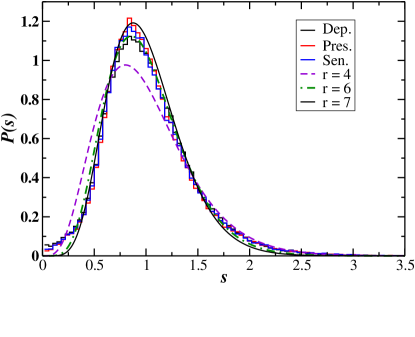
The last procedure described was done in the present case since it is the standard in many fields of physics and it is of general applicability. The specific statistic that we analyze corresponds to the nearest neighbor spacing, , defined as and is the unfolded version of the number of votes defined in Eq. (1). The results for the unfolded votes are shown in Figs. 2 and 3 for the deputies, president and senators in 2000 and 2006 elections. For sake of clarity we drop the E-2003 analysis.
The theoretical comparison is made with the daisy model of rank hhs . This model departs from retaining each level from a set of levels with a Poisson distribution. The resulting sequence has the -nearest neighbor distribution of Poisson’s, but it must be renormalized in order to obtain the nearest neighbor distribution of the daisy model of rank . The resulting -th neighbor spacing distribution is
| (2) |
where corresponds to the kind or rank of the family. The rank corresponds to the Semi-Poisson distribution which is related to the energy distribution of pseudointegrable systemsprosen and others systems at criticalityBogomolny ; Garcia like as the disordered conductor at the Anderson transition Shklovskii . A strong relation exists between daisy models and the nearest-neighbor interaction one-dimensional Coulomb gasBogomolny ; Gerland , where the dependence in the inverse temperature from the later model has the same role as the rank in the former.
We do no have an a priori density in order to compare the vote records with the distribution of Eq. (2). Then, the present study can be done only at nearest neighbors, , even when an exploration to larger range correlations is extremely interesting and will be matter of future works.
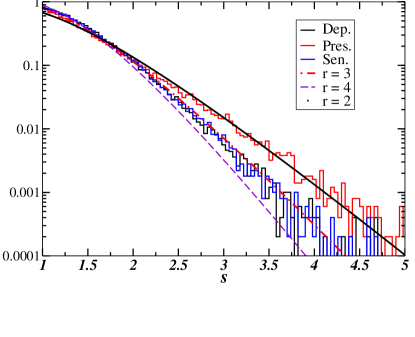
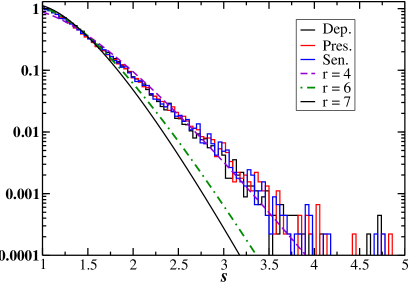
The model described by Eq. (2) with fits the unfolded P2 distribution of vote in two regions with two different daisy ranks, , the central part is usually fitted by a higher rank and decays with a lower one. In the case of E-2000 (Fig. 2) the fit is between and , but a remarkable deviation is that the experimental distributions start with a linear grow as indicated below and with the dashed line in Fig. 1(a). This characteristic remains after the unfolding procedure and marks a clear deviation from the behavior, however, if we do not consider this data, the area preservation of the distribution makes that the function with fits better. The decay is well fitted by a daisy model in all the cases, as can be seen in the lower panel of Fig. 2. It is important to note that a fit to Weibull/Brody distribution is not good, since the decay is clearly exponential and that only happens in the Poissonian case of such distribution. Clearly this is not the case.
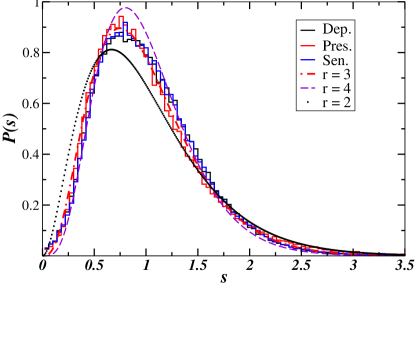
In E-2006 a differential vote occurs since the presidential candidate obtains around less votes than P2 obtains for the chambers, as can see in Table 1. Such an event does not happens in the E-2000 process. In this case, the vote distributions for the chambers fit with a for the whole range, the body and the tail (Fig. 3). For the presidential case exists a general fit with the for the body, but decays with a rank . Note that the agreement for the presidential case (red histogram) is not as good as the other cases. The main difference in E-2000 and E-2006 is that P2 arrived to the last process with a deep internal division as was widely reported in national newspapers.
An interesting remark, since the votes distribution has fit different rank of daisy models is that the parameter plays the role of an inverse temperature when the these models are contrasted with the statistical distributions of a -dimensional Coulomb gas with logaritmic interactions hhs ; Bogomolny
IV Conclusions
In this work we presented an analysis of the vote distribution for one of the corporate parties (named P2 here) in Mexico which has a wide influence in all the country since it was in the federal power for around years. By construction the Mexican electoral system admits a straight statistical analysis since the number of cabins are defined and distributed in order that each cabin admits only voters. The crude P2 vote distributions look smooth (Fig. 1) and, after a proper unfolding and normalization, corresponds to a probability distribution. Comparison of the data with nearest neighbor daisy models of rank () gives a good agreement in all the cases. In the election in 2000 the agreement could be better, but the data distribution depart from a linear grow as indicated in Fig. 1(a) with a dashed line tor guide the eye. The distributions tails follow a different daisy model rank.
The dynamical meaning of these results is unclear but the agreement with a daisy model suggest the existence of universal processes therein and not just a fortuitous agreement. In Ref. hhs the daisy model of rank fit the distribution of distances for the quasi-optimal path in the Traveling Salesman Problem (TSP). The problem consists in finding the shortest path between cities visiting each city just one time. It is clear that the problem presented here is of the same type. P2 have voters in each region of the country and their conform a truly wide web. How this happens is matter of future analysis, as well the existence of similar behavior in other corporate parties around the world.
V Acknowledgment
This work was partially supported by DGAPA-UNAM project IN-104400 and PROMEP 2115/35621.
References
- (1) A. Carbone, G. Kaniadakis, and A. M. Scarfone. Eur. Phys. J. B. 57 121(2007). This reference offers a large but non-exhaustive list of references.
- (2) S. Fortunato and C. Castellano, Phys. Rev. Lett. 99, 138701 (2007).
- (3) C. Borghesi and S. Galam, Phys. Rev. E 73, 066118 (2006).
- (4) A large amount of existing references can be obtained in Science Citation Index.
- (5) M.C. Gonzalez, A.O. Sousa and H.J. Herrmann. Int. J. Mod. Phys. C 15, 45 (2004).
- (6) R.N. Costa Filho, M.P. Almeida, Phys. Rev. E, 60, 1067 (1999); Physica A 322, 698 (2003).
- (7) A.A. Moreira, D.R. Paula, R.N. Costa Filho and J.S. Andrade Jr. Phys. Rev E. 73, 065101(R) (2006).
- (8) H. Hernández-Saldaña, J. Flores and T.H. Seligman. Phys. Rev. E. 60, 449 (1999).
- (9) http://www.ife.org.mx
- (10) According with the mexican transparency law, the electoral data are public and can be obtained on request.
- (11) The party P2 is the Partido Revolucionario Insitutional (PRI).
- (12) G. Baéz, H. Hernández-Saldaña and R.A Méndez-Sánchez. To be submitted to Phys. Rev. E. e-print arXiv:physics/0609114
- (13) To be registered in the voters list is almost mandatory in Mexico since is required as the official ID card for all practical purposes.
- (14) T. Guhr,A. Müller-Groeling, and H.A. Weidenmüller. Phys. Rep. 299, 190 (1998).
- (15) G. Casati and T. Prosen. Phys. Rev. Lett. 85, 4261 (2000).
- (16) E.B. Bogomolny, U. Gerland, and C. Smith. Phys. Rev. E. 59, R1315 (1999); Eur. Phys. J. B. 19, 121 (2001).
- (17) U. Gerland, Ph. D. thesis, University of Hilderberg, Germany, 1998.
- (18) A.M. García-García and J. Wang. Phys. Rev. E. 73, 036210 (2006).
- (19) B.I. Shklovskii, B. Shapiro, B.R. Sears, P. Lambrianides, and H.B. Shore, Phys. Rev. 47, 11487 (1993).