Study of the process 𝐞+β€‹πžβˆ’β†’ΞΌ+β€‹ΞΌβˆ’β†’superscript𝐞superscript𝐞superscriptπœ‡superscriptπœ‡\bf e^{+}e^{-}\to\mu^{+}\mu^{-} in the energy region 𝐬=πŸ—πŸ–πŸŽπ¬980\bf\sqrt{s}=980, 1040 – 1380 MeV.

M.N.Achasov achasov@inp.nsk.su    V.M.Aulchenko    K.I.Beloborodov    A.V.Berdyugin    A.G.Bogdanchikov    A.D.Bukin    D.A.Bukin    T.V.Dimova    V.P.Druzhinin    V.B.Golubev    I.A.Koop    A.A.Korol    S.V.Koshuba    A.P.Lysenko    E.V.Pakhtusova    E.A.Perevedentsev    S.I.Serednyakov    Yu.M.Shatunov    Z.K.Silagadze    A.N.Skrinsky    Yu.A.Tikhonov    A.V.Vasiljev Budker Institute of Nuclear Physics,
Siberian Branch of the Russian Academy of Sciences
11 Lavrentyev,Novosibirsk,630090, Russia
Novosibirsk State University,
630090, Novosibirsk, Russia
Abstract

The cross section of the process e+​eβˆ’β†’ΞΌ+β€‹ΞΌβˆ’β†’superscript𝑒superscript𝑒superscriptπœ‡superscriptπœ‡e^{+}e^{-}\to\mu^{+}\mu^{-} was measured in the SND experiment at the VEPP-2M e+​eβˆ’superscript𝑒superscript𝑒e^{+}e^{-} collider in the energy region s=980,𝑠980\sqrt{s}=980, 1040 – 1380 MeV. The event numbers of the process e+​eβˆ’β†’ΞΌ+β€‹ΞΌβˆ’β†’superscript𝑒superscript𝑒superscriptπœ‡superscriptπœ‡e^{+}e^{-}\to\mu^{+}\mu^{-} were normalized to the integrated luminosity measured using e+​eβˆ’β†’e+​eβˆ’β†’superscript𝑒superscript𝑒superscript𝑒superscript𝑒e^{+}e^{-}\to e^{+}e^{-} and e+​eβˆ’β†’Ξ³β€‹Ξ³β†’superscript𝑒superscript𝑒𝛾𝛾e^{+}e^{-}\to\gamma\gamma processes. The ratio of the measured cross section to the theoretically predicted value is 1.006Β±0.007Β±0.016plus-or-minus1.0060.0070.0161.006\pm 0.007\pm 0.016 and 1.005Β±0.007Β±0.018plus-or-minus1.0050.0070.0181.005\pm 0.007\pm 0.018 in the first and second case respectively. Using results of the measurements, the electromagnetic running coupling constant α𝛼\alpha in the energy region s=1040𝑠1040\sqrt{s}=1040 – 1380 MeV was obtained <1/Ξ±>=134.1Β±0.5Β±1.2expectation1𝛼plus-or-minus134.10.51.2<1/\alpha>=134.1\pm 0.5\pm 1.2 and this is in agreement with theoretical expectation.

pacs:
13.66.De, 13.66.Jn, 14.60.Ef, 12.20.Fv

I Introduction

The process e+​eβˆ’β†’ΞΌ+β€‹ΞΌβˆ’β†’superscript𝑒superscript𝑒superscriptπœ‡superscriptπœ‡e^{+}e^{-}\to\mu^{+}\mu^{-} is the simplest process in the electroweak theory and at the same time it constitutes an important tool in the high energy physics. It plays a fundamental role for studies of the electromagnetic and weak interactions, electromagnetic properties of hadrons. This process was used for quantum electrodynamics (QED) tests, in electroweak interference studies, in leptonic width measurements of the IG​JP​C=0βˆ’β€‹1βˆ’βˆ’superscript𝐼𝐺superscript𝐽𝑃𝐢superscript0superscript1absentI^{G}J^{PC}=0^{-}1^{--} vector mesons and Z𝑍Z-bozon, for the study of the running electromagnetic coupling constant α​(s)𝛼𝑠\alpha(s).

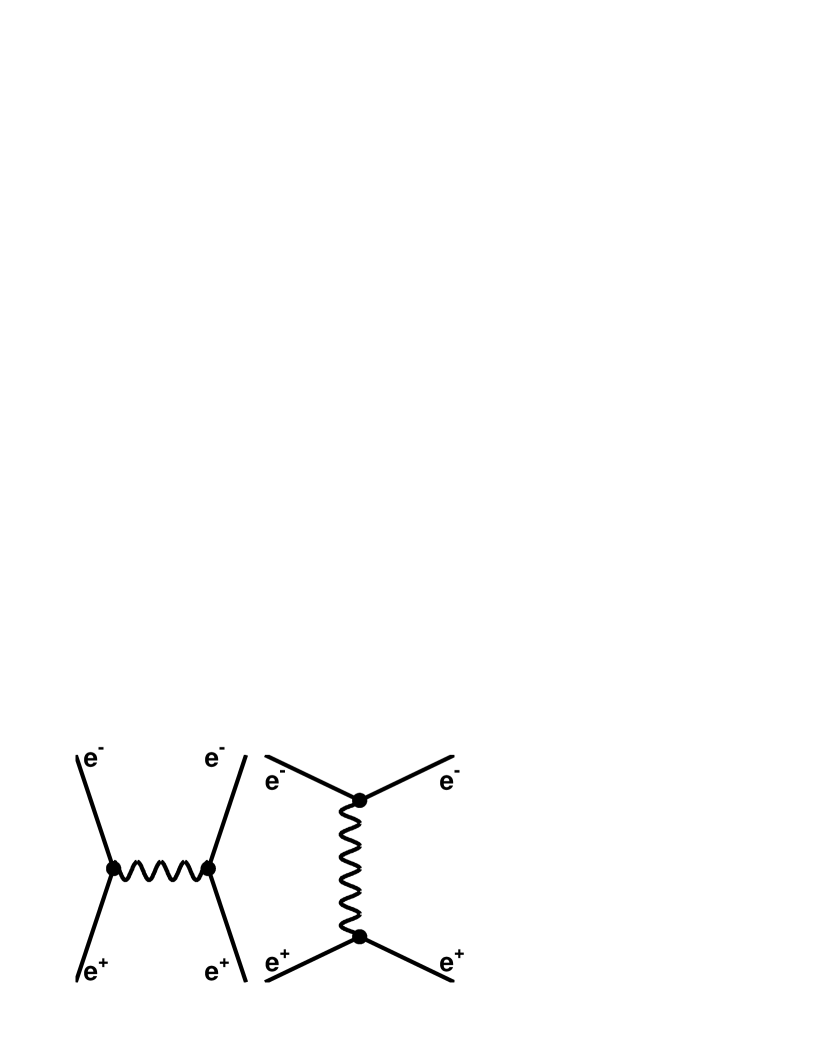
The lowest order Feynman diagram of the process e+​eβˆ’β†’ΞΌ+β€‹ΞΌβˆ’β†’superscript𝑒superscript𝑒superscriptπœ‡superscriptπœ‡e^{+}e^{-}\to\mu^{+}\mu^{-} in the energy region s<𝑠absent\sqrt{s}< 2000 MeV is shown in the Fig.1(a). In Fig.1(b) the diagram of vacuum polarization containing virtual lepton and quark pairs is also shown. These virtual pairs effectively shield a full charge that leads to energy dependence of the electromagnetic coupling constant:

α​(s)=α​(0)1βˆ’Ξ β€‹(s),𝛼𝑠𝛼01Π𝑠\displaystyle\alpha(s)={\alpha(0)\over 1-\Pi(s)}, (1)

where Π​(s)Π𝑠\Pi(s) is the vacuum polarization. The vacuum polarization with leptonic pairs is computed theoretically in the QED framework, while the hadronic vacuum polarization is computed by using dispersion integral and the experimental e+​eβˆ’β†’h​a​d​r​o​n​sβ†’superscript𝑒superscriptπ‘’β„Žπ‘Žπ‘‘π‘Ÿπ‘œπ‘›π‘ e^{+}e^{-}\to hadrons cross section.

The process e+​eβˆ’β†’ΞΌ+β€‹ΞΌβˆ’β†’superscript𝑒superscript𝑒superscriptπœ‡superscriptπœ‡e^{+}e^{-}\to\mu^{+}\mu^{-} in the energy region s<𝑠absent\sqrt{s}< 2000 MeV was studied earlier in several experiments. In Ref.borgia ; balakin ; alles the tests of QED with low statistics were reported. In Ref.kmd2 the cross section of the e+​eβˆ’β†’ΞΌ+β€‹ΞΌβˆ’β†’superscript𝑒superscript𝑒superscriptπœ‡superscriptπœ‡e^{+}e^{-}\to\mu^{+}\mu^{-} process was measured with accuracy of about 1% in the energy region s=370𝑠370\sqrt{s}=370–520 MeV. The studies of the Ο•β†’ΞΌ+β€‹ΞΌβˆ’β†’italic-Ο•superscriptπœ‡superscriptπœ‡\phi\to\mu^{+}\mu^{-} decay were reported in Ref.olya ; kloe .

Refer to caption
Figure 1: Feynman diagrams of the process e+​eβˆ’β†’ΞΌ+β€‹ΞΌβˆ’β†’superscript𝑒superscript𝑒superscriptπœ‡superscriptπœ‡e^{+}e^{-}\to\mu^{+}\mu^{-}. (a) – diagram in the lowest order, (b) – vacuum polarization diagram, the loops are due to fermion pairs – electrons, muons, Ο„πœ\tau-leptons and quarks.

For the studies of the process e+​eβˆ’β†’ΞΌ+β€‹ΞΌβˆ’β†’superscript𝑒superscript𝑒superscriptπœ‡superscriptπœ‡e^{+}e^{-}\to\mu^{+}\mu^{-} with SND detector the most convenient energy region is s>980𝑠980\sqrt{s}>980 MeV. Here the value of the e+​eβˆ’β†’ΞΌ+β€‹ΞΌβˆ’β†’superscript𝑒superscript𝑒superscriptπœ‡superscriptπœ‡e^{+}e^{-}\to\mu^{+}\mu^{-} process cross section is equal or higher than the cross section of the main background process e+​eβˆ’β†’Ο€+β€‹Ο€βˆ’β†’superscript𝑒superscript𝑒superscriptπœ‹superscriptπœ‹e^{+}e^{-}\to\pi^{+}\pi^{-} and the muons are detected with SND muon system. The SND results of the Ο•β†’ΞΌ+β€‹ΞΌβˆ’β†’italic-Ο•superscriptπœ‡superscriptπœ‡\phi\to\mu^{+}\mu^{-} decay study were published in Ref.snd1 ; snd2 . In this work the results of the e+​eβˆ’β†’ΞΌ+β€‹ΞΌβˆ’β†’superscript𝑒superscript𝑒superscriptπœ‡superscriptπœ‡e^{+}e^{-}\to\mu^{+}\mu^{-} process analysis in the energy region s=980𝑠980\sqrt{s}=980, 1040 – 1380 MeV, based on the integrated luminosity 6.4​pbβˆ’16.4superscriptpb16.4~{}\mbox{pb}^{-1} is presented.

II Experiment

The SND detector sndnim operated from 1995 to 2000 at the VEPP-2M vepp2 collider in the energy range s𝑠\sqrt[]{s} from 360 to 1400 MeV. The detector contains several subsystems. The tracking system includes two cylindrical drift chambers. The three-layer spherical electromagnetic calorimeter is based on NaI(Tl) crystals. The muon/veto system consists of plastic scintillation counters and two layers of streamer tubes. The calorimeter energy and angular resolutions depend on the photon energy as ΟƒE/E(%)=4.2%/E​(GeV)4\sigma_{E}/E(\%)={4.2\%/\sqrt[4]{E(\mbox{GeV})}} and σϕ,ΞΈ=0.82∘/E​(GeV)βŠ•0.63∘subscript𝜎italic-Ο•πœƒdirect-sumsuperscript0.82𝐸GeVsuperscript0.63\sigma_{\phi,\theta}={0.82^{\circ}/\sqrt[]{E(\mathrm{GeV})}}\oplus 0.63^{\circ}. The tracking system angular resolutions are about 0.5∘superscript0.50.5^{\circ} and 2∘superscript22^{\circ} for azimuthal and polar angles respectively.

III Data Analysis

The cross section of the e+​eβˆ’β†’ΞΌ+β€‹ΞΌβˆ’β†’superscript𝑒superscript𝑒superscriptπœ‡superscriptπœ‡e^{+}e^{-}\to\mu^{+}\mu^{-} process was measured in the following way.

  1. 1.

    The collinear events e+​eβˆ’β†’ΞΌ+β€‹ΞΌβˆ’β†’superscript𝑒superscript𝑒superscriptπœ‡superscriptπœ‡e^{+}e^{-}\to\mu^{+}\mu^{-}, e+​eβˆ’β†’e+​eβˆ’β†’superscript𝑒superscript𝑒superscript𝑒superscript𝑒e^{+}e^{-}\to e^{+}e^{-} and e+​eβˆ’β†’Ξ³β€‹Ξ³β†’superscript𝑒superscript𝑒𝛾𝛾e^{+}e^{-}\to\gamma\gamma were selected.

  2. 2.

    The e+​eβˆ’β†’e+​eβˆ’β†’superscript𝑒superscript𝑒superscript𝑒superscript𝑒e^{+}e^{-}\to e^{+}e^{-} and e+​eβˆ’β†’Ξ³β€‹Ξ³β†’superscript𝑒superscript𝑒𝛾𝛾e^{+}e^{-}\to\gamma\gamma events were used for integrated luminosity determination:

    I​L=Nσ​(s)​Ρ​(s),πΌπΏπ‘πœŽπ‘ πœ€π‘ \displaystyle IL={{N}\over{\sigma(s)\varepsilon(s)}}, (2)

    where N𝑁N, σ​(s)πœŽπ‘ \sigma(s) and Ρ​(s)πœ€π‘ \varepsilon(s) are event number, cross section and detection efficiency for the process e+​eβˆ’β†’e+​eβˆ’β†’superscript𝑒superscript𝑒superscript𝑒superscript𝑒e^{+}e^{-}\to e^{+}e^{-} or e+​eβˆ’β†’Ξ³β€‹Ξ³β†’superscript𝑒superscript𝑒𝛾𝛾e^{+}e^{-}\to\gamma\gamma.

  3. 3.

    The cross section of the process e+​eβˆ’β†’ΞΌ+β€‹ΞΌβˆ’β†’superscript𝑒superscript𝑒superscriptπœ‡superscriptπœ‡e^{+}e^{-}\to\mu^{+}\mu^{-} was obtained as:

    σμ​μ​(s)=NI​L​Ρ​(s)​δr​a​d​(s).subscriptπœŽπœ‡πœ‡π‘ π‘πΌπΏπœ€π‘ subscriptπ›Ώπ‘Ÿπ‘Žπ‘‘π‘ \displaystyle\sigma_{\mu\mu}(s)={{N}\over{IL\varepsilon(s)\delta_{rad}(s)}}. (3)

    Here N𝑁N is the selected events number of the process e+​eβˆ’β†’ΞΌ+β€‹ΞΌβˆ’β†’superscript𝑒superscript𝑒superscriptπœ‡superscriptπœ‡e^{+}e^{-}\to\mu^{+}\mu^{-}, I​L𝐼𝐿IL is integrated luminosity, Ρ​(s)πœ€π‘ \varepsilon(s) is the detection efficiency, Ξ΄r​a​d​(s)subscriptπ›Ώπ‘Ÿπ‘Žπ‘‘π‘ \delta_{rad}(s) is the radiative correction which takes into account the emission of photons by the initial and final particles KuraevFadin ; fedot .

Refer to caption
Figure 2: The Feynman diagrams of the e+​eβˆ’β†’e+​eβˆ’β†’superscript𝑒superscript𝑒superscript𝑒superscript𝑒e^{+}e^{-}\to e^{+}e^{-} process in lowest order.
Refer to caption
Figure 3: The Feynman diagram of the e+​eβˆ’β†’Ξ³β€‹Ξ³β†’superscript𝑒superscript𝑒𝛾𝛾e^{+}e^{-}\to\gamma\gamma process in lowest order.
Refer to caption
Figure 4: The Feynman diagrams of the process e+​eβˆ’β†’e+​eβˆ’β†’superscript𝑒superscript𝑒superscript𝑒superscript𝑒e^{+}e^{-}\to e^{+}e^{-} with vacuum polarization due to virtual fermion pairs (electrons, muons, Ο„πœ\tau-leptons and quarks).

The detection efficiency was obtained from Monte Carlo (MC) simulation sndnim ; sndpi2 . In order to obtain the detection efficiency of the e+​eβˆ’β†’ΞΌ+β€‹ΞΌβˆ’β†’superscript𝑒superscript𝑒superscriptπœ‡superscriptπœ‡e^{+}e^{-}\to\mu^{+}\mu^{-} process, the MC events generator based on the formula obtained in the Ref.arbuzqed was used. MC simulation of the processes e+​eβˆ’β†’e+​eβˆ’β†’superscript𝑒superscript𝑒superscript𝑒superscript𝑒e^{+}e^{-}\to e^{+}e^{-} and e+​eβˆ’β†’Ξ³β€‹Ξ³β†’superscript𝑒superscript𝑒𝛾𝛾e^{+}e^{-}\to\gamma\gamma was based on the formulas obtained in the Ref.berklee ; berklgg . The simulation of the process e+​eβˆ’β†’e+​eβˆ’β†’superscript𝑒superscript𝑒superscript𝑒superscript𝑒e^{+}e^{-}\to e^{+}e^{-} was performed with the cut 30∘<ΞΈeΒ±<150∘superscript30subscriptπœƒsuperscript𝑒plus-or-minussuperscript15030^{\circ}<\theta_{e^{\pm}}<150^{\circ} on the polar angles of the final electron and positron. The cross section under these conditions was computed by using BHWIDE bhwide code with accuracy 0.5 %.

The Feynman diagrams of the processes e+​eβˆ’β†’e+​eβˆ’β†’superscript𝑒superscript𝑒superscript𝑒superscript𝑒e^{+}e^{-}\to e^{+}e^{-} and e+​eβˆ’β†’Ξ³β€‹Ξ³β†’superscript𝑒superscript𝑒𝛾𝛾e^{+}e^{-}\to\gamma\gamma in the lowest order are shown in Fig.3 and 3. The process e+​eβˆ’β†’e+​eβˆ’β†’superscript𝑒superscript𝑒superscript𝑒superscript𝑒e^{+}e^{-}\to e^{+}e^{-} also contains the contribution from the vacuum polarization due to leptons and hadrons virtual pairs (Fig.4), while the process e+​eβˆ’β†’Ξ³β€‹Ξ³β†’superscript𝑒superscript𝑒𝛾𝛾e^{+}e^{-}\to\gamma\gamma does not have such contributions. Hence to obtain the deviation of α​(s)𝛼𝑠\alpha(s) from α​(0)𝛼0\alpha(0), the process e+​eβˆ’β†’Ξ³β€‹Ξ³β†’superscript𝑒superscript𝑒𝛾𝛾e^{+}e^{-}\to\gamma\gamma is preferable for normalization.

In this work the cross section of the process e+​eβˆ’β†’ΞΌ+β€‹ΞΌβˆ’β†’superscript𝑒superscript𝑒superscriptπœ‡superscriptπœ‡e^{+}e^{-}\to\mu^{+}\mu^{-} was obtained based on integrated luminosities measured by using both e+​eβˆ’β†’e+​eβˆ’β†’superscript𝑒superscript𝑒superscript𝑒superscript𝑒e^{+}e^{-}\to e^{+}e^{-} (I​Le​e𝐼subscript𝐿𝑒𝑒IL_{ee}) and e+​eβˆ’β†’Ξ³β€‹Ξ³β†’superscript𝑒superscript𝑒𝛾𝛾e^{+}e^{-}\to\gamma\gamma (I​Lγ​γ𝐼subscript𝐿𝛾𝛾IL_{\gamma\gamma}) processes. The cross section of the process e+​eβˆ’β†’e+​eβˆ’β†’superscript𝑒superscript𝑒superscript𝑒superscript𝑒e^{+}e^{-}\to e^{+}e^{-} in the angular region 30∘<ΞΈeΒ±<150∘superscript30subscriptπœƒsuperscript𝑒plus-or-minussuperscript15030^{\circ}<\theta_{e^{\pm}}<150^{\circ} was measured by using integrated luminosity I​Lγ​γ𝐼subscript𝐿𝛾𝛾IL_{\gamma\gamma}:

Οƒe+​eβˆ’β€‹(Ξ³)=Ne+​eβˆ’I​Lγ​γ​Ρe+​eβˆ’,subscript𝜎superscript𝑒superscript𝑒𝛾subscript𝑁superscript𝑒superscript𝑒𝐼subscript𝐿𝛾𝛾subscriptπœ€superscript𝑒superscript𝑒\displaystyle\sigma_{e^{+}e^{-}(\gamma)}={{N_{e^{+}e^{-}}}\over{IL_{\gamma\gamma}\varepsilon_{e^{+}e^{-}}}}, (4)

where Ne+​eβˆ’subscript𝑁superscript𝑒superscript𝑒N_{e^{+}e^{-}} and Ξ΅e+​eβˆ’subscriptπœ€superscript𝑒superscript𝑒\varepsilon_{e^{+}e^{-}} are the event number and detection efficiency for the process e+​eβˆ’β†’e+​eβˆ’β†’superscript𝑒superscript𝑒superscript𝑒superscript𝑒e^{+}e^{-}\to e^{+}e^{-}.

III.1 Selection criteria

During the experimental runs, first-level trigger selects events of various types: events with charged particles and events containing the neutral particles only. In the first case, the trigger selected events with one or more tracks in the tracking system and with two clusters in the calorimeter with the spatial angle between the clusters more than 100∘superscript100100^{\circ}. The threshold on the energy deposition in cluster was equal to 25 MeV. The threshold on the total energy deposition in the calorimeter was set equal to 160 MeV. In the second case, the events without tracks in the tracking system and with veto signal of the muon system and with total energy deposition more than 250 MeV were selected. During processing of the experimental data, the event reconstruction is performed sndnim ; phi98 . The reconstructed particles were sorted in the decreasing order of their energy deposition in the calorimeter. Further the first two particles were considered. They were numbered in the following way: in odd events the particle which has the higher energy deposition in the calorimeter was named the first one and in the even events the first particle was the particle with lower energy deposition.

The e+​eβˆ’β†’Ξ³β€‹Ξ³β†’superscript𝑒superscript𝑒𝛾𝛾e^{+}e^{-}\to\gamma\gamma process events were selected by using the following selection criteria (below subscripts 1 and 2 denote the first and second particles respectively):

  • β€’

    Nc​h​a=0subscriptπ‘π‘β„Žπ‘Ž0N_{cha}=0 and Nn​e​uβ‰₯2subscript𝑁𝑛𝑒𝑒2N_{neu}\geq 2, where Nc​h​asubscriptπ‘π‘β„Žπ‘ŽN_{cha}, Nn​e​usubscript𝑁𝑛𝑒𝑒N_{neu} are the numbers of charged and neutral particles (photons). Extra photons in the e+​eβˆ’β†’Ξ³β€‹Ξ³β†’superscript𝑒superscript𝑒𝛾𝛾e^{+}e^{-}\to\gamma\gamma events can appear because of overlap with the beam background or due to electromagnetic showers splitting.

  • β€’

    55∘<ΞΈ1<125∘superscript55subscriptπœƒ1superscript12555^{\circ}<\theta_{1}<125^{\circ}, where ΞΈπœƒ\theta is the particle polar angle

  • β€’

    |Δ​θ|=|180βˆ˜βˆ’(ΞΈ1+ΞΈ2)|<20βˆ˜Ξ”πœƒsuperscript180subscriptπœƒ1subscriptπœƒ2superscript20|\Delta\theta|=|180^{\circ}-(\theta_{1}+\theta_{2})|<20^{\circ}.

  • β€’

    |Δ​ϕ|=|180βˆ˜βˆ’|Ο•1βˆ’Ο•2||<5βˆ˜Ξ”italic-Ο•superscript180subscriptitalic-Ο•1subscriptitalic-Ο•2superscript5|\Delta\phi|=|180^{\circ}-|\phi_{1}-\phi_{2}||<5^{\circ}, where Ο•italic-Ο•\phi is the particle azimuthal angle.

  • β€’

    E1,2/E0>0.7subscript𝐸12subscript𝐸00.7E_{1,2}/E_{0}>0.7, where Eisubscript𝐸𝑖E_{i} is the i𝑖ith photon (i=1,2𝑖12i=1,2) energy deposition, E0subscript𝐸0E_{0} is the beam energy.

The events of the processes e+​eβˆ’β†’e+​eβˆ’β†’superscript𝑒superscript𝑒superscript𝑒superscript𝑒e^{+}e^{-}\to e^{+}e^{-} and e+​eβˆ’β†’ΞΌ+β€‹ΞΌβˆ’β†’superscript𝑒superscript𝑒superscriptπœ‡superscriptπœ‡e^{+}e^{-}\to\mu^{+}\mu^{-} were selected in the following way:

  • β€’

    Nc​h​a=2subscriptπ‘π‘β„Žπ‘Ž2N_{cha}=2. The events can contain neutral particles due to overlap with the beam background or due to electromagnetic showers splitting.

  • β€’

    |z1,2|<10subscript𝑧1210|z_{1,2}|<10 cm and r1,2<1subscriptπ‘Ÿ121r_{1,2}<1 cm, where z𝑧z is the coordinate of the charged particle production point along the beam axis (the longitudinal size of the interaction region depends on beam energy and varies from 2 to 3 cm), rπ‘Ÿr is the distance between the charged particle track and the beam axis in the rβˆ’Ο•π‘Ÿitalic-Ο•r-\phi plane.

  • β€’

    55∘<ΞΈ1<125∘superscript55subscriptπœƒ1superscript12555^{\circ}<\theta_{1}<125^{\circ}.

  • β€’

    |Δ​ϕ|<10βˆ˜Ξ”italic-Ο•superscript10|\Delta\phi|<10^{\circ} and |Δ​θ|<10βˆ˜Ξ”πœƒsuperscript10|\Delta\theta|<10^{\circ}.

  • β€’

    The region of 240∘<Ο•1,2<300∘superscript240subscriptitalic-Ο•12superscript300240^{\circ}<\phi_{1,2}<300^{\circ} was excluded, because this sector of the Ο•italic-Ο•\phi angle was not covered with the muon system.

  • β€’

    r1<0.1subscriptπ‘Ÿ10.1r_{1}<0.1 cm or r2<0.1subscriptπ‘Ÿ20.1r_{2}<0.1 cm. This cut strongly suppressed the contribution of cosmic muons in the events selected as e+​eβˆ’β†’ΞΌ+β€‹ΞΌβˆ’β†’superscript𝑒superscript𝑒superscriptπœ‡superscriptπœ‡e^{+}e^{-}\to\mu^{+}\mu^{-}.

The last two selection criteria were not applied in the measurement of the e+​eβˆ’β†’e+​eβˆ’β†’superscript𝑒superscript𝑒superscript𝑒superscript𝑒e^{+}e^{-}\to e^{+}e^{-} process cross section.

Finally the e+​eβˆ’β†’e+​eβˆ’β†’superscript𝑒superscript𝑒superscript𝑒superscript𝑒e^{+}e^{-}\to e^{+}e^{-} events were selected by using cuts on the particles energy depositions E1,2/E0>0.7subscript𝐸12subscript𝐸00.7E_{1,2}/E_{0}>0.7. The selection of the e+​eβˆ’β†’ΞΌ+β€‹ΞΌβˆ’β†’superscript𝑒superscript𝑒superscriptπœ‡superscriptπœ‡e^{+}e^{-}\to\mu^{+}\mu^{-} events was done by using the following cuts E1,2>50subscript𝐸1250E_{1,2}>50 MeV and E1,2/E0<0.7subscript𝐸12subscript𝐸00.7E_{1,2}/E_{0}<0.7. In addition, each particle was required to fire the scintillation counters of the muon system.

III.2 Background determination.

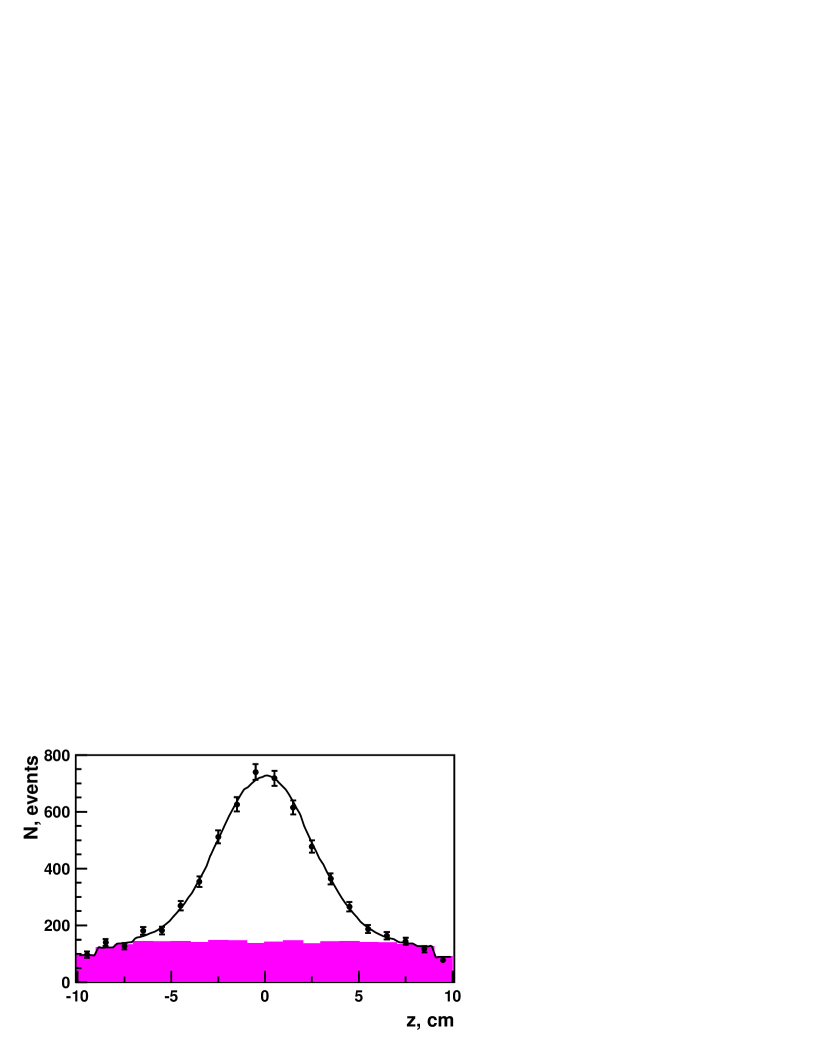
The selection criteria described above allow to extract the events of processes e+​eβˆ’β†’e+​eβˆ’β†’superscript𝑒superscript𝑒superscript𝑒superscript𝑒e^{+}e^{-}\to e^{+}e^{-} and e+​eβˆ’β†’Ξ³β€‹Ξ³β†’superscript𝑒superscript𝑒𝛾𝛾e^{+}e^{-}\to\gamma\gamma without any significant background admixture. The data selected as events of the e+​eβˆ’β†’ΞΌ+β€‹ΞΌβˆ’β†’superscript𝑒superscript𝑒superscriptπœ‡superscriptπœ‡e^{+}e^{-}\to\mu^{+}\mu^{-} process contain about 45% of the cosmic muon background. In order to extract the e+​eβˆ’β†’ΞΌ+β€‹ΞΌβˆ’β†’superscript𝑒superscript𝑒superscriptπœ‡superscriptπœ‡e^{+}e^{-}\to\mu^{+}\mu^{-} events number nμ​μsubscriptπ‘›πœ‡πœ‡n_{\mu\mu}, the distribution over the coordinate z=(z1+z2)/2𝑧subscript𝑧1subscript𝑧22z=(z_{1}+z_{2})/2 (Fig.5) was fitted by the sum:

G​(z)Γ—nμ​μ+C​(z)Γ—(nβˆ’nμ​μ),𝐺𝑧subscriptπ‘›πœ‡πœ‡πΆπ‘§π‘›subscriptπ‘›πœ‡πœ‡G(z)\times n_{\mu\mu}+C(z)\times(n-n_{\mu\mu}), (5)

where n𝑛n is the total number of selected events, G​(z)𝐺𝑧G(z) is the Gaussian distribution for e+​eβˆ’β†’ΞΌ+β€‹ΞΌβˆ’β†’superscript𝑒superscript𝑒superscriptπœ‡superscriptπœ‡e^{+}e^{-}\to\mu^{+}\mu^{-} events with peak at z=0𝑧0z=0 cm, C​(z)𝐢𝑧C(z) is the uniform distribution for cosmic background events. The C(z) distribution was obtained by using data collected in special runs without beams in collider. The G​(z)𝐺𝑧G(z) distribution was obtained in each energy point by using e+​eβˆ’β†’e+​eβˆ’β†’superscript𝑒superscript𝑒superscript𝑒superscript𝑒e^{+}e^{-}\to e^{+}e^{-} events. The systematic uncertainty of nμ​μsubscriptπ‘›πœ‡πœ‡n_{\mu\mu} determination was estimated by using distributions for the e+​eβˆ’β†’Ο€+β€‹Ο€βˆ’β†’superscript𝑒superscript𝑒superscriptπœ‹superscriptπœ‹e^{+}e^{-}\to\pi^{+}\pi^{-} and K+​Kβˆ’superscript𝐾superscript𝐾K^{+}K^{-} events instead of z𝑧z-distribution for the e+​eβˆ’β†’e+​eβˆ’β†’superscript𝑒superscript𝑒superscript𝑒superscript𝑒e^{+}e^{-}\to e^{+}e^{-} events in eq. (5) in the role of G​(z)𝐺𝑧G(z). The difference in nμ​μsubscriptπ‘›πœ‡πœ‡n_{\mu\mu} values obtained by fitting with various G​(z)𝐺𝑧G(z) was found to be 0.5% and this value was taken as systematic error due to the cosmic background subtraction.

Refer to caption
Figure 5: The distribution of the z𝑧z coordinate of the charged particles production point in events selected as e+​eβˆ’β†’ΞΌ+β€‹ΞΌβˆ’β†’superscript𝑒superscript𝑒superscriptπœ‡superscriptπœ‡e^{+}e^{-}\to\mu^{+}\mu^{-} at the energy s=1370𝑠1370\sqrt{s}=1370 MeV. Dots – all events, dashed distribution – cosmic background events, curve – the fit by sum of distributions of beam and cosmic events.

Besides cosmic background, the selected data contain events of the collinear e+​eβˆ’β†’e+​eβˆ’β†’superscript𝑒superscript𝑒superscript𝑒superscript𝑒e^{+}e^{-}\to e^{+}e^{-} and e+​eβˆ’β†’Ο€+β€‹Ο€βˆ’β†’superscript𝑒superscript𝑒superscriptπœ‹superscriptπœ‹e^{+}e^{-}\to\pi^{+}\pi^{-} processes (the expected background from the e+​eβˆ’β†’K+​Kβˆ’β†’superscript𝑒superscript𝑒superscript𝐾superscript𝐾e^{+}e^{-}\to K^{+}K^{-}, e+​eβˆ’β†’3​π,4​π,KS​KLβ†’superscript𝑒superscript𝑒3πœ‹4πœ‹subscript𝐾𝑆subscript𝐾𝐿e^{+}e^{-}\to 3\pi,4\pi,K_{S}K_{L} processes is less than 0.05%). The expected event number Nπ​πsubscriptπ‘πœ‹πœ‹N_{\pi\pi} from the e+​eβˆ’β†’Ο€+β€‹Ο€βˆ’β†’superscript𝑒superscript𝑒superscriptπœ‹superscriptπœ‹e^{+}e^{-}\to\pi^{+}\pi^{-} process is less than 0.4% of the e+​eβˆ’β†’ΞΌ+β€‹ΞΌβˆ’β†’superscript𝑒superscript𝑒superscriptπœ‡superscriptπœ‡e^{+}e^{-}\to\mu^{+}\mu^{-} event number and was estimated in the following way:

Nπ​π=σπ​π​(s)​Ρπ​π​(s)​I​L,subscriptπ‘πœ‹πœ‹subscriptπœŽπœ‹πœ‹π‘ subscriptπœ€πœ‹πœ‹π‘ πΌπΏ\displaystyle N_{\pi\pi}=\sigma_{\pi\pi}({s})\varepsilon_{\pi\pi}({s})IL, (6)

where σπ​π​(s)subscriptπœŽπœ‹πœ‹π‘ \sigma_{\pi\pi}({s}) is the cross section of the e+​eβˆ’β†’Ο€+β€‹Ο€βˆ’β†’superscript𝑒superscript𝑒superscriptπœ‹superscriptπœ‹e^{+}e^{-}\to\pi^{+}\pi^{-} process measured by OLYA and CMD-2 olyamh ; kmd2mh , I​L𝐼𝐿IL is the integrated luminosity , Ρπ​π​(s)subscriptπœ€πœ‹πœ‹π‘ \varepsilon_{\pi\pi}({s}) is the detection probability for the background process obtained from the simulation under the selection criteria described above. The source of error in the Nπ​πsubscriptπ‘πœ‹πœ‹N_{\pi\pi} determination is an inaccurate simulation of the muon system efficiency. To estimate this error the e+​eβˆ’β†’Ο€+β€‹Ο€βˆ’β†’superscript𝑒superscript𝑒superscriptπœ‹superscriptπœ‹e^{+}e^{-}\to\pi^{+}\pi^{-} events were selected at the energy point s=980𝑠980\sqrt{s}=980 MeV (below the e+​eβˆ’β†’K+​Kβˆ’β†’superscript𝑒superscript𝑒superscript𝐾superscript𝐾e^{+}e^{-}\to K^{+}K^{-} reaction threshold) by using additional cuts:

  • β€’

    r1,2<0.1subscriptπ‘Ÿ120.1r_{1,2}<0.1 cm (for the cosmic background suppression).

  • β€’

    E1I​I<50superscriptsubscript𝐸1𝐼𝐼50E_{1}^{II}<50 MeV and E1I​I​I<50superscriptsubscript𝐸1𝐼𝐼𝐼50E_{1}^{III}<50 MeV, where E1I​Isuperscriptsubscript𝐸1𝐼𝐼E_{1}^{II} and E1I​I​Isuperscriptsubscript𝐸1𝐼𝐼𝐼E_{1}^{III} are the first particle energy depositions in the second and third calorimeter layers respectively (for e+​eβˆ’β†’ΞΌ+β€‹ΞΌβˆ’β†’superscript𝑒superscript𝑒superscriptπœ‡superscriptπœ‡e^{+}e^{-}\to\mu^{+}\mu^{-} and cosmic background suppression).

  • β€’

    The muon system was not fired by the first particle and no requirements for the second particle.

Under this conditions the e+​eβˆ’β†’e+​eβˆ’β†’superscript𝑒superscript𝑒superscript𝑒superscript𝑒e^{+}e^{-}\to e^{+}e^{-} process background is negligible, the cosmic background was subtracted using z𝑧z distribution. The following value was obtained:

δπ​π=(n/Nm/M)2=0.4Β±0.4subscriptπ›Ώπœ‹πœ‹superscriptπ‘›π‘π‘šπ‘€2plus-or-minus0.40.4\displaystyle\delta_{\pi\pi}=\biggl{(}{{n/N}\over{m/M}}\biggr{)}^{2}=0.4\pm 0.4 (7)

Here N𝑁N and M𝑀M are the number of experimental and simulated events of the process e+​eβˆ’β†’Ο€+β€‹Ο€βˆ’β†’superscript𝑒superscript𝑒superscriptπœ‹superscriptπœ‹e^{+}e^{-}\to\pi^{+}\pi^{-} selected under described criteria, while n𝑛n and mπ‘šm are the event numbers in which the muon system was fired by the second particle. The accuracy of δπ​πsubscriptπ›Ώπœ‹πœ‹\delta_{\pi\pi} is equal to its value, due to the low statistics.

In the energy region above the e+​eβˆ’β†’K+​Kβˆ’β†’superscript𝑒superscript𝑒superscript𝐾superscript𝐾e^{+}e^{-}\to K^{+}K^{-} reaction threshold up to s=1100𝑠1100\sqrt{s}=1100 MeV the δπ​πsubscriptπ›Ώπœ‹πœ‹\delta_{\pi\pi} correction can be obtained by using cuts on the d​E/d​x𝑑𝐸𝑑π‘₯dE/dx ionization energy losses in the drift chamber for the charged kaons background rejection. In particular at s=1100𝑠1100\sqrt{s}=1100 MeV it was found that δπ​π=0.8Β±0.5subscriptπ›Ώπœ‹πœ‹plus-or-minus0.80.5\delta_{\pi\pi}=0.8\pm 0.5, and this agrees with the estimation presented above.

In order to estimate the systematic uncertainty due to inaccuracy of the Nπ​πsubscriptπ‘πœ‹πœ‹N_{\pi\pi} subtraction, the probability Ρπ​π​(s)subscriptπœ€πœ‹πœ‹π‘ \varepsilon_{\pi\pi}({s}) in all energy points was multiplied by δπ​π=0.4subscriptπ›Ώπœ‹πœ‹0.4\delta_{\pi\pi}=0.4. Then the maximal variation of the measured e+​eβˆ’β†’ΞΌ+β€‹ΞΌβˆ’β†’superscript𝑒superscript𝑒superscriptπœ‡superscriptπœ‡e^{+}e^{-}\to\mu^{+}\mu^{-} process cross section was 0.7%. This value was taken as the systematic error due to the e+​eβˆ’β†’Ο€+β€‹Ο€βˆ’β†’superscript𝑒superscript𝑒superscriptπœ‹superscriptπœ‹e^{+}e^{-}\to\pi^{+}\pi^{-} background subtraction.

The expected value of the e+​eβˆ’β†’e+​eβˆ’β†’superscript𝑒superscript𝑒superscript𝑒superscript𝑒e^{+}e^{-}\to e^{+}e^{-} events background is about 0.2% of the e+​eβˆ’β†’ΞΌ+β€‹ΞΌβˆ’β†’superscript𝑒superscript𝑒superscriptπœ‡superscriptπœ‡e^{+}e^{-}\to\mu^{+}\mu^{-} events number. The systematic error due to subtraction of this background was found to be negligible.

III.3 Detection efficiency

Uncertainties in the simulation of the distributions over some selection parameters lead to the inaccuracy in detection efficiency determination. In order to estimate this inaccuracy the experimental and simulated spectra were studied and compared using additional cuts. These cuts were selected so that they were uncorrelated with the studied parameter and provided the distribution over this parameters without additional background admixture.

The muon system firing is the main cut for the extraction of the e+​eβˆ’β†’ΞΌ+β€‹ΞΌβˆ’β†’superscript𝑒superscript𝑒superscriptπœ‡superscriptπœ‡e^{+}e^{-}\to\mu^{+}\mu^{-} process events. The comparison of the simulated and experimental probabilities of the muon system firing was done by using the following additional cuts:

  • β€’

    r1,2<0.1subscriptπ‘Ÿ120.1r_{1,2}<0.1 cm (for the cosmic muon background suppression).

  • β€’

    The muon system was fired by the first particle and no requirements for the second particle.

  • β€’

    30<E1,2I<5530superscriptsubscript𝐸12𝐼5530<E_{1,2}^{I}<55 MeV, 45<E1,2I​I<8045superscriptsubscript𝐸12𝐼𝐼8045<E_{1,2}^{II}<80 MeV and 55<E1,2I​I​I<9055superscriptsubscript𝐸12𝐼𝐼𝐼9055<E_{1,2}^{III}<90 MeV, where Eijsuperscriptsubscript𝐸𝑖𝑗E_{i}^{j} is the ith particle energy deposition in the jth calorimeter layer (for e+​eβˆ’β†’Ο€+β€‹Ο€βˆ’β†’superscript𝑒superscript𝑒superscriptπœ‹superscriptπœ‹e^{+}e^{-}\to\pi^{+}\pi^{-} and K+​Kβˆ’superscript𝐾superscript𝐾K^{+}K^{-} background rejection).

Then the following parameter was calculated:

Ξ΄s​c=(n/Nm/M)2,subscript𝛿𝑠𝑐superscriptπ‘›π‘π‘šπ‘€2\displaystyle\delta_{sc}=\biggl{(}{{n/N}\over{m/M}}\biggr{)}^{2}, (8)

where N𝑁N, M𝑀M are selected event numbers and n𝑛n, mπ‘šm are the event numbers in which the muon system was fired by the second particle also. The cosmic background was subtracted using z𝑧z-distribution. The coefficient Ξ΄s​csubscript𝛿𝑠𝑐\delta_{sc} is equal to 1.15 at s=980𝑠980\sqrt{s}=980 MeV and decreases to 1.0 at s=1380𝑠1380\sqrt{s}=1380 MeV. The detection efficiency of the process e+​eβˆ’β†’ΞΌ+β€‹ΞΌβˆ’β†’superscript𝑒superscript𝑒superscriptπœ‡superscriptπœ‡e^{+}e^{-}\to\mu^{+}\mu^{-} at various energy points was multiplied by correction coefficient at this point.

Refer to caption
Figure 6: Energy deposition spectra for the muons in experiment (dots) and simulation(histogram).

The energy deposition spectra of the muons in calorimeter is shown in Fig.6. The experimental and simulated distributions are in good agreement. No significant systematics were found due to the cuts on the energy deposition in the e+​eβˆ’β†’ΞΌ+β€‹ΞΌβˆ’β†’superscript𝑒superscript𝑒superscriptπœ‡superscriptπœ‡e^{+}e^{-}\to\mu^{+}\mu^{-} process.

In the tracking system the particle track can be lost due to reconstruction inefficiency. The probabilities to find both tracks were determined by using experimental data themselves. It was found to be Ξ΅e​e≃0.982Β±0.001similar-to-or-equalssubscriptπœ€π‘’π‘’plus-or-minus0.9820.001\varepsilon_{ee}\simeq 0.982\pm 0.001 and Ρμ​μ≃0.983Β±0.001similar-to-or-equalssubscriptπœ€πœ‡πœ‡plus-or-minus0.9830.001\varepsilon_{\mu\mu}\simeq 0.983\pm 0.001 for processes e+​eβˆ’β†’e+​eβˆ’β†’superscript𝑒superscript𝑒superscript𝑒superscript𝑒e^{+}e^{-}\to e^{+}e^{-} and e+​eβˆ’β†’ΞΌ+β€‹ΞΌβˆ’β†’superscript𝑒superscript𝑒superscriptπœ‡superscriptπœ‡e^{+}e^{-}\to\mu^{+}\mu^{-} respectively. In simulations, these values do not actually differ from unity. Thus, if the event numbers of the process e+​eβˆ’β†’ΞΌ+β€‹ΞΌβˆ’β†’superscript𝑒superscript𝑒superscriptπœ‡superscriptπœ‡e^{+}e^{-}\to\mu^{+}\mu^{-} were normalized by the integrated luminosity I​Le​e𝐼subscript𝐿𝑒𝑒IL_{ee}, the systematic errors due to track reconstruction are actually reduced. When the events of the e+​eβˆ’β†’e+​eβˆ’β†’superscript𝑒superscript𝑒superscript𝑒superscript𝑒e^{+}e^{-}\to e^{+}e^{-} and e+​eβˆ’β†’ΞΌ+β€‹ΞΌβˆ’β†’superscript𝑒superscript𝑒superscriptπœ‡superscriptπœ‡e^{+}e^{-}\to\mu^{+}\mu^{-} processes were normalized by the luminosity I​Lγ​γ𝐼subscript𝐿𝛾𝛾IL_{\gamma\gamma}, the detection efficiencies were multiplied by coefficients Ξ΅e​esubscriptπœ€π‘’π‘’\varepsilon_{ee} and Ρμ​μsubscriptπœ€πœ‡πœ‡\varepsilon_{\mu\mu}.

Refer to caption
Figure 7: Energy deposition spectra for electrons with energies of 490, 590 and 690 MeV in experiment (dots) and simulation (histogram).
Refer to caption
Figure 8: Energy deposition spectra for photons with energies of 490, 590 and 690 MeV in experiment (dots) and simulation (histogram).
Refer to caption
Figure 9: The Ξ”β€‹ΞΈΞ”πœƒ\Delta\theta distribution of the e+​eβˆ’β†’e+​eβˆ’β†’superscript𝑒superscript𝑒superscript𝑒superscript𝑒e^{+}e^{-}\to e^{+}e^{-} events. Dots – experiment, histogram – simulation.
Refer to caption
Figure 10: The Δ​ϕΔitalic-Ο•\Delta\phi distribution of the e+​eβˆ’β†’e+​eβˆ’β†’superscript𝑒superscript𝑒superscript𝑒superscript𝑒e^{+}e^{-}\to e^{+}e^{-} events. Dots – experiment, histogram – simulation.
Refer to caption
Figure 11: The Ξ”β€‹ΞΈΞ”πœƒ\Delta\theta distribution of the e+​eβˆ’β†’Ξ³β€‹Ξ³β†’superscript𝑒superscript𝑒𝛾𝛾e^{+}e^{-}\to\gamma\gamma events Dots – experiment, histogram – simulation.
Refer to caption
Figure 12: The Δ​ϕΔitalic-Ο•\Delta\phi distribution of the e+​eβˆ’β†’Ξ³β€‹Ξ³β†’superscript𝑒superscript𝑒𝛾𝛾e^{+}e^{-}\to\gamma\gamma events Dots – experiment, histogram – simulation.
Refer to caption
Figure 13: The Ξ”β€‹ΞΈΞ”πœƒ\Delta\theta distribution of the e+​eβˆ’β†’ΞΌ+β€‹ΞΌβˆ’β†’superscript𝑒superscript𝑒superscriptπœ‡superscriptπœ‡e^{+}e^{-}\to\mu^{+}\mu^{-} events. Dots – experiment, histogram – simulation.
Refer to caption
Figure 14: The Δ​ϕΔitalic-Ο•\Delta\phi distribution of the e+​eβˆ’β†’ΞΌ+β€‹ΞΌβˆ’β†’superscript𝑒superscript𝑒superscriptπœ‡superscriptπœ‡e^{+}e^{-}\to\mu^{+}\mu^{-} events. Dots – experiment, histogram – simulation.
Refer to caption
Figure 15: The ΞΈπœƒ\theta angle distribution of the e+​eβˆ’β†’e+​eβˆ’β†’superscript𝑒superscript𝑒superscript𝑒superscript𝑒e^{+}e^{-}\to e^{+}e^{-} events. Dots – experiment, histogram – simulation.
Refer to caption
Figure 16: The ΞΈπœƒ\theta angle distribution of the e+​eβˆ’β†’ΞΌ+β€‹ΞΌβˆ’β†’superscript𝑒superscript𝑒superscriptπœ‡superscriptπœ‡e^{+}e^{-}\to\mu^{+}\mu^{-} events. Dots – experiment, histogram – simulation.
Refer to caption
Figure 17: The ΞΈπœƒ\theta angle distribution of the e+​eβˆ’β†’Ξ³β€‹Ξ³β†’superscript𝑒superscript𝑒𝛾𝛾e^{+}e^{-}\to\gamma\gamma events. Dots – experiment, histogram – simulation.
Refer to caption
Figure 18: The ratio of the ΞΈπœƒ\theta distributions of the e+​eβˆ’β†’ΞΌ+β€‹ΞΌβˆ’β†’superscript𝑒superscript𝑒superscriptπœ‡superscriptπœ‡e^{+}e^{-}\to\mu^{+}\mu^{-} and e+​eβˆ’β†’e+​eβˆ’β†’superscript𝑒superscript𝑒superscript𝑒superscript𝑒e^{+}e^{-}\to e^{+}e^{-} events. Dots – experiment, histogram – simulation.
Refer to caption
Figure 19: The ratio of the ΞΈπœƒ\theta distributions of the e+​eβˆ’β†’e+​eβˆ’β†’superscript𝑒superscript𝑒superscript𝑒superscript𝑒e^{+}e^{-}\to e^{+}e^{-} and e+​eβˆ’β†’Ξ³β€‹Ξ³β†’superscript𝑒superscript𝑒𝛾𝛾e^{+}e^{-}\to\gamma\gamma events. Dots – experiment, histogram – simulation.

The cuts on the r1,2subscriptπ‘Ÿ12r_{1,2} also lead to some inaccuracy of the detection efficiency. To obtain the corresponding correction factor to the detection efficiency of the process e+​eβˆ’β†’ΞΌ+β€‹ΞΌβˆ’β†’superscript𝑒superscript𝑒superscriptπœ‡superscriptπœ‡e^{+}e^{-}\to\mu^{+}\mu^{-}, the events of the process e+​eβˆ’β†’Ο€+β€‹Ο€βˆ’β†’superscript𝑒superscript𝑒superscriptπœ‹superscriptπœ‹e^{+}e^{-}\to\pi^{+}\pi^{-} were used because in the region r1,2>0.1subscriptπ‘Ÿ120.1r_{1,2}>0.1 cm the cosmic background dominates and for its rejection the muon system veto is required, which excludes the e+​eβˆ’β†’ΞΌ+β€‹ΞΌβˆ’β†’superscript𝑒superscript𝑒superscriptπœ‡superscriptπœ‡e^{+}e^{-}\to\mu^{+}\mu^{-} events also. At the energies under study, muons and pions velocities are about the same and the drift chamber response on their passage is just the same. In order to exclude the events of the e+​eβˆ’β†’K+​Kβˆ’β†’superscript𝑒superscript𝑒superscript𝐾superscript𝐾e^{+}e^{-}\to K^{+}K^{-} process, the correction coefficient was obtained by using data collected at the energy s=980𝑠980\sqrt{s}=980 MeV. MC simulation shows that the ratio of event numbers with r1,2<0.1subscriptπ‘Ÿ120.1r_{1,2}<0.1 and r1,2>0.1subscriptπ‘Ÿ120.1r_{1,2}>0.1 is the same for e+​eβˆ’β†’ΞΌ+β€‹ΞΌβˆ’β†’superscript𝑒superscript𝑒superscriptπœ‡superscriptπœ‡e^{+}e^{-}\to\mu^{+}\mu^{-} and e+​eβˆ’β†’Ο€+β€‹Ο€βˆ’β†’superscript𝑒superscript𝑒superscriptπœ‹superscriptπœ‹e^{+}e^{-}\to\pi^{+}\pi^{-} processes and does not depend on energy.

As a result, the detection efficiency of the process e+​eβˆ’β†’ΞΌ+β€‹ΞΌβˆ’β†’superscript𝑒superscript𝑒superscriptπœ‡superscriptπœ‡e^{+}e^{-}\to\mu^{+}\mu^{-} was multiply by the correction coefficient Ξ΄rμ​μ=0.982Β±0.005subscriptsuperscriptπ›Ώπœ‡πœ‡π‘Ÿplus-or-minus0.9820.005\delta^{\mu\mu}_{r}=0.982\pm 0.005. The error is due to uncertainty of the cosmic muons background subtraction and it was added to the systematic error of the detection efficiency. Analogously the correction coefficient Ξ΄re​e=0.993subscriptsuperscriptπ›Ώπ‘’π‘’π‘Ÿ0.993\delta^{ee}_{r}=0.993 was used for the I​Le​e𝐼subscript𝐿𝑒𝑒IL_{ee} measurement.

The energy deposition spectra in calorimeter for eΒ±superscript𝑒plus-or-minuse^{\pm} and γ𝛾\gamma are shown in Fig.8 and 8. The experimental and simulated distributions are in good agreement. The detection efficiency correction factor values due to the cuts E1,2/E0>0.7subscript𝐸12subscript𝐸00.7E_{1,2}/E_{0}>0.7 are usually less than 1%, but in some energy points it reaches about 3% and was taken into account for luminosity determination. This corrections are the same for both e+​eβˆ’β†’e+​eβˆ’β†’superscript𝑒superscript𝑒superscript𝑒superscript𝑒e^{+}e^{-}\to e^{+}e^{-} and e+​eβˆ’β†’Ξ³β€‹Ξ³β†’superscript𝑒superscript𝑒𝛾𝛾e^{+}e^{-}\to\gamma\gamma processes – the average value of the correction factors ratio is equal to 1.001Β±0.001plus-or-minus1.0010.0011.001\pm 0.001.

The Δ​ϕΔitalic-Ο•\Delta\phi and Ξ”β€‹ΞΈΞ”πœƒ\Delta\theta distributions of the e+​eβˆ’β†’e+​eβˆ’β†’superscript𝑒superscript𝑒superscript𝑒superscript𝑒e^{+}e^{-}\to e^{+}e^{-}, γ​γ𝛾𝛾\gamma\gamma and ΞΌ+β€‹ΞΌβˆ’superscriptπœ‡superscriptπœ‡\mu^{+}\mu^{-} events are shown in Fig.10, 10, 12, 12, 14 and 14. As a measure of the systematic uncertainty due to the Ξ”β€‹ΞΈΞ”πœƒ\Delta\theta cut, the following parameter was used:

δΔ​θx=nx​(|Δ​θ|<10∘)Nx​(|Δ​θ|<20∘)​ / ​mx​(|Δ​θ|<10∘)Mx​(|Δ​θ|<20∘), ​x=μ​μ​(e​e).formulae-sequencesubscriptsuperscript𝛿π‘₯Ξ”πœƒsubscript𝑛π‘₯Ξ”πœƒsuperscript10subscript𝑁π‘₯Ξ”πœƒsuperscript20Β Β subscriptπ‘šπ‘₯Ξ”πœƒsuperscript10subscript𝑀π‘₯Ξ”πœƒsuperscript20Β π‘₯πœ‡πœ‡π‘’π‘’\displaystyle\delta^{x}_{\Delta\theta}={n_{x}(|\Delta\theta|<10^{\circ})\over N_{x}(|\Delta\theta|<20^{\circ})}\mbox{~{}}/\mbox{~{}}{m_{x}(|\Delta\theta|<10^{\circ})\over M_{x}(|\Delta\theta|<20^{\circ})},\mbox{~{}~{}}x=\mu\mu(ee). (9)

Here nx​(|Δ​θ|<10∘)subscript𝑛π‘₯Ξ”πœƒsuperscript10n_{x}(|\Delta\theta|<10^{\circ}) and mx​(|Δ​θ|<10∘)subscriptπ‘šπ‘₯Ξ”πœƒsuperscript10m_{x}(|\Delta\theta|<10^{\circ}) are the numbers of experimental and simulated events selected under the condition |Δ​θ|<10βˆ˜Ξ”πœƒsuperscript10|\Delta\theta|<10^{\circ}, while Nx​(|Δ​θ|<20∘)subscript𝑁π‘₯Ξ”πœƒsuperscript20N_{x}(|\Delta\theta|<20^{\circ}) and Mx​(|Δ​θ|<20∘)subscript𝑀π‘₯Ξ”πœƒsuperscript20M_{x}(|\Delta\theta|<20^{\circ}) are the numbers of experimental and simulated events with |Δ​θ|<20βˆ˜Ξ”πœƒsuperscript20|\Delta\theta|<20^{\circ}. The average values of δΔ​θe​esuperscriptsubscriptπ›ΏΞ”πœƒπ‘’π‘’\delta_{\Delta\theta}^{ee} and δΔ​θμ​μsuperscriptsubscriptπ›ΏΞ”πœƒπœ‡πœ‡\delta_{\Delta\theta}^{\mu\mu} are equal to 0.999, and have systematic spread of 0.002 and 0.007 respectively. The δΔ​θe​esuperscriptsubscriptπ›ΏΞ”πœƒπ‘’π‘’\delta_{\Delta\theta}^{ee} and δΔ​θμ​μsuperscriptsubscriptπ›ΏΞ”πœƒπœ‡πœ‡\delta_{\Delta\theta}^{\mu\mu} were used as correction coefficients to the detection efficiencies of corresponding processes.

The variation of the Ξ”β€‹ΞΈΞ”πœƒ\Delta\theta cut by 5∘superscript55^{\circ} for the e+​eβˆ’β†’Ξ³β€‹Ξ³β†’superscript𝑒superscript𝑒𝛾𝛾e^{+}e^{-}\to\gamma\gamma process leads to the variation of the integrated luminosity I​Lγ​γ𝐼subscript𝐿𝛾𝛾IL_{\gamma\gamma} by 0.9%. This value was added to the systematic uncertainty of the integrated luminosity measurement. Systematic error due to the Δ​ϕΔitalic-Ο•\Delta\phi cut was found to be negligible for all processes.
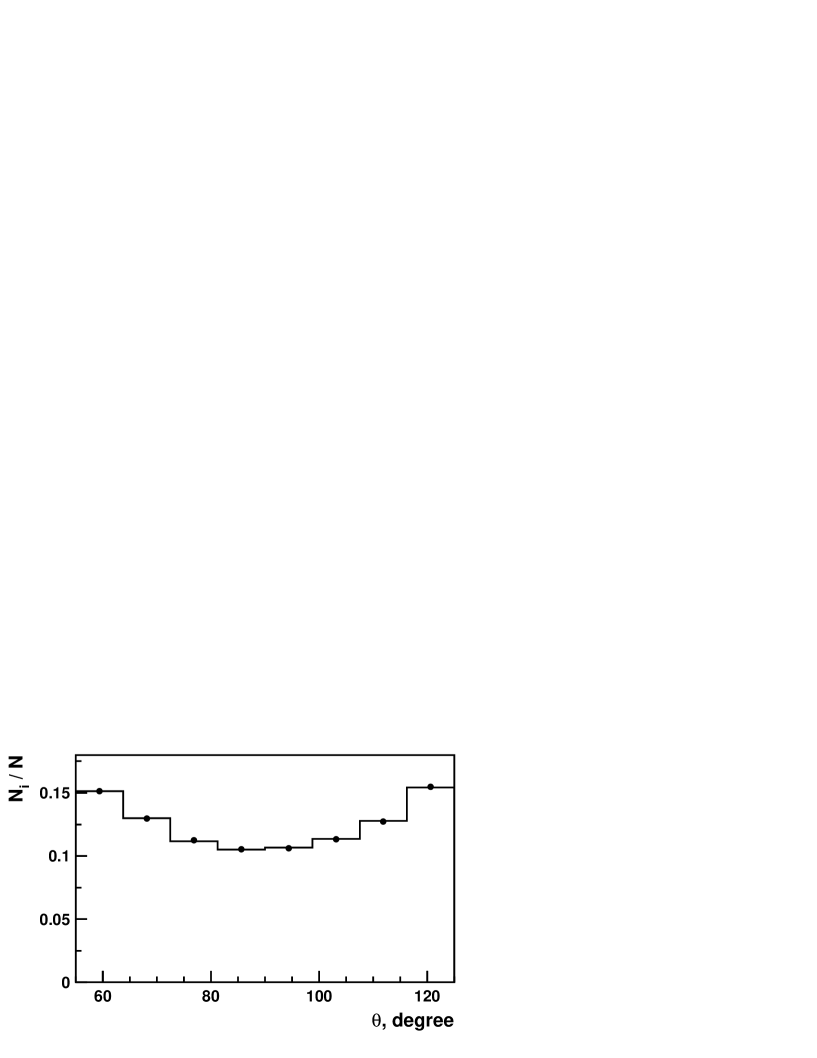
The polar angle distributions for the e+​eβˆ’β†’e+​eβˆ’β†’superscript𝑒superscript𝑒superscript𝑒superscript𝑒e^{+}e^{-}\to e^{+}e^{-}, e+​eβˆ’β†’ΞΌ+β€‹ΞΌβˆ’β†’superscript𝑒superscript𝑒superscriptπœ‡superscriptπœ‡e^{+}e^{-}\to\mu^{+}\mu^{-} and e+​eβˆ’β†’Ξ³β€‹Ξ³β†’superscript𝑒superscript𝑒𝛾𝛾e^{+}e^{-}\to\gamma\gamma processes are shown in Fig.16, 16 and 18. The ratios of these ΞΈπœƒ\theta distributions are shown in Fig.18 and 19. The experimental and simulated distributions are in good agreement. The shapes of the distributions do not depend on energy and for all processes is almost the same for the angles ΞΈβ‰ˆ80βˆ˜πœƒsuperscript80\theta\approx 80^{\circ}. Using all collected data, the following coefficients were obtained

δθx=nxNx​ / ​mxMx, ​x=μ​μ​(e​e,γ​γ),formulae-sequencesuperscriptsubscriptπ›Ώπœƒπ‘₯subscript𝑛π‘₯subscript𝑁π‘₯Β Β subscriptπ‘šπ‘₯subscript𝑀π‘₯Β π‘₯πœ‡πœ‡π‘’π‘’π›Ύπ›Ύ\displaystyle\delta_{\theta}^{x}={n_{x}\over N_{x}}\mbox{~{}}/\mbox{~{}}{m_{x}\over M_{x}},\mbox{~{}~{}}x=\mu\mu(ee,\gamma\gamma), (10)

where Nxsubscript𝑁π‘₯N_{x} and Mxsubscript𝑀π‘₯M_{x} are the experimental and simulated event numbers in the angular range 55∘<ΞΈ<125∘superscript55πœƒsuperscript12555^{\circ}<\theta<125^{\circ}, while nxsubscript𝑛π‘₯n_{x} and mxsubscriptπ‘šπ‘₯m_{x} are the experimental and simulated event numbers in the angular range 80∘<ΞΈ<100∘superscript80πœƒsuperscript10080^{\circ}<\theta<100^{\circ}. In order to estimate the systematic inaccuracy due to the cut on the ΞΈπœƒ\theta angle, the following ratio was used:

δθ=δθxδθy, ​x=μ​μ​(e​e), ​y=e​e​(γ​γ)formulae-sequencesubscriptπ›Ώπœƒsuperscriptsubscriptπ›Ώπœƒπ‘₯superscriptsubscriptπ›Ώπœƒπ‘¦formulae-sequenceΒ π‘₯πœ‡πœ‡π‘’π‘’Β π‘¦π‘’π‘’π›Ύπ›Ύ\displaystyle\delta_{\theta}={\delta_{\theta}^{x}\over\delta_{\theta}^{y}},\mbox{~{}~{}}x=\mu\mu(ee),\mbox{~{}~{}}y=ee(\gamma\gamma) (11)

This ratio was used as the correction factor to the cross section. For the process e+​eβˆ’β†’ΞΌ+β€‹ΞΌβˆ’β†’superscript𝑒superscript𝑒superscriptπœ‡superscriptπœ‡e^{+}e^{-}\to\mu^{+}\mu^{-}, the δθsubscriptπ›Ώπœƒ\delta_{\theta} is equal to 1.015Β±0.010plus-or-minus1.0150.0101.015\pm 0.010 and 1.02Β±0.01plus-or-minus1.020.011.02\pm 0.01 when it is normalized on the e+​eβˆ’β†’e+​eβˆ’β†’superscript𝑒superscript𝑒superscript𝑒superscript𝑒e^{+}e^{-}\to e^{+}e^{-} and e+​eβˆ’β†’Ξ³β€‹Ξ³β†’superscript𝑒superscript𝑒𝛾𝛾e^{+}e^{-}\to\gamma\gamma processes respectively. For the process e+​eβˆ’β†’e+​eβˆ’β†’superscript𝑒superscript𝑒superscript𝑒superscript𝑒e^{+}e^{-}\to e^{+}e^{-} normalized on the e+​eβˆ’β†’Ξ³β€‹Ξ³β†’superscript𝑒superscript𝑒𝛾𝛾e^{+}e^{-}\to\gamma\gamma events, δθ=0.995Β±0.005subscriptπ›Ώπœƒplus-or-minus0.9950.005\delta_{\theta}=0.995\pm 0.005. The δθsubscriptπ›Ώπœƒ\delta_{\theta} error was included in the total systematic error.

The first-level trigger selection criteria for the e+​eβˆ’β†’Ξ³β€‹Ξ³β†’superscript𝑒superscript𝑒𝛾𝛾e^{+}e^{-}\to\gamma\gamma process events included the absence of tracks in the short drift chamber (nearest to the beam-pipe). This leads to the trigger dead time due to the overlap of a background track. The trigger inefficiency of about 5% was hardware measured during the data tacking and was taken into account in the analysis.

In e+​eβˆ’β†’Ξ³β€‹Ξ³β†’superscript𝑒superscript𝑒𝛾𝛾e^{+}e^{-}\to\gamma\gamma process events, the charged particle can appear due to the photon conversion on the detector material before the tracking system. As a measure of the systematic inaccuracy associated to this effect, the difference from unity of the following quantity was used:

Ξ΄c​o​n=(1βˆ’n3​N)/(1βˆ’m3​M),subscriptπ›Ώπ‘π‘œπ‘›1𝑛3𝑁1π‘š3𝑀\displaystyle\delta_{con}=\biggl{(}1-{n\over 3N}\biggr{)}/\biggl{(}1-{m\over 3M}\biggr{)}, (12)

where N𝑁N and M𝑀M are the photon numbers in the experiment and simulation; n𝑛n and mπ‘šm are the photons in the experiment and simulation which had a track in the second drift chamber. The probability to find a track was divided by 3 which is the ratio of amounts of matter between the drift chambers and before the tracking system. The result Ξ΄c​o​n=0.998Β±0.002subscriptπ›Ώπ‘π‘œπ‘›plus-or-minus0.9980.002\delta_{con}=0.998\pm 0.002 shows that the difference between photon conversion probabilities in the experiment and simulation does not contribute much in the error of the measurements.

III.4 Measured cross sections.

The cross sections of the process e+​eβˆ’β†’ΞΌ+β€‹ΞΌβˆ’β†’superscript𝑒superscript𝑒superscriptπœ‡superscriptπœ‡e^{+}e^{-}\to\mu^{+}\mu^{-} and e+​eβˆ’β†’e+​eβˆ’β†’superscript𝑒superscript𝑒superscript𝑒superscript𝑒e^{+}e^{-}\to e^{+}e^{-} are listed in the TableΒ 1. The total systematic error of the cross section σμ​μe​esuperscriptsubscriptπœŽπœ‡πœ‡π‘’π‘’\sigma_{\mu\mu}^{ee} (obtained by using I​Le​e𝐼subscript𝐿𝑒𝑒IL_{ee} luminosity) determination is

Οƒs​y​s=Οƒe​f​fβŠ•Οƒb​k​gβŠ•Οƒr​a​dβŠ•ΟƒI​L=1.6%.subscriptπœŽπ‘ π‘¦π‘ direct-sumsubscriptπœŽπ‘’π‘“π‘“subscriptπœŽπ‘π‘˜π‘”subscriptπœŽπ‘Ÿπ‘Žπ‘‘subscript𝜎𝐼𝐿percent1.6\sigma_{sys}=\sigma_{eff}\oplus\sigma_{bkg}\oplus\sigma_{rad}\oplus\sigma_{IL}=1.6\%.

Here Οƒe​f​fsubscriptπœŽπ‘’π‘“π‘“\sigma_{eff} is the systematic error of the detection efficiency determination, Οƒb​k​gsubscriptπœŽπ‘π‘˜π‘”\sigma_{bkg} is the systematic error due to background subtraction, ΟƒI​Lsubscript𝜎𝐼𝐿\sigma_{IL} is the systematic error of integrated luminosity determination due to inaccuracy of the e+​eβˆ’β†’e+​eβˆ’β†’superscript𝑒superscript𝑒superscript𝑒superscript𝑒e^{+}e^{-}\to e^{+}e^{-} cross section calculation and Οƒr​a​dsubscriptπœŽπ‘Ÿπ‘Žπ‘‘\sigma_{rad} is the uncertainty of the radiative correction calculation. The magnitudes of various contributions to the total systematic error are shown in TableΒ 2.

Table 1: The main results of this work. σμ​μγ​γsuperscriptsubscriptπœŽπœ‡πœ‡π›Ύπ›Ύ\sigma_{\mu\mu}^{\gamma\gamma} is the e+​eβˆ’β†’ΞΌ+β€‹ΞΌβˆ’β†’superscript𝑒superscript𝑒superscriptπœ‡superscriptπœ‡e^{+}e^{-}\to\mu^{+}\mu^{-} cross section obtained by using luminosity I​Lγ​γ𝐼subscript𝐿𝛾𝛾IL_{\gamma\gamma}, Οƒe​e​(Ξ³)subscriptπœŽπ‘’π‘’π›Ύ\sigma_{ee(\gamma)} is the cross section of the process e+​eβˆ’β†’e+​eβˆ’β†’superscript𝑒superscript𝑒superscript𝑒superscript𝑒e^{+}e^{-}\to e^{+}e^{-} in the angular range 30∘<ΞΈeΒ±<150∘superscript30subscriptπœƒsuperscript𝑒plus-or-minussuperscript15030^{\circ}<\theta_{e^{\pm}}<150^{\circ}. Only uncorrelated errors are shown. The correlated systematic error Οƒs​y​ssubscriptπœŽπ‘ π‘¦π‘ \sigma_{sys} is 1.8% for σμ​μγ​γsuperscriptsubscriptπœŽπœ‡πœ‡π›Ύπ›Ύ\sigma_{\mu\mu}^{\gamma\gamma} and 1.1% for Οƒe​e​(Ξ³)subscriptπœŽπ‘’π‘’π›Ύ\sigma_{ee(\gamma)}.
s𝑠\sqrt{s} (MeV) σμ​μγ​γsuperscriptsubscriptπœŽπœ‡πœ‡π›Ύπ›Ύ\sigma_{\mu\mu}^{\gamma\gamma}, nb Οƒe​e​(Ξ³)subscriptπœŽπ‘’π‘’π›Ύ\sigma_{ee(\gamma)}, nb
980 96.3Β±plus-or-minus\pm5.6 2898Β±plus-or-minus\pm34
1040 83.6Β±plus-or-minus\pm4.4 2539Β±plus-or-minus\pm44
1050 82.3Β±plus-or-minus\pm4.0 2553Β±plus-or-minus\pm39
1060 84.1Β±plus-or-minus\pm3.7 2512Β±plus-or-minus\pm44
1070 80.6Β±plus-or-minus\pm3.5 2441Β±plus-or-minus\pm36
1080 82.7Β±plus-or-minus\pm3.7 2351Β±plus-or-minus\pm41
1090 72.8Β±plus-or-minus\pm3.0 2316Β±plus-or-minus\pm35
1100 77.8Β±plus-or-minus\pm3.8 2371Β±plus-or-minus\pm26
1110 69.7Β±plus-or-minus\pm2.9 2288Β±plus-or-minus\pm36
1120 71.6Β±plus-or-minus\pm3.7 2195Β±plus-or-minus\pm37
1130 71.6Β±plus-or-minus\pm2.7 2170Β±plus-or-minus\pm31
1140 67.6Β±plus-or-minus\pm3.4 2170Β±plus-or-minus\pm36
1150 70.7Β±plus-or-minus\pm4.0 2121Β±plus-or-minus\pm38
1160 73.0Β±plus-or-minus\pm3.2 2091Β±plus-or-minus\pm31
1180 66.8Β±plus-or-minus\pm3.1 2073Β±plus-or-minus\pm31
1190 61.8Β±plus-or-minus\pm2.4 1936Β±plus-or-minus\pm25
1200 66.8Β±plus-or-minus\pm4.4 1961Β±plus-or-minus\pm21
1210 65.6Β±plus-or-minus\pm2.7 1872Β±plus-or-minus\pm26
1220 58.5Β±plus-or-minus\pm2.5 1853Β±plus-or-minus\pm26
1230 67.6Β±plus-or-minus\pm3.2 1858Β±plus-or-minus\pm26
1240 59.3Β±plus-or-minus\pm2.4 1794Β±plus-or-minus\pm24
1250 58.8Β±plus-or-minus\pm2.1 1798Β±plus-or-minus\pm22
1260 56.7Β±plus-or-minus\pm2.3 1718Β±plus-or-minus\pm23
1270 57.9Β±plus-or-minus\pm1.8 1728Β±plus-or-minus\pm21
1280 53.5Β±plus-or-minus\pm1.7 1664Β±plus-or-minus\pm20
1290 51.1Β±plus-or-minus\pm1.5 1668Β±plus-or-minus\pm19

Table I: (Continued)

s𝑠\sqrt{s} (MeV) σμ​μγ​γsuperscriptsubscriptπœŽπœ‡πœ‡π›Ύπ›Ύ\sigma_{\mu\mu}^{\gamma\gamma}, nb Οƒe​e​(Ξ³)subscriptπœŽπ‘’π‘’π›Ύ\sigma_{ee(\gamma)}, nb
1300 54.4Β±plus-or-minus\pm1.6 1638Β±plus-or-minus\pm18
1310 52.7Β±plus-or-minus\pm2.0 1608Β±plus-or-minus\pm21
1320 48.5Β±plus-or-minus\pm1.9 1556Β±plus-or-minus\pm19
1330 52.9Β±plus-or-minus\pm1.8 1538Β±plus-or-minus\pm18
1340 49.8Β±plus-or-minus\pm1.7 1586Β±plus-or-minus\pm20
1350 49.5Β±plus-or-minus\pm2.1 1507Β±plus-or-minus\pm18
1360 50.9Β±plus-or-minus\pm1.7 1541Β±plus-or-minus\pm19
1370 45.0Β±plus-or-minus\pm1.9 1476Β±plus-or-minus\pm18
1380 48.4Β±plus-or-minus\pm1.5 1459Β±plus-or-minus\pm15
Table 2: Various contributions to the systematic error of the cross sections determination. Οƒs​y​ssubscriptπœŽπ‘ π‘¦π‘ \sigma_{sys} is the total systematic error.
the source of the erorr contribution to contribution to contribution to
σμ​μe​esuperscriptsubscriptπœŽπœ‡πœ‡π‘’π‘’\sigma_{\mu\mu}^{ee} σμ​μγ​γsuperscriptsubscriptπœŽπœ‡πœ‡π›Ύπ›Ύ\sigma_{\mu\mu}^{\gamma\gamma} Οƒe​e​(Ξ³)subscriptπœŽπ‘’π‘’π›Ύ\sigma_{ee(\gamma)}
the ΞΈπœƒ\theta distribution 1.0 % 1.0 % 0.5 %
the rπ‘Ÿr distribution 0.5 % 0.5 % –
Οƒe​f​fsubscriptπœŽπ‘’π‘“π‘“\sigma_{eff} 1.1 % 1.1 % 0.5 %
the cosmic background subtraction 0.5 % 0.5 % –
the background from the e+​eβˆ’β†’Ο€+β€‹Ο€βˆ’β†’superscript𝑒superscript𝑒superscriptπœ‹superscriptπœ‹e^{+}e^{-}\to\pi^{+}\pi^{-}
process subtraction 0.7 % 0.7 % –
Οƒb​k​gsubscriptπœŽπ‘π‘˜π‘”\sigma_{bkg} 0.9 % 0.9 % –
Οƒr​a​dsubscriptπœŽπ‘Ÿπ‘Žπ‘‘\sigma_{rad} 0.5 % 0.5 % –
the Ξ”β€‹ΞΈΞ”πœƒ\Delta\theta distribution in the e+​eβˆ’β†’Ξ³β€‹Ξ³β†’superscript𝑒superscript𝑒𝛾𝛾e^{+}e^{-}\to\gamma\gamma process – 0.9 % 0.9 %
calculation of the e+​eβˆ’β†’e+​eβˆ’β†’superscript𝑒superscript𝑒superscript𝑒superscript𝑒e^{+}e^{-}\to e^{+}e^{-}
process cross section 0.5 % – –
calculation of the e+​eβˆ’β†’Ξ³β€‹Ξ³β†’superscript𝑒superscript𝑒𝛾𝛾e^{+}e^{-}\to\gamma\gamma
process cross section – 0.5 % 0.5 %
ΟƒI​Lsubscript𝜎𝐼𝐿\sigma_{IL} 0.5 % 1.0 % 1.0 %
Οƒs​y​ssubscriptπœŽπ‘ π‘¦π‘ \sigma_{sys} 1.6 % 1.8 % 1.1 %

The total systematic error of the cross section σμ​μγ​γsuperscriptsubscriptπœŽπœ‡πœ‡π›Ύπ›Ύ\sigma_{\mu\mu}^{\gamma\gamma} (obtained by using I​Lγ​γ𝐼subscript𝐿𝛾𝛾IL_{\gamma\gamma} luminosity) determination is

Οƒs​y​s=Οƒe​f​fβŠ•Οƒb​k​gβŠ•Οƒr​a​dβŠ•ΟƒI​L=1.8%.subscriptπœŽπ‘ π‘¦π‘ direct-sumsubscriptπœŽπ‘’π‘“π‘“subscriptπœŽπ‘π‘˜π‘”subscriptπœŽπ‘Ÿπ‘Žπ‘‘subscript𝜎𝐼𝐿percent1.8\sigma_{sys}=\sigma_{eff}\oplus\sigma_{bkg}\oplus\sigma_{rad}\oplus\sigma_{IL}=1.8\%.

Here ΟƒI​Lsubscript𝜎𝐼𝐿\sigma_{IL} is the systematic error of the integrated luminosity determination which includes the inaccuracy of the e+​eβˆ’β†’Ξ³β€‹Ξ³β†’superscript𝑒superscript𝑒𝛾𝛾e^{+}e^{-}\to\gamma\gamma cross section calculation and the Ξ”β€‹ΞΈΞ”πœƒ\Delta\theta angle measurement error. The magnitudes of various contributions to the total systematic error are shown in TableΒ 2.

The total systematic error of the Οƒe​e​(Ξ³)subscriptπœŽπ‘’π‘’π›Ύ\sigma_{ee(\gamma)} cross section determination (of the e+​eβˆ’β†’e+​eβˆ’β†’superscript𝑒superscript𝑒superscript𝑒superscript𝑒e^{+}e^{-}\to e^{+}e^{-} process in the angular region 30∘<ΞΈeΒ±<150∘superscript30subscriptπœƒsuperscript𝑒plus-or-minussuperscript15030^{\circ}<\theta_{e^{\pm}}<150^{\circ}) is

Οƒs​y​s=Οƒe​f​fβŠ•ΟƒI​L=1.1%.subscriptπœŽπ‘ π‘¦π‘ direct-sumsubscriptπœŽπ‘’π‘“π‘“subscript𝜎𝐼𝐿percent1.1\sigma_{sys}=\sigma_{eff}\oplus\sigma_{IL}=1.1\%.

The magnitudes of various contributions are also listed in TableΒ 2.

IV Discussion.

The measured cross section of the process e+​eβˆ’β†’e+​eβˆ’β†’superscript𝑒superscript𝑒superscript𝑒superscript𝑒e^{+}e^{-}\to e^{+}e^{-} (TableΒ 1) was fitted with the following expression:

Οƒe​e​(Ξ³)=Cf​i​tΓ—CB​H​W​I​D​Es,\sigma_{ee(\gamma)}=C_{fit}\times{C_{BHWIDE}\over s,}

where CB​H​W​I​D​EsubscriptπΆπ΅π»π‘ŠπΌπ·πΈC_{BHWIDE} is the coefficient calculated by using BHWIDE code bhwide . The accuracy of calculation is about 0.5 %. Cf​i​tsubscript𝐢𝑓𝑖𝑑C_{fit} is the ratio of the measured cross section to theoretically expected (calculated) value and it was a free parameter of the fit. As a result, it was obtained that (Fig.21):

Cf​i​t=0.999Β±0.002Β±0.011subscript𝐢𝑓𝑖𝑑plus-or-minus0.9990.0020.011C_{fit}=0.999\pm 0.002\pm 0.011

The measured value of the e+​eβˆ’β†’e+​eβˆ’β†’superscript𝑒superscript𝑒superscript𝑒superscript𝑒e^{+}e^{-}\to e^{+}e^{-} cross section is in good agreement with calculation.

The e+​eβˆ’β†’ΞΌ+β€‹ΞΌβˆ’β†’superscript𝑒superscript𝑒superscriptπœ‡superscriptπœ‡e^{+}e^{-}\to\mu^{+}\mu^{-} cross section was fited with the formula:

σμ​μ=4​π3​s​α​(0)2|1βˆ’Ξ β€‹(s)|2​β4​(6βˆ’2​β2)Γ—Cf​i​t, ​β=1βˆ’4​mΞΌs.formulae-sequencesubscriptπœŽπœ‡πœ‡4πœ‹3𝑠𝛼superscript02superscript1Π𝑠2𝛽462superscript𝛽2subscript𝐢𝑓𝑖𝑑 𝛽14subscriptπ‘šπœ‡π‘ \displaystyle\sigma_{\mu\mu}={4\pi\over 3s}{\alpha(0)^{2}\over|1-\Pi(s)|^{2}}{\beta\over 4}\biggl{(}6-2\beta^{2}\biggr{)}\times C_{fit},\mbox{~{}~{}}\beta=\sqrt{1-{4m_{\mu}\over s}}. (13)

From the fit of the σμ​μe​esuperscriptsubscriptπœŽπœ‡πœ‡π‘’π‘’\sigma_{\mu\mu}^{ee} cross section, it was found that

Cf​i​t=1.006Β±0.007Β±0.016,subscript𝐢𝑓𝑖𝑑plus-or-minus1.0060.0070.016C_{fit}=1.006\pm 0.007\pm 0.016,

that agrees well with theoretical predictions.

In the similar energy region s=370𝑠370\sqrt{s}=370–520520520 MeV, the e+​eβˆ’β†’ΞΌ+β€‹ΞΌβˆ’β†’superscript𝑒superscript𝑒superscriptπœ‡superscriptπœ‡e^{+}e^{-}\to\mu^{+}\mu^{-} process cross section was measured by CMD-2 detector with accuracy about 1.5 % kmd2 . In this experiment the integrated luminosity was obtained by using e+​eβˆ’β†’e+​eβˆ’β†’superscript𝑒superscript𝑒superscript𝑒superscript𝑒e^{+}e^{-}\to e^{+}e^{-} process. The Cf​i​tsubscript𝐢𝑓𝑖𝑑C_{fit} for this data was found to be Cf​i​t=0.980Β±0.013Β±0.007subscript𝐢𝑓𝑖𝑑plus-or-minus0.9800.0130.007C_{fit}=0.980\pm 0.013\pm 0.007. In order to compare the SND and CMD-2 results, the following ratio was used:

Cf​i​tS​N​D/Cf​i​tC​M​Dβˆ’2=1.027Β±0.015Β±0.018superscriptsubscript𝐢𝑓𝑖𝑑𝑆𝑁𝐷superscriptsubscript𝐢𝑓𝑖𝑑𝐢𝑀𝐷2plus-or-minus1.0270.0150.018C_{fit}^{SND}/C_{fit}^{CMD-2}=1.027\pm 0.015\pm 0.018

The difference between the SND and CMD-2 results (Fig.21) is 1.2 standard deviations.

Refer to caption
Figure 20: The e+​eβˆ’β†’e+​eβˆ’β†’superscript𝑒superscript𝑒superscript𝑒superscript𝑒e^{+}e^{-}\to e^{+}e^{-} cross section in the angular range 30∘<ΞΈeΒ±<150∘superscript30subscriptπœƒsuperscript𝑒plus-or-minussuperscript15030^{\circ}<\theta_{e^{\pm}}<150^{\circ}. Dots are the SND data obtained in this work; the curve is the result of the fit (Ο‡2/Nd.o.f.=48.1/34superscriptπœ’2subscript𝑁formulae-sequenceπ‘‘π‘œπ‘“48.134\chi^{2}/N_{d.o.f.}=48.1/34).
Refer to caption
Figure 21: The ratio Οƒe​x​p/Οƒt​h​esubscriptπœŽπ‘’π‘₯𝑝subscriptπœŽπ‘‘β„Žπ‘’\sigma_{exp}/\sigma_{the} of the e+​eβˆ’β†’ΞΌ+β€‹ΞΌβˆ’β†’superscript𝑒superscript𝑒superscriptπœ‡superscriptπœ‡e^{+}e^{-}\to\mu^{+}\mu^{-} cross section measured by SND (⋆⋆\star, this work) and CMD-2 (βˆ™βˆ™\bullet) kmd2 to theoretical value. The horizontal bars show the energy region s𝑠\sqrt{s} in which the cross section was measured.
Refer to caption
Figure 22: The e+​eβˆ’β†’ΞΌ+β€‹ΞΌβˆ’β†’superscript𝑒superscript𝑒superscriptπœ‡superscriptπœ‡e^{+}e^{-}\to\mu^{+}\mu^{-} cross section obtained by using I​Lγ​γ𝐼subscript𝐿𝛾𝛾IL_{\gamma\gamma}. Dots are the SND data obtained in this work; the curve is the result of the fit (Ο‡2/Nd.o.f.=37.2/34superscriptπœ’2subscript𝑁formulae-sequenceπ‘‘π‘œπ‘“37.234\chi^{2}/N_{d.o.f.}=37.2/34).
Refer to caption
Figure 23: The α​(s)βˆ’1𝛼superscript𝑠1\alpha(s)^{-1} values obtained by using different experiments results. The SND (⋆⋆\star, this work), TOPAZ (β– β– \blacksquare) topaz and OPAL (βˆ™βˆ™\bullet) opal results are presented. The dots from review kobel obtained using results of experiments at DORIS (∘\circ), PEP (β–‘β–‘\square) and PETRA (β–³β–³\triangle) colliders are presented also. Horizontal line shows the α​(0)βˆ’1𝛼superscript01\alpha(0)^{-1} value, curve is theoretical calculation of α​(s)βˆ’1𝛼superscript𝑠1\alpha(s)^{-1}.

From the fit of the σμ​μγ​γsuperscriptsubscriptπœŽπœ‡πœ‡π›Ύπ›Ύ\sigma_{\mu\mu}^{\gamma\gamma} cross section (TableΒ 1, Fig.23) it was found that

Cf​i​t=1.005Β±0.007Β±0.018.subscript𝐢𝑓𝑖𝑑plus-or-minus1.0050.0070.018C_{fit}=1.005\pm 0.007\pm 0.018.

If the fit is performed fit with the average value <1/Ξ±>expectation1𝛼<1/\alpha> as a free parameter, that is by using the function to fit data fit function:

σμ​μ=4​π3​s​β4​(6βˆ’2​β2)Γ—[1<1/Ξ±>]2,subscriptπœŽπœ‡πœ‡4πœ‹3𝑠𝛽462superscript𝛽2superscriptdelimited-[]1expectation1𝛼2\displaystyle\sigma_{\mu\mu}={4\pi\over 3s}{\beta\over 4}\biggl{(}6-2\beta^{2}\biggr{)}\times\biggl{[}{1\over<1/\alpha>}\biggr{]}^{2}, (14)

then

<1/Ξ±>=134.1Β±0.5Β±1.2expectation1𝛼plus-or-minus134.10.51.2<1/\alpha>=134.1\pm 0.5\pm 1.2

This value of <1/Ξ±>expectation1𝛼<1/\alpha> agrees with expected one, the difference from α​(0)𝛼0\alpha(0) is 2.3 standard deviations. The obtained value of <1/Ξ±>expectation1𝛼<1/\alpha> together with other results in the time-like region is shown in Fig.23. The black markers denote the measurements with normalization independent from vacuum polarization diagrams. The results of this work is the only measurement of such a type at the low energy (≃1similar-to-or-equalsabsent1\simeq 1 GeV) region.

A new e+​eβˆ’superscript𝑒superscript𝑒e^{+}e^{-} collider VEPP-2000 for the energy region s𝑠\sqrt{s} up to 2 GeV with SND and CMD-2 detectors have now being launching. In the future experiments the e+​eβˆ’β†’ΞΌ+β€‹ΞΌβˆ’β†’superscript𝑒superscript𝑒superscriptπœ‡superscriptπœ‡e^{+}e^{-}\to\mu^{+}\mu^{-} cross section can be measured with accuracy better then 1 % and it will be a good test of the theory.

V Conclusion

The cross section of the process e+​eβˆ’β†’ΞΌ+β€‹ΞΌβˆ’β†’superscript𝑒superscript𝑒superscriptπœ‡superscriptπœ‡e^{+}e^{-}\to\mu^{+}\mu^{-} was measured in the SND experiment at the VEPP-2M e+​eβˆ’superscript𝑒superscript𝑒e^{+}e^{-} collider in the energy region s=980,𝑠980\sqrt{s}=980, 1040 – 1380 MeV using integrated luminosity obtained from the e+​eβˆ’β†’e+​eβˆ’β†’superscript𝑒superscript𝑒superscript𝑒superscript𝑒e^{+}e^{-}\to e^{+}e^{-} and e+​eβˆ’β†’Ξ³β€‹Ξ³β†’superscript𝑒superscript𝑒𝛾𝛾e^{+}e^{-}\to\gamma\gamma processes. The accuracy of the cross section determination is about 1.6% and 1.8% respectively. The ratio of the measured cross section to the theoretically predicted value is 1.006Β±0.007Β±0.016plus-or-minus1.0060.0070.0161.006\pm 0.007\pm 0.016 and 1.005Β±0.007Β±0.018plus-or-minus1.0050.0070.0181.005\pm 0.007\pm 0.018 in the first and second case respectively. Using results of the measurements, the electromagnetic coupling constant α𝛼\alpha was obtained in the energy region s=1040𝑠1040\sqrt{s}=1040 – 1380 MeV: <1/Ξ±>=134.1Β±0.5Β±1.2expectation1𝛼plus-or-minus134.10.51.2<1/\alpha>=134.1\pm 0.5\pm 1.2. The cross section of the process e+​eβˆ’β†’e+​eβˆ’β†’superscript𝑒superscript𝑒superscript𝑒superscript𝑒e^{+}e^{-}\to e^{+}e^{-} was also measured in the angular region 30∘<ΞΈeΒ±<150∘superscript30subscriptπœƒsuperscript𝑒plus-or-minussuperscript15030^{\circ}<\theta_{e^{\pm}}<150^{\circ} with systematic accuracy 1.1%. The ratio of the measured cross section to the theoretically calculated one is 0.999Β±0.002Β±0.011plus-or-minus0.9990.0020.0110.999\pm 0.002\pm 0.011.

Acknowledgements.
The work is supported in part by RF Presidential Grant for Sc. Sch. NSh-5655.2008.2, RFBR 08-02-00328-a, 08-02-00660-a, 08-02-00634-a, 06-02-16192-a, 06-02-16294-a.

References

  • (1) B. Borgia et al., Lett. Nuovo Cim. 3, 115 (1972)
  • (2) V.E. Balakin et al., Phys. Lett. 37B, 435 (1971)
  • (3) V. Alles-Borelli et al., Phys. Lett. 59B, 201 (1975)
  • (4) R.R. Akhmetshin et al, Pisma. Zh. Eksp. Teor. Fiz. 84, 491 (2006) [JETP Lett. 84, 413 (2006)]
  • (5) L.M. Kurdadze et al., Yad. Fiz. 35, 352, (1982) [Sov. J. Nucl. Phys. 35, 201 (1982)]
  • (6) F. Ambrosino et al., Phys. Lett. B 608, 199 (2005)
  • (7) M.N. Achasov et al., Phys. Lett. B 456, 304 (1999)
  • (8) M.N. Achasov et al., Phys. Rev. Lett. 86, 1698 (2001)
  • (9) M.N. Achasov et al., Nucl. Instr. and Meth. A 449, 125 (2000)
  • (10) A.N. Skrinsky, in Proc. of Workshop on physics and detectors for DAΦΦ\PhiNE, Frascati, Italy, April 4-7, 1995, p.3
  • (11) E.A. Kuraev, V.S. Fadin, Yad. Fiz. 41, 733 (1985) [Sov. J. Nucl. Phys. 41, 466 (1985)]
  • (12) Yu.M. Bystritskiy et al., Phys. Rev. D 72, 114019 (2005)
  • (13) M.N. Achasov et al., Zh. Eksp. Teor. Fiz. 128, 1201 (2005)
  • (14) A.B. Arbuzov et al., JHEP 10, 001 (1997)
  • (15) F.A. Berends and R. Kleiss, Nucl. Phys. B 228, 537 (1983)
  • (16) F.A. Berends and R. Kleiss, Nucl. Phys. B 186, 22 (1981)
  • (17) S. Jadach, W. Placzek, B.F.L. Ward, Phys. Lett. B 390, 298 (1997)
  • (18) M.N. Achasov et al., Phys. Rev. D 63, 072002 (2001)
  • (19) L.M. Barkov, et al., Nucl. Phys. B256, 365, (1985)
  • (20) V.M. Aulchenko et al, Pisma. Zh. Eksp. Teor. Fiz. 82, 841 (2005) [JETP Lett. 82, 743 (2005)]
  • (21) L. Levine et al., Phys. Rev. Lett. 78(3), 424 (1997)
  • (22) G. Abbiendi et al., Eur. Phys. J. C 33, 173 (2004)
  • (23) M. Kobel, Direct Measurements of the Electromagnetic Coupling Constants at Large q2superscriptπ‘ž2q^{2}, FREIBURG-EHEP 97-13, Contributed paper to the XVIII Int. Symposium on Lepton Photon Interactions, Hamburg, July 1997.