0 [
]Modeling Massive Stars with Rotation: the Case
of Nitrogen Enrichments
A. Maeder, G. Meynet, S. Ekström, C. Georgy
Observatory of the Geneva University
Abstract
Recently, the concept of rotational mixing has been challenged by some authors (e.g. Hunter et al. 2008). We show that the excess N/H is a multivariate function . To find a correlation of a multivariate function with some parameter, it is evidently necessary to limit as much as possible the range of the other involved parameters. When this is done, the concept of rotational mixing is supported by the observations. We also show that the sample data are not free from several biases. A fraction of % of the stars may escape to the relation as a result of binary evolution.
Introduction
In the late 70’, the reality of mass loss in massive stars was debated as well as its effect on the evolution. When this became accepted at last (Chiosi & Maeder 1986), the next question was whether the large differences in the populations of massive stars (for example the WR/O and WN/WC star numbers) were due to differences in mass loss with metallicity . Today, the debate concerns the reality of rotational mixing and its effects on massive star evolution. History never reproduces itself similarly, nevertheless there is a great parallelism in these debates, which are normal steps in the progress of knowledge and finally lead to a better understanding of stellar physics and evolution.
There is an impressive list of consequences of stellar rotation (Maeder & Meynet 2000), many of which are supported by observations: about the stellar shape, the temperature distribution at the surface, the mass loss and its asymmetries, on the size of the cores, the tracks in the HR diagram, the lifetimes, the surface composition, the chemical yields, the ratios of the different kinds of massive stars (blue, red supergiants, WR stars), the types of supernovae and the remnant masses, etc. In this Liege Colloquium, the reality of the rotational mixing was disputed by several authors on the basis of new observations, in particular the VLT-Flames survey (Hunter et al. 2008). Thus, we concentrate here on this problem, firstly by recalling some theoretical predictions concerning surface enrichments and secondly by carefully examining the observations.
Recall of theoretical predictions concerning rotational mixing
In the mass range of 10 to 20 M⊙ considered here, mass loss has a limited importance during the Main Sequence (MS) phase. The changes of abundances are expected to be mainly due to rotational mixing. The main effect producing element mixing is the diffusion by shear turbulence, which itself results from the internal gradients built during evolution. To a smaller extent, meridional circulation makes some transport, however mainly of angular momentum. Mixing brings to the surface the products of CNO burning: mainly 14N and 13C enrichments, 12C is depleted with limited 4He enrichment and 16O depletion.
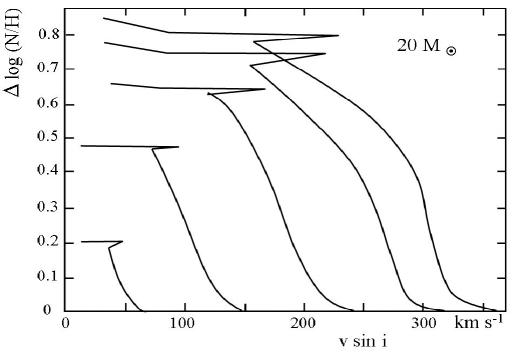
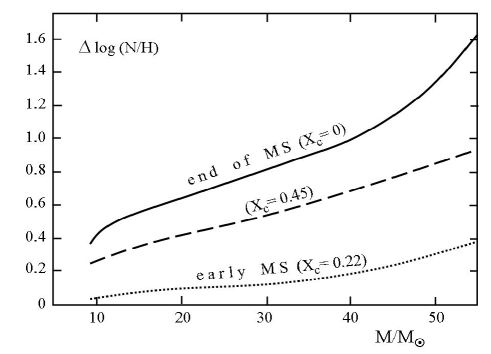
Fig. 1 shows the predicted variations of during MS evolution as a function of the initial masses (Meynet & Maeder 2000). (N/H) is here the abundance ratio of N and H in numbers (the relative differences in mass and number are the same). Without rotational mixing, there would be no enrichment until the red supergiant stage. Rotation produces an increase (depending on velocity ) of N/H during the MS phase. The N excesses also depend on the ages . The increase is modest during the first third of the MS phase, because the elements need some time to reach the surface, then it is more rapid. The N enrichments are larger for larger masses . Thus we see that the N excesses are multivariate functions
| (1) |
Models with lower initial metallicities have higher N enrichments for given and (Maeder & Meynet 2001; Meynet et al. 2006). The excesses become very strong at metallicities as low as .
Fig. 2 shows, for given and , the evolution of the N excesses with age for different initial velocities. This figure shows that there can be no single relation between and the N/H excesses for a mixture of ages. The same is true for a mixture of different masses.
Binarity may also affect the N and He enrichments due to tidal mixing and mass transfer. A binary star with low rotation may have a high N/H due to tidal mixing or due to the transfer of the enriched envelope of a red giant. At the opposite, a binary star may also have a high and no N/H excess, in the case of the accretion of an unevolved envelope bringing a lot of angular momentum. A nice illustration has been given (Martin, this meeting).
Study of the observed N/H excesses
The , age and dependences
Let us start by examining the mass, age and dependences of the N/H excesses. The data for different groups of stars with different are summarized in Table 1. In the Galaxy (), the main recent data sources (Herrero 2003; Venn & Przybilla 2003; Lyubimkov et al. 2004; Huang & Gies 2006; Trundle et al. 2007) support significant excesses of He or of (N/H). In the lowest mass range studied (6.6–8.2 M⊙), small excesses of He/H are still present (Lyubimkov et al. 2004). In the LMC (), the excesses are larger (Hunter et al. 2007; Trundle et al. 2007). In the SMC (), still much larger N excesses are observed (Venn, Przybilla 2003; Heap & Lanz 2006; Trundle et al. 2007; Hunter et al. 2007).
| Types of stars | Galaxy | LMC | SMC |
|---|---|---|---|
| O stars | 0.8 - 1.0 | – | 1.5 - 1.7 |
| B–dwarfs M⊙ | 0.5 | 0.7 - 0.9 | 1.1 |
| B giants, supg. M⊙ | – | 1.1 - 1.2 | 1.5 |
| B giants, supg. M⊙ | 0.5 - 0.7 | 1.3 | 1.9 |
These data show the following facts, consistent with theoretical predictions:
-
•
On the average, the N enrichments are larger for larger masses.
-
•
The N enrichments are larger at lower .
-
•
The He and N enrichments increase with the distance to the ZAMS (Huang & Geiss 2006). They are even larger in the giant and supergiant stages (Venn & Przybilla 2003). This property is also well observable for example in N11 (Fig. 34 of Hunter et al. 2007) and in NGC 2004 (Fig. 2 by Trundle et al. 2007).
The dependence of the N/H excesses
Several correlations of the N or He excesses with the observed have been performed. Huang and Gies (2006) and Lyubimkov et al. (2004) find a correlation of the He excesses with for B stars in the upper part of the MS band in agreement with model predictions.
In other comparisons (Hunter et al. 2008; Langer, this meeting; Brott, this meeting), the authors conclude that “the observation …challenges the concept of rotational mixing”. They claim that “two groups of core hydrogen burning stars …stand out as being in conflict with the evolutionary models”. Group I contains rapid rotators whith little chemical mixing, while Group II consists of low rotators with large N enrichments. We clearly disagree with the conclusions of Hunter et al. (2008), which mainly result from the fact that, instead of Eqn. (1), their analysis implicitly assumes that
| (2) |
We note the following points:
-
•
Their sample contains a mixture stars in the mass interval of 10 to 30 M⊙. Fig. 1 shows that over this mass interval, the N/H excesses vary as much as by a factor of two for a given rotation velocity.
-
•
The sample by Hunter et al. consists of stars in extended regions around the LMC clusters N11 and NGC 2004. As stated by the authors, their sample also contains field stars, which do not necessarily have the same age or degree of evolution as the cluster stars. Thus, large differences of N/H are possible for given and . Also, the two clusters do not have the same ages, N11 being younger than NGC 2004, so that the stars near the turnoff of N11 have a mass of about 20 M⊙, while this is about 14 M⊙ for NGC 2004 according to the HR diagrams by respectively Hunter et al. (2007) and Trundle et al. (2007).
-
•
The completeness of the binary search is unknown.
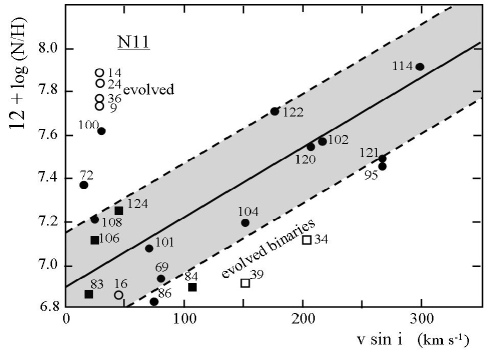
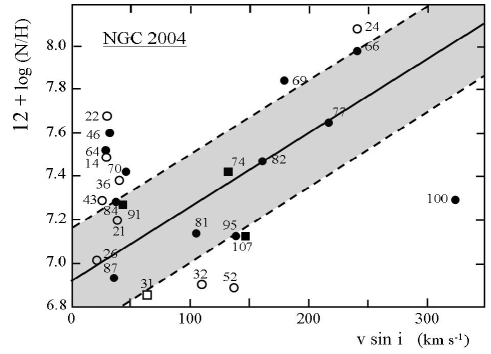
To limit the severe effects of mass and age differences, we consider separately the two clusters. In N11, we limit the sample to the stars in the mass range 14 to 20 M⊙ on the basis of the data provided by Hunter (2008) and in the formal MS band as given by Fig. 34 from Hunter et al. (2007). In NGC 2004, we take the mass interval 13 to 16 M⊙ (same source) and in the formal MS band from Fig. 2 by Trundle et al. (2007). Figs. 3 and 4 show the results. Ideally these mass intervals should even be smaller.
For N11, we see that Group I (stars with high and low N/H) has essentially disappeared. There remain only 2 evolved binary stars, which is consistent with some scenario of binary evolution. We suspect that Group I was also largely formed by stars of smaller ages and/or lower mass stars, where for a given the N excesses are smaller. A support to the latter possibility comes from the fact that the average mass of the stars in the region of Group I is 12.8 M⊙ (for km s-1 and ) and 17.1 M⊙ for stars with km s-1 and . Group II is mainly made from evolved stars (open circles), which explains the low velocities and high N abundances. The two remaining stars in this group can easily be stars with a small , especially more than the sample data by Hunter et al. (2008) is largely biased toward low rotators. The ratio of star numbers with km s-1 to those with km s-1is 0.14, while in the clusters studied by Huang & Gies (2006), this ratio amounts to 0.40! Thus, the sample by Hunter et al. contains a large excess of slow rotators. We conclude that the bulk of stars in N11 shows a relation of the excess of N/H depending on (the mean square root of the data for the MS band stars is 0.23 dex from the data by Hunter (2008), the scatter in is not given). The amplitude of the (N/H) is about 0.6 dex for velocities of 200 km s-1, slightly higher than at the corresponding mass in Fig. 1 for .
For NGC 2004, the results are essentially similar. For most stars there is a relation between the excess of N/H and . For Group I, there remains only star nb. 100 (which is not much for a group). This star is interesting. Its mass is 13 M⊙, is 323 km s-1, the highest of the whole sample. In reality, the velocity is still higher because the authors do not account for gravity darkening (Fig. 4 of Hunter al. (2008) tends to support this remark). This star might be a re–accelerated binary or simply a younger star in the field. Another possibility (which we favour) is that its parameters have been incorrectly appreciated due to the extreme rotation. In this respect, a vs. diagram, e.g. Fig. 16 by Meynet & Maeder (2000), shows that a too high mass is assigned to a fast rotating star if in the vs. diagram its mass is determined from non rotating models. Thus, the mass of star nb. 100 could be lower than 13 M⊙ which is the lower bound of our sample. To know whether this is what occurred for this star, the whole reduction process should be redone. For Group II, a large fraction consists as for N11 of evolved stars. Again for NGC 2004, the N enrichments increase with in agreement with theory.
We also note that the data used in the analysis by Hunter et al. (2008) are subject to several biases. Firstly, the sample contains no Be stars, while their number fraction is about 15 to 20 % in the LMC. This contributes to bias the sample toward low velocities. A second source of bias is that the determinations are based on models assuming that the stars are uniformly bright, with no account given to gravity darkening (now an observed effect). Thirdly, in the values of gravity used to estimate the masses, no account is given to the gravity change due to rotation. The effects of evolution and rotation should be disentangled before any mass is assigned.
Conclusions
We conclude quite logically that to find a correlation for a multivariate function like N/H with some parameter like , it is necessary to limit as much as possible the range of the other involved parameters. Otherwise, the conclusions may be erroneous. We note that data samples limited in mass and ages support a N enrichment depending on rotational velocities. Stars beyond the end of the MS phase do not obey to such a relation, because their velocities converge toward low values (see Fig. 12 by Meynet and Maeder 2000). A fraction, which we estimate to be % of the stars, may escape from the relation as a result of binary evolution, either by tidal mixing or mass transfer.
Acknowledgements.
We thank Dr. I. Hunter for having provided the observed data used in this study. ReferencesChiosi, C., Maeder, A., 1986, Ann. Rev. Astron. Astrophys. 24, 329 Heap, S.R., Lanz, T., Hubeny, I. 2006, ApJ 638, 409 Herrero, A. 2003, in CNO in the Universe, Eds. C. Charbonnel, D. Schaerer, G. Meynet, ASP Conf. Ser. 304, 10 Huang, W., Gies, D.R. 2006, ApJ 648, 580 & 591 Hunter, I. 2008, private communication Hunter,I., Dufton, P.L., Smartt, S. et al. 2007, A&A 466, 277 Hunter, I., Brott, I., Lennon, D.J. et al. 2008, ApJ, 676, L29 Lyubimkov L.S., Rostopochin, S.I., Lambert, D.L. 2004, MNRAS 351, 745 Maeder, A., Meynet, G. 2000, Ann. Rev. Astron. Astrophys., 38, 143 Maeder, A., Meynet, G. 2001, A&A, 373, 555 Meynet, G., Maeder, A. 2000, A&A, 361, 101 Meynet, G., Ekström, Maeder, A. 2006, A&A, 447, 623 Venn, K.A., Przybilla, N. 2003, in CNO in the Universe, eds. C. Charbonnel, D. Schaerer, G. Meynet, ASP Conf. Ser. 304, 20