Structural Basis for the Anomalously Low Spontaneous Polarisation Values of the Polar Phase of Sr1-xCaxTiO3 (x=, ): Evidence for a Ferrielectric Ordering
Abstract
Full pattern Le-Bail refinement using x-ray powder diffraction profiles of Sr1-xCaxTiO3 for x=0.02, 0.04 in the temperature range 12 to 300 K reveals anomalies in the unit cell parameters at 170, 225 K due to an antiferrodistortive (cubic to tetragonal I4/mcm) phase transition and at due to a transition to a polar phase (tetragonal I4/mcm to orthorhombic Ic2m), respectively. The lower transition temperatures obtained by us are in excellent agreement with those reported on the basis of the dielectric studies by Bednorz and Muller,jgb who attributed these to ferroelectric transition. Rietveld analysis of the diffraction profiles of the polar phase reveals off-centre displacements of both and Ti4+ ions in the X-Y plane along pseudocubic directions, in agreement with the experimentally reported direction of easy polarization by Bednorz and Muller, but the resulting dipole moments are shown to be ferrielectrically coupled in the neighbouring planes along the direction leading to anomalously low values of the spontaneous polarization at 12 K.
pacs:
77.84.Dy; 77.80.-e;SrTiO3 has been the paradigm of structural phase transition studies.lg It is also one of the most common ingredients of BaTiO3-based ceramic capacitors.rc The room temperature cubic perovskite structure of SrTiO3 (space group ) transforms to a tetragonal phase in the I4/mcm space group below 105 K due to the freezing of one of the triply degenerate R25 modes in which the adjacent octahedra rotate about one of the cubic directions in an anti-phase manner.gs Although the tetragonal phase is reported to be stable down to the lowest temperature,kia its dielectric constant gradually increases on cooling and becomes nearly two orders of magnitude greater at below which it levels off. While the increasing value of the dielectric constant at low temperatures is linked to a zone centre soft mode,lg its saturation below 4 K has been attributed to quantum fluctuations (i.e., zero point vibrations) of the lattice which stabilize the paraelectric state.mull substitution not only increases the antiferrodistortive phase transition temperatureub ; skm but also suppresses the quantum fluctuations, as revealed by the appearance of a peak in the temperature variation of the dielectric constant. In fact, the quantum fluctuations can be suppressed by several ways, such as by the application of external stress,hu electric fieldpaf and suitable chemical substitutions like Ca2+, Ba2+, Pb2+ at the Sr2+ site and oxygen isotope (O18) at the O2- sites.jgb ; meg It has been shown by Bednorz and Mullerjgb that above a critical Ca2+ concentration of xc= 0.0018, XY type ’ferroelectricity’ is stabilized in SrTiO3.The ferroelectric transition temperature rises with Ca2+ concentration (x) upto according to the relationship as expected for quantum transitions.jgb In the composition range , the transition temperature is nearly composition independent and the variation of dielectric constant with temperature is increasingly more smeared out as the Ca2+ content increases. This smearing out of the transition has been attributed by Bednorz and Mullerjgb to the formation of mesoscopic ’ferroelectric’ domains caused by the random fields induced by some of the Ca2+ occupying Ti4+ sites, thereby forming is oxygen vacancy) dipoles. Ranjan et alrr have argued that this smearing could as well be the result of a frustration caused by the competing ferroelectric and antiferroelectric instabilities for these compositions, since the nature of the phase transition in (SCT) changes from ’ferroelectric‘ for low doping levels to antiferroelectric for high concentrations with . Raman scattering studiesro reveal the presence of both the antiferroelectric and ferroelectric modes for x=0.12 in support of the frustration model.
For concentrations , the dielectric constant of SCT in the ’ferroelectric’ state decreases with increasing x but its value remains an order of magnitude larger than that of the conventional ferroelectrics like .jgb On the otherhand, the measured saturation polarization values are anomalously lowubz ; tm in the ’ferroelectric’ phase as compared to that in BaTiO3, which is . There is no satisfactory explanation for such a low value of saturation polarization in a ’ferroelectric’ phase with extremely high dielectric constant. The present work seeks to provide a structural basis for this low value of spontaneous polarization.
No attempt has so far been made to examine the structure of the ’ferroelectric’ phase of SCT for using diffraction techniques. In the present work, we have investigated the phase transitions in SCT for x=0.02 and 0.04 (SCT02 and SCT04) in the temperature range 12 to 300 K by Le-Bail and Rietveld techniques of x-ray powder diffraction, with a view to capture the structural signatures of the antiferrodistortive and ’ferroelectric’ transitions. Our results suggest that the anomalously low spontaneous polarization value of SCT is linked with the ’ferrielectric’ nature of the hitherto regarded ’XY-ferroelectric’ phase of SCT. The calculated spontaneous polarization values, obtained using the Rietveld refined atomic positions and Born-effective charges, as given in Ref.phg , are found to be in excellent agreement with the values reported by Bianchi et alubz and Mitsui and Westphal.tm
SCT02 and SCT04 powders were prepared by solid-state thermochemical reaction in the appropriate stoichiometric mixtures of and at 1423 K for 6 h in alumina crucibles. The calcined powders were sintered at 1573 K for 6 h. The sintered pellets were crushed to fine powder and subsequently annealed at 823 K for 12 h for removing the strain induced, if any, during the crushing process before using them for diffraction studies. Temperature dependent powder x-ray diffraction studies in the 12 to 300 K range were carried out using a 18 kW Rigaku (RINT 2000/ PC series) rotating anode based high resolution x-ray powder diffractometer operating in the Bragg-Brentano focusing geometry. The diffractometer is fitted with a He- closed cycle refrigerator based low temperature attachment and also a curved crystal monochromator in the diffraction beam. Data were collected in the continuous scan mode at a scan speed of 1 degree per minute and step interval of 0.01 degree. The package ’Fullprof’jr was used for Le-Bail and Rietveld analysis of the x-ray diffraction data.
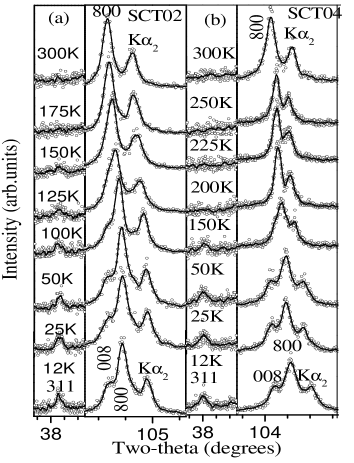
For pure SrTiO3, the cubic to tetragonal antiferrodistortive phase transition is accompanied with the doubling of the elementary perovskite cell leading to characteristic splitting of main perovskite peaks along with the appearance of superlattice reflections.kia The relationship between the tetragonal cell parameters with the elementary perovskite cell parameters is as follows: . The Miller indices of the main perovskite and superlattice reflections of the tetragonal phase with tilt system are all even (eee) and all odd (ooo) integers, respectively, when indexed with respect to a pseudocubic unit cell (see Glazerglazer for details). Figs. 1 (a) and (b) depict the evolution of the 311 superlattice and 800 perovskite reflections as a function of temperature for SCT02 and SCT04, respectively. It is evident from these figures that the 800 profile is a doublet at low temperatures. It is also evident from this figure that the intensity of the superlattice reflection, as also the splitting of the 008 peak, disappears at high temperatures, as expected for the high temperature phase.
In order to determine the phase transition temperatures, we analysed the powder diffraction data in the range of 20 to at various temperatures by Le-Bail technique17using the I4/mcm space group. The variations of the equivalent elementary perovskite cell parameters with temperature, as obtained from the refined cell parameters of the tetragonal phase, are plotted in Fig. 2. It is evident from this figure that the cubic to tetragonal transition occurs around and 225 K for x=0.02 and 0.04, respectively. Combining these two transition temperatures with the previously reported values for and one gets a as for and for showing a kink corresponding to a change of slope at in the versus ’x’ plot, as noted by Mishra et al earlierskm but missed in a recent report.carp
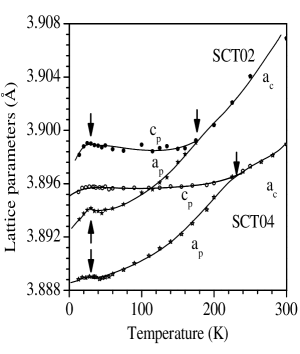
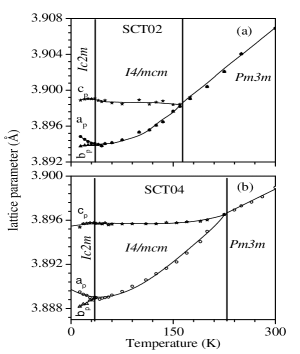
Although the XRD profiles shown in Fig. 1 do not depict any qualitative change in the ’ferroelectric phase’ (i.e., below 35 K), the refined tetragonal cell parameters show anomalies around 30 K in Fig.2. Since the transition temperatures reported in the literature for SCT02 and SCT04 are around ,jgb the anomalies in the cell parameters at are evidently linked with the phase transition from the tetragonal paraelectric phase to the lower temperature ’ferroelectric’ phase. The centrosymmetric I4/mcm space group of the paraelectric tetragonal phase cannot represent the structure of the ferroelectric phase. The onset of ferroelectric polarization transforms under as the components of the irreducible representation (IR). Anti-phase tilting of oxygen octahedra transforms under as the components of the IR.ht Using the software package ”ISOTROPY 2000”ht to couple and and IRs, we obtained many space groups. Since the paraelectric phase of SCT is tetragonal (I4/mcm), we impose the constraint that the ’ferroelectric space’ group is a subgroup of I4/mcm. This constraint reduced the number of possible space groups for the ferroelectric phase to two, namely: I4cm and Ic2m (bca setting of Ima2). The Raman scattering studies on SCT with ub have shown that the mode is split into two lines in the ’ferroelectric phase’ and hence the tetragonal I4cm space group, for which mode should have remained a singlet, cannot represent the ferroelectric phase. Thus, the orthorhombic space group Ic2m is the mostly likely space group of the ferroelectric (polar) phase of SCT for which mode will indeed be a doublet. The equivalent elementary perovskite cell parameters obtained at various temperatures by Le-Bail analysis of the full diffraction profiles in the range 20 to 120 degrees using the Ic2m space group are depicted in Figs. 3(a) and (b) for SCT02 and SCT04, respectively. The cell parameters of the orthorhombic Ic2m phase are related to the elementary perovskite cell parameters as: and . It is evident from this figure that the lattice parameter of the tetragonal paraelectric phase splits below into and of the orthorhombic phase, in good agreement with the transition temperature at which the dielectric peak is observed.jgb
Having identified the most plausible space group for the polar phase, we carried out Rietveld analysis of the 12 K XRD data in the range 20 to 110 degree for SCT02 and SCT04 using the Ic2m (bca setting of Ima2) space group. In this space group, Sr/ Ca occupy the 4b Wyckoff site at and the Ti occupies 4a Wyckoff site at . There are two types of oxygen atoms, O( 1) at 4b Wyckoff site at and O(2) at 8c site at . Pseudo-Voigt function was used to define the profile shapes while background was estimated by linear interpolation between fixed values. Except for the occupancy parameters of atoms, which were fixed at their nominal compositions, all other parameters were refined.Table 1 depicts the refined structural parameters for the ferroelectric phase of SCT02 and SCT04, respectively.
| Atoms | ||||||||
| x | y | z | B | x | y | z | B | |
| Sr/Ca | 0.0018(9) | 0.0091(7) | 0.25 | 0.67(7) | 0.0028(2) | 0.0083(5) | 0.25 | 0.89(5) |
| Ti | 0.00 | 0.4894(7) | 0.50 | 0.008(5) | 0.00 | 0.4891(9) | 0.50 | 0.011(7) |
| O1 | -0.023(3) | 0.552(7) | 0.25 | 0.052(1) | -0.021(6) | 0.5598(2) | 0.25 | 0.24(7) |
| O2 | 0.267(3) | 0.7148(7) | 0.001(2) | 0.67(7) | 0.2588(2) | 7101(7) | 0.003(4) | 0.70(7) |
| Lattice Parameters () | ||||||||
| A=5.5073(3) | B=5.5066(2) | C=7.7977(1) | A=5.4979(3) | B=5.4997(2) | C=7.7908(1) | |||
| Rp=11.90 | Rwp=18.73 | Re=12.97 | Rp=8.87 | Rwp=13.0 | Re=9.36 | |||
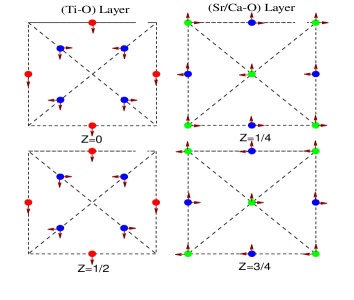
Fig. 4 depicts schematically the ionic displacements in the orthorhombic ferroelectric phase of SCT02/04 with respect to the ideal positions in the paraelectric phase. The crystal structure of ferroelectric phase consists of the stacking of TiO, Sr/CaO,TiO and Sr/CaO layers at , , and of the unit cell of ferroelectric phase, as shown in Fig. 4. All the ions in these layers are displaced with respect to their ideal positions in cubic perovskite structure. In the layers at z= and , the Sr2+/Ca2+ and O2- ions have component displacements both along and directions of the orthorhombic cell. However, the component displacements along in the z= and z= planes cancel out leaving net effective displacement only along the direction of the orthorhombic phase. Similarly, for the layers at and , the net displacements of Ti4+ and O2- ions are along the direction of orthorhombic ferroelectric phase. Thus the direction of polarization in the TiO as well as Sr/CaO layers is along direction of the orthorhombic phase. This is in agreement with the observation of Bednorz and Mullerjgb that the pseudo-cubic direction, which becomes in the orthorhombic cell, is the easy direction of polarization. However, results of our refinements reveal ferrielectric coupling of the dipole moments residing in the neighbouring layers, in contrast to the suggestions of Bednorz and Mullerjgb for ferroelectric order, since the dipole moments are along the and directions in the alternate layers stacked in the [001] direction. Using the Born effective charges given in Ref phg for alongwith the refined positional coordinates given in Table 1, we obtain a spontaneous polarization of and for x= 0.02 and 0.04, respectively. These values are in excellent agreement with the values reported by Bianchi et alubz and Mitsui and Westphaltm on the basis of hysteresis loop measurements. Thus the extremely low value of spontaneous polarization, in spite of the very high dielectric constant, of SCT02 and SCT04 is due to the partial cancellation of the dipole moments as a result of the ferroelectric coupling of the dipoles in the [001] direction of the orthorhombic phase.
To summaries, we have shown that the orthorhombic distortion of the lattice of Sr1-xCaxTiO3 (x=0.02, 0.04) below 35 K is clearly revealed through the Le-Bail analysis of the powder x-ray diffraction profiles. Using symmetry arguments in conjunction with Raman scattering results from literature, we have proposed the Ic2m space group for the low temperature polar phase. This phase is not ferroelectric in nature, as hitherto believed, but ferrielectric. The dipole moments in the neighbouring (001) planes are coupled ferrielectrically in the [001] direction The value of spontaneous polarization calculated using the Born-effective charges and the refined positional coordinates obtained by Rietveld technique are in excellent agreement with experimental values reported in the literature.
References
- (1) M. E. Lines and A. M. Glass, Principles and Applications of Ferroelectrics and Related Materials( Clarendon , Oxford, 1977), A. D. Bruce and R. A. Cowley, Advances in Physics, 29, 219 (1980).
- (2) R.C. Buchman ”Ceramic Materials for Electronics: Processing Properties and Application” (Marcel Dekker, New York, 1991).
- (3) G.Shirane and Y. Yamada, Phys. Rev. 177, 858 (1979).
- (4) J. M. Kiat, and T Roisnel J. Phys. Condens. Matter, 8, 3471 (1996).
- (5) K A Muller, and H. Burkard, Phys. Rev. B, 19, 3593 (1979).
- (6) U. Bianchi et al., J. Phys. Condens.Matter, 6, 1229 (1994).
- (7) M. E., Guzhva et al., Phys. Solid State, 39, 625 (1997); M.C. Gallardo et al., J. Phys.: Condens. Matter, 15, 91 (2003). S.K. Mishra et al., J.Solid State Chem. 178, 2846 (2005).
- (8) H. Uwe and T. Sakudo, Phys. Soc. Jpn. 23, 546 (1967).
- (9) P.A. Fleury, and J. M. Worlock Phys. Rev. B, 174, 613 (1968).
- (10) J. G. Bednorz, and K. A. Muller, Phys. Rev. Lett. 52, 2289 (1984).
- (11) M. E., Guzhva et al., Phys. Solid State, 39, 618 (1997a); V. V. Lemanov et al., Phys. Solid State, 39, 628 (1997); M. Itoh et al.,Phys. Rev. Lett., 82, 3540 (1999).
- (12) R. Ranjan et al., Phys. Rev. Lett.,84, 3726 (2000); R. Ranjan, and D. Pandey J.Phys.: Condens. Matter bf 13, 4251 (2001).
- (13) R. Ouillon et al.,J. Phys. Condens. Matter, 14, 2079 (2002).
- (14) U. Bianchi et al., Phys. Rev.B, 51, 8737 (1995).
- (15) T. Mitsui and W. B. Westphal, Phys. Rev., 124, 1354 (1961).
- (16) Ph. Ghosez et al., Phys. Rev. B 58, 6224(1998).
- (17) J. Rodriguez-Carvajal, FULLPROF, Laboratory Leon Brillouin (CEA-CNRS) CEA/Saclay, 91191 Gif sur Yvette Cedex, France, (2006).
- (18) A. M. Glazer Acta. Cryst., B28, 3384 (1972);ibid Acta Cryst.,A31, 756 (1975).
- (19) K. A. Muller et al., Phys. Rev. Lett., 21, 814 (1968).
- (20) M. A. Carpenter et al., J.Phys. Condens. Matter, 18, 10725 (2006).
- (21) D.M., Hatch, and , H.T.,Stokes Phys. Rev. B 35, 8509(1987); H.T. Stokes, and D. M. Hatch, ISOTROPY software and documentation is available over the internet at www.physics.byu.edu/ stokes/isotropy.html.