Formation and Evolution of Planetary Systems (FEPS): Properties of Debris Dust around Solar-type Stars
Abstract
We present Spitzer photometric (IRAC and MIPS) and spectroscopic (IRS low resolution) observations for 314 stars in the Formation and Evolution of Planetary Systems (FEPS) Legacy program. These data are used to investigate the properties and evolution of circumstellar dust around solar-type stars spanning ages from approximately 3 Myr to 3 Gyr. We identify 46 sources that exhibit excess infrared emission above the stellar photosphere at 24µm, and 21 sources with excesses at 70µm. Five sources with an infrared excess have characteristics of optically thick primordial disks, while the remaining sources have properties akin to debris systems. The fraction of systems exhibiting a 24µm excess greater than 10.2% above the photosphere is 15% for ages 300 Myr and declines to 2.7% for older ages. The upper envelope to the 70µm fractional luminosity appears to decline over a similar age range. The characteristic temperature of the debris inferred from the IRS spectra range between 60 and 180 K, with evidence for the presence of cooler dust to account for the strength of the 70µm excess emission. No strong correlation is found between dust temperature and stellar age. Comparison of the observational data with disk models containing a power-law distribution of silicate grains suggest that the typical inner disk radius is 10 AU. Although the interpretation is not unique, the lack of excess emission shortwards of 16µm and the relatively flat distribution of the 24µm excess for ages 300 Myr is consistent with steady-state collisional models.
1 Introduction
The IRAS mission left a lasting legacy with the surprise discovery of dust surrounding Vega and other main-sequence stars (Aumann et al., 1984; Aumann, 1985). The orbital lifetime of the dust, limited by collisional and radiative processes in a gas poor environment, is orders of magnitude shorter than the stellar age, and implies that the dust must have been created recently (Backman & Paresce, 1993). The model currently favored to explain the presence of dust in these systems postulates that planets gravitationally stir a population of planetesimals, which subsequently collide and fragment into a cascade of smaller debris (Williams & Wetherill, 1994). In support of this conjecture, high-angular resolution images have indeed shown that the dust is frequently distributed in disk- or ring-like geometries (Smith & Terrile, 1984; Koerner et al., 1998; Holland et al., 1998; Kalas, Liu, & Matthews, 2004; Schneider et al., 2006).
The presumed causal relationship between debris dust and planetary systems has motivated many studies to investigate the frequency and properties of debris disks (Aumann & Probst, 1991; Mannings & Barlow, 1998; Moór et al., 2006; Rhee et al., 2007, see also Lagrange, Backman, & Artymowicz, 2000 and references therein). Analysis of IRAS data indicates that 15% of nearby AFGK type stars are surrounded by a debris disk with a dust-to-photosphere luminosity ratio exceeding that of the Vega debris disk (Backman & Gillett, 1987; Plets & Vynckier, 1999). Subsequent observations with ISO demonstrated that the frequency of debris disks declines with age (Habing et al., 1999, 2001; Spangler et al., 2001). Decin et al. (2003) emphasized, however, that a large range of dust properties are present at any given stellar age, which suggests that planetesimals with a wide range of properties exist around main-sequence stars.
As an extension of the IRAS and ISO heritage, the high photometric precision and extraordinary sensitivity of the Spitzer Space Telescope (Werner et al., 2004) have enabled a comprehensive characterization on how the debris disk phenomenon correlates with stellar mass and age. Beichman et al. (2005b) obtained the first secure demonstration of debris dust around extrasolar planetary systems (see also Moro-Martín et al., 2007a) to support the basic tenet that debris and planets are connected. Beichman et al. (2006b) showed that fractional luminosity from dust in the 1 AU region around solar-type stars is rare at levels more than 1400 times the brightness of the current zodiacal cloud, although spectacular examples of warm ( 300 K) dust have been discovered (Song et al., 2005; Beichman et al., 2005a; Rhee et al., 2008). Rieke et al. (2005) found that 47% of A-type stars younger than 90 Myr have a 24µm excess more than 25% above the photosphere, with a rapid decline in both the frequency and magnitude of the excess toward older ages. Lower mass FGK type stars exhibit a similar decline in the warm excess fraction with age (Siegler et al., 2007), although the persistence time may be longer for 70µm excess emission (Su et al., 2006; Bryden et al., 2006). For stars older than 600 Myr, the presence of 70µm excess shows no clear dependence on spectral type for AFGK stars (Trilling et al., 2008). Few debris disks have been detected around M dwarfs with Spitzer (Beichman et al., 2006a; Gautier et al., 2007); it remains uncertain however whether this indicates a real difference in disk frequency compared to higher mass stars, or simply reflects the greater difficulty in detecting dust around low luminosity stars (see, e.g., Cieza, Cochran, & Augereau, 2008).
The improved observational data have coincided with increasingly sophisticated models to understand the connection between debris dust and the presence of planets. Liou & Zook (1999) demonstrated how debris dust can be trapped in resonances with orbiting planets to produce the asymmetric and clumpy structure observed in some debris disks (see also Wyatt, 2003; Moro-Martín & Malhotra, 2003, 2005; Krivov et al., 2007). In a series of papers, Kenyon & Bromley (2001, 2002, 2004, 2005) investigated the link between the collisional growth of planets (see Safronov, 1969; Greenberg et al., 1984; Wetherill & Stewart, 1989; Spaute et al., 1991) and the subsequent production of debris in the collisional cascade. They demonstrated that as planet formation proceeds from the inner disk outwards and gravitationally stirs the planetesimals, debris dust will be produced at sufficient levels to be detected with current instrumentation. Dominik & Decin (2003) suggest that the rapid decline in the observed debris emission at an age of a few hundred million years is a consequence of the collisional depletion of the planetesimal belts. Wyatt et al. (2007a) extended their model and confirmed the basic findings, and also identified several luminous debris systems which are best explained by a recent collision between planetesimals that produced copious amounts of dust.
To date, the observational data and the application of models is most complete for A-stars which are sufficiently bright to be detected to large distances by IRAS and ISO. With the sensitivity of Spitzer, extensive data sets can now be collected for solar-type stars that may provide insights on the evolutionary history of our own Solar System. Toward this goal, the Formation and Evolution of Planetary Systems (FEPS) Spitzer Legacy Program (Meyer et al., 2006) has conducted a photometric and spectroscopic survey of 328 solar-type stars spanning ages between 3 Myr and 3 Gyr. Previous FEPS studies have analyzed subsets of the FEPS data to address specific issues regarding debris evolution, including (1) the evolution of terrestrial temperature debris around stars younger than 30 Myr (Silverstone et al., 2006), (2) the temporal evolution of warm 24µm excess (Stauffer et al., 2005; Meyer et al., 2008), (3) the identification and properties of cool Kuiper-Belt analogs (Meyer et al., 2004; Kim et al., 2005; Hillenbrand et al., 2008), (4) analysis of debris disk properties around known extra-solar planetary systems (Moro-Martín et al., 2007a, b), (5) dust composition for a sample of optically thick accretion disks (Bouwman et al., 2008), and (6) the gas dissipation timescales in debris disks (Hollenbach et al., 2005; Pascucci et al., 2006, 2007). In this contribution, we present the most comprehensive analysis to date of photometry and low resolution spectra in the FEPS survey to investigate the evolution of debris disks around solar-type stars. The broad goal of our investigation is to quantify the incidence of the debris phenomenon around solar-analogs, infer the properties of the implied planetesimal belts around these systems, and understand the similarities and differences of these presumed planetary systems with the Solar System.
Carpenter et al. (2008, hereafter Paper I) describe the observation and data reduction procedures adopted for this study. A summary of the FEPS sample and important aspects of the FEPS data reduction are summarized in §2. In §3, we analyze each of the Spitzer data products to identify stars that have an infrared excess between 3.6 and 70µm. We use these results to trace the temporal evolution of debris properties (§4), and to constrain the location of the planetesimal belts (§5). We then compare these properties to the Solar System debris disk (§6) before summarizing our results (§7).
2 Stellar Sample and Observations
This paper analyzes data for 314 stars that were selected for the FEPS program without regard to the presence or absence of a known infrared excess from pre-Spitzer observations. We exclude 14 other FEPS stars with suspected excesses from IRAS or ISO that were observed explicitly for a gas-detection experiment (Hollenbach et al., 2005; Pascucci et al., 2006, 2007). Meyer et al. (2006) describe the sample properties in detail and only a summary is presented here. The stars span spectral types between K7 and F5 and ages between approximately 3 Myr and 3 Gyr. The stellar masses range from 0.7 to 2.2 M⊙, with 90% of the stars having masses less than 1.4 M⊙. Stellar ages were estimated by a variety of methods. In brief, for the youngest clusters/associations, the ages were based on fits to pre-main sequence isochrones; for older clusters, the ages are primarily based on isochronal fits to the upper main sequence turnoff and/or the “lithium-depletion boundary” method (Rebolo, Martín, & Magazzú, 1992). Field stars were assigned ages based on stellar activity indicators (e.g. X-ray, rotation, CaII H&K), whose decline in strength with age has been calibrated with respect to open clusters of known age (Mamajek & Hillenbrand, 2008).
The sample breakdown between field stars and associations is provided in Table 1 and by stellar age in Table 2. Stellar ages are distributed approximately in uniform logarithmic intervals with between 34 and 60 stars for every factor of three in age. For ages less than 30 Myr, the sample is weighted toward stars found in associations, and stars older than 1 Gyr consist entirely of field stars because of the lack of nearby, old clusters. Younger stars tend to have later spectral types since solar-mass stars increase in temperature as they evolve from the pre-main-sequence phase to the main-sequence.
FEPS obtained IRAC 3.6, 4.5, and 8µm images111The FEPS IRAC observations were obtained in sub-array mode, where a subsection of the full-array is read out to enable observations of bright stars. Sub-array observations obtains images in the four IRAC band separately. IRAC 5.8µm observations were not obtained for the majority of the FEPS targets (see Paper I)., MIPS 24 and 70µm images, and IRS low resolution spectra between 8 and 35µm (SL1, LL1, and LL2 orders) for most of the sample, with observations for a few stars supplemented from the Spitzer archive. Five (HD 80606, HD 139813, HII 2881, HIP 42491, and RX J1544.0-3311) of the 314 sources do not have an IRS spectrum since the peak-up observations selected the incorrect star. In a few sources, portions of the IRS spectra appear corrupted and were discarded. The flux densities in the LL spectra for ScoPMS 52 are 60% higher than the MIPS 24µm flux density, and the IRS spectrum is likely contaminated by a source 18″ away that has an order of magnitude higher flux density. The flux density in the SL1 spectrum for HD 13974 is 2.6 lower than expected, and the extracted LL1 and LL2 spectra for R45 have negative flux densities. Also, the IRS spectra for two sources (HII 1015 and HE 699) were discarded because of poor signal-to-noise. Finally, since Paper I was published, we have reanalyzed the spectrum for the star 1RXS J051111.1+281353 using the S15 data products from the Spitzer Science Center.
The signal to noise ratio on the stellar photosphere is 30 for both the IRAC and MIPS 24µm photometry. At 70µm, the photosphere was detected above the 3 noise level for only one source. The signal-to-noise ratio of the spectra was assessed by computing synthetic broad-band fluxes at 16µm using a square-wave response function between 15 and 17µm, at 24µm using the MIPS 24µm instrumental response function222http://ssc.spitzer.caltech.edu/mips/spectral_response.html, and at 32µm using a square-wave response function between 30 and 34µm. In the 16µm bandpass, the signal-to-noise ratio of the IRS spectra is 20 for 305 sources. At 24µm, the signal-to-noise ratio is for 302 stars and in 305 sources. At 32µm, the signal-to-noise ratio is for 264 sources and for 292 stars. A complete description of the data reduction procedures is presented in Paper I.
3 Identifying Sources with Infrared Excesses
In this section, we analyze the photometric and spectroscopic data to identify sources that exhibit infrared emission diagnostic of circumstellar dust. Each Spitzer instrument is sensitive to dust emitting over a range of dust temperatures, and a given source will not necessarily exhibit detectable infrared excesses in all instruments. In general terms, IRAC photometry is most sensitive to hot dust located in the terrestrial planet zone (as defined by our Solar System), MIPS 24µm to warm dust in the gas-giant formation region, and MIPS 70µm to cold Kuiper Belt analogs. IRS spectra probe regions similar to that by IRAC and MIPS 24µm. We first analyze the data for each instrument individually, and then synthesize the results in §3.6 to identify a reliable sample of excess sources. In subsequent sections, we analyze these data to infer disk properties.
3.1 IRAC
In the top panel of Figure 1, we present the 8µm to 3.6µm flux ratio ( ) as a function of color for the FEPS sample after dereddening the photometry using the extinction corrections derived in Paper I and the reddening law compiled by Mathis (1990). The median visual extinction for the sample is 0 mag with a maximum of 1.8 mag. Sources with large values of contain a possible infrared excess at 8µm. Since the youngest stars in our sample are 3 Myr old, and the inner disk, as traced by photometric observations at µm, dissipates in half of solar-type stars by an age of 3 Myr (Haisch, Lada, & Lada, 2001), we anticipate that the color traces the stellar photosphere for most stars in our sample. This expectation is confirmed from inspection of a vs. diagram which shows that only two stars (RX J1111.77620 and RX J1842.93532) exhibit a -band excess detectable by this technique (see, e.g., Meyer, Calvet, & Hillenbrand, 1997, for a discussion of the merits and limitations of this diagram). In Figure 1, most sources lie along a tight locus of points, while five sources (RX J1111.77620, RX J1842.93532, RX J1852.33700, PDS 66, PZ99 J161411.0230536) have values of well above the locus and have a clear 8µm excess. Four of these sources have ages Myr, and the fifth (PDS 66) is a member of the Lower Centaurus Crux association with an age of 12 Myr (Preibisch & Mamajek, 2008). Silverstone et al. (2006) showed that these five sources have infrared excesses over a broad range of wavelengths and other properties characteristic of optically thick, primordial, circumstellar accretion disks.
In the bottom panel of Figure 1 we present the same diagram after removing the five sources with strong 8µm excesses to emphasize the colors for the majority of stars. The dashed line indicates the best-fit linear relation to the trend between color and log . We assume that the trend represents intrinsic variation in the photospheric value of over the spectral type range in the FEPS sample. The dispersion about the best fit line is ) = 0.0043, or )/= 1.0%, while the expected dispersion from the observational uncertainties is 0.0044. The maximum outlier with a positive apparent excess is 3.3 (HD 77407), and we expect 1 outlier more than 3 from the mean based on the sample size. The IRS spectrum for HD 77407 shows no evidence for an 8µm excess (§3.2), and this source was one of two objects where the IRAC photometry was contaminated by a latent image (see Paper I). We conclude that outside of the five sources with strong 8µm excesses characteristic of optically thick disks, no individual source shows conclusive evidence of a weak ( limit of 3% above the photosphere) 8µm excess indicative of optically thin dust.
3.2 IRS low resolution spectra
To quantify the presence of an infrared excess in the IRS spectra, we determined if the observed spectra are better fitted by a model photosphere alone, or by the sum of a model photosphere and a modified blackbody that represents circumstellar dust emission. The photospheric component was derived by fitting Kurucz synthetic spectra to optical and near-infrared photometry between 0.5 and 2.2µm. The stellar effective temperature and visual extinction were free parameters in the fits, while the surface gravity and metallicity were fixed (see Paper I for details of the fitting procedure).
These model spectra cannot be compared directly with the IRS spectra to infer the presence of an infrared excess for two reasons. First, the mean flux density of the model often differs from the observed spectra, which may reflect either uncertainties in the model fit or calibration uncertainties in the observed spectrum. Second, in some spectra an offset is present between the SL1 and LL2 IRS orders that is manifested as an abrupt jump in the flux density at a wavelength of 14.2µm. To correct for these offsets, the best fit Kurucz model to the broad-band photometry was renormalized to the IRS spectrum. The renormalization included a term to account for an overall flux density offset between the model and the observed spectrum, and a second term to account for the offset between the SL1 and LL2 orders.
The variance between the Kurucz model fit (including the flux offset terms) and the observed IRS spectra was computed between 12 and 35µm. The same IRS spectrum was then fitted with a Kurucz model plus modified blackbody [i.e. ] that represents thermal emission from dust grains. The free parameters for the modified blackbody are the dust temperature () and the solid angle of dust grains, which is proportional to the total cross-sectional surface area if the grains are at a single temperature. The appropriate value of depends on the grain properties that contribute emission in the IRS wavelengths. In practice, the IRS spectra probe the Wien tail of the dust emission (see discussion below) and do not place meaningful constraints on . Therefore, we assume to conform with the typical value inferred from submillimeter observations of debris disks (Williams & Andrews, 2006). Adopting a blackbody function () produces warmer dust temperatures but does not otherwise alter the results of our analysis. The variance from the Kurucz spectrum fit alone and that from the Kurucz spectra plus modified blackbody were compared by computing the -test statistic (; Press et al., 2002). If , we conclude that the Kurucz spectrum alone is a poor fit to the IRS data.
Protassov et al. (2002) emphasized that the probability distribution from the -test is not formally valid for this application since the second model adds a modified blackbody component that is not present in the first model. We conducted Monte Carlo simulations to establish the correct probability distribution where we took the best fit Kurucz model spectrum, introduced a random offset to the SL1 order, and added wavelength-dependent random noise to the spectrum. We then repeated the -test analysis for this synthetic spectrum. The empirical probability distribution was derived from 8,000 simulated spectra. Simulations were run using the noise characteristics of a relatively faint star (MML 32, signal-to-noise ratio of 4 in the 32µm bandpass), and a bright star (vB 1, signal-to-noise of 13). Whereas we expected 80 of the 8,000 simulated spectra to have a probability from random noise, the -test yielded 76 for the MML 32 simulation and 86 for vB 1. Similarly, we expect 8 source to have a probability , and the simulation yielded 7 and 10 for MML 32 and vB 1 respectively. We conclude that the -test, while not formally valid for this application, nonetheless provides a reasonably accurate probability distribution.
In Figure 2, we present IRS low resolution spectra for four sources to illustrate the fitting results. For the star HIP 76477, we derived and conclude that the IRS spectrum is consistent with photospheric emission. The spectrum indeed shows that the spectrum is roughly constant versus wavelength, which is expected for these sources in the absence of dust since the emission is approximately in the Rayleigh-Jeans limit at these wavelengths. The other three sources in Figure 2 have , which indicates that the spectra are poorly represented by Kurucz models. For these sources the observed emission systematically exceeds a constant spectrum at the longer IRS wavelengths and is consistent with the presence of emission from dust grains.
In principle we can select a reliable list of sources with probable IRS excesses based solely on the -test statistic. In practice, several sources have a low spectral intensity at long wavelengths ( 30µm) relative to the Kurucz model and are parameterized by a negative solid angle in the modified blackbody fits. These spectra clearly do not result from dust emission, and likely indicate errors in the spectral extraction or low signal-to-noise in the IRS spectra at the longer wavelengths. We imposed the following criteria then to select sources with candidate IRS excesses: (i) the signal-to-noise ratio in a synthetic bandpass between 30 and 34µm is ; (ii) the probability from the -test is , and (iii) the solid angle of dust emission is . In total, 71 sources satisfied these criteria. However, whereas we expected one source detected at 32µm to have such negative solid angles for , the analysis yielded seven such sources. In §3.6, we combine the IRS and MIPS data to select a reliable sample of infrared excess sources that exhibit infrared excesses in both instruments.
From visual inspection of the IRS spectra, the star 1RXS J051111.1281353 had a spectral shape that was not amenable to the above analysis. In Figure 3, we present the spectral energy distribution between 5 and 35µm for this star, including the IRS spectrum (solid curve), IRAC and MIPS photometry (filled circles), and a Kurucz synthetic spectrum (dashed curve) normalized to optical and near-infrared photometry (see Paper I). The IRS spectrum shows an apparent excess above the stellar photosphere between 9 and 28µm, with perhaps a 10µm silicate emission feature. The shape of the excess emission is distinct from the other FEPS sources where the excess emission increases toward longer wavelengths, and suggests that the excess emission in 1RXS J051111.1281353 originates primarily from warm dust grains. The star HD 72905 shows similar characteristics (Beichman et al., 2006b). The excess was not revealed by fitting a modified blackbody to the IRS spectrum since this analysis allowed for an normalization constant, which removed the low-level infrared excess. A more detailed analysis of the spectrum is forthcoming. In the following analysis, we include 1RXS J051111.1281353 as an IRS-verified excess to provide a total of 72 stars with candidate IRS excesses.
3.3 IRS 16µm
While analysis of the IRS spectra identified sources with infrared excesses between 12 and 35µm, in later sections it will be useful to quantify the infrared excess at an intermediate wavelength between the IRAC 8µm and MIPS 24µm bandpasses. For this exercise we used the 16µm fluxes computed from the IRS spectra (see §2). Since the 8µm flux density is mostly photospheric in origin (§3.1), we use the 16 to 8µm flux density ratio ( ) to identify any stars with 16µm excesses. After excluding the 5 known optically thick disks with IRAC excesses, the median value of for the FEPS observations is 0.244 with a dispersion about the median of ) = 5.4%, which we adopt as the photospheric value and minimum uncertainty in , respectively. Of the 314 sources in the sample, only the 5 stars that are surrounded by optically thick disks have a 16µm excess more than 3() = 16.2% above the photosphere. The star 1RXS J051111.1281353 also has a 16µm excess (see Fig. 3), but at a lower level.
3.4 MIPS 24µm
The methods adopted in the literature to identify 24µm excesses include measuring how much the observed 24µm flux density exceeds a model stellar spectrum normalized at optical and near-infrared wavelengths (e.g. Bryden et al., 2006), and identifying sources with anomalously red colors (e.g. Siegler et al., 2007). After considering these approaches, we used the 24 to 8µm flux density ratio ( ) which empirically resulted in the most sensitive search for sources with 24µm excesses. Meyer et al. (2008) adopted a similar approach to identify 24µm excesses in the FEPS sample, but used a single detection threshold over all brightness levels to identify excess sources. We extend their analysis by using the final FEPS data processing (see Paper I) and adopting separate detection thresholds for bright and faint sources.
In Figure 4, we show the dependence of on the dereddened 2MASS color, a proxy for spectral type, for stars brighter than mJy that do not have an apparent IRS excess (). These criteria were adopted to select high signal to noise photometry consistent with photospheric emission. An apparent trend exists in that stars with the largest value of also have red colors. All four stars with have spectral types between K0 and K5, consistent with an increasing value of toward later spectral types. A similar trend is observed in -band where the color is 0.0 mag over the spectral type range F2 to K4, and becomes redder toward later spectral types (Beichman et al., 2006a). However, we cannot confidently derive the functional dependence on on since the trend depends entirely on the four reddest stars. For simplicity, we assume a photospheric value of = 0.116 for , and = 0.125 for redder stars, which are the median colors in the respective color range of stars without IRS excesses.
In Figure 5, we show the observed ratio, normalized by the adopted photospheric value, as a function of the 8µm flux density. Since the 8µm emission is mostly photospheric in origin (see §3.1), sources with a large value of are candidate 24µm excess sources. To determine the minimum detectable 24µm excess, we consider the empirical scatter in for sources without an IRS excess () as shown by the gray circles in Figure 5. The value of the normalized appears nearly constant at a mean value of 1.0, but the RMS about the mean increases for sources fainter than . The computed RMS after rejecting one outlier point with normalized (W79; see §3.6) is 1.8% and 3.4% for sources brighter and fainter than 100 mJy respectively. By comparison, the median uncertainty in for the two brightness ranges is 1.1% and 1.3%, which is smaller than the observed scatter in . We adopt a minimum uncertainty in of 3.4% for stars fainter than and 1.8% for brighter sources. These minimum uncertainties imply a 3 detection limit for a 24µm excess above the photosphere of 10.2% for faint stars and 5.4% for bright sources. The detection limits for a 24µm excess are indicated by the dashed lines in Figure 5. Of the 314 stars in the sample, 50 have a value of more than 3 above the photosphere.
3.5 MIPS 70µm
Photometric excesses in the MIPS 70µm band were identified from comparison of the measured flux densities with the expected photospheric contribution. The 70µm photospheric flux density was estimated from the photospheric value of described in §3.4, and further assuming that the intrinsic photospheric color is 0 mag. We adopt flux densities for a zero magnitude star of 7.14 Jy and 0.775 Jy for the 24µm and 70µm band respectively as reported on the MIPS calibration web pages333http://ssc.spitzer.caltech.edu/mips/calib/ as of April 30, 2007. Hillenbrand et al. (2008) also identified sources with 70µm excesses in the FEPS data, but they used the Kurucz synthetic spectra normalized to optical and near-infrared broad-band photometry to estimate the 70µm photospheric emission.
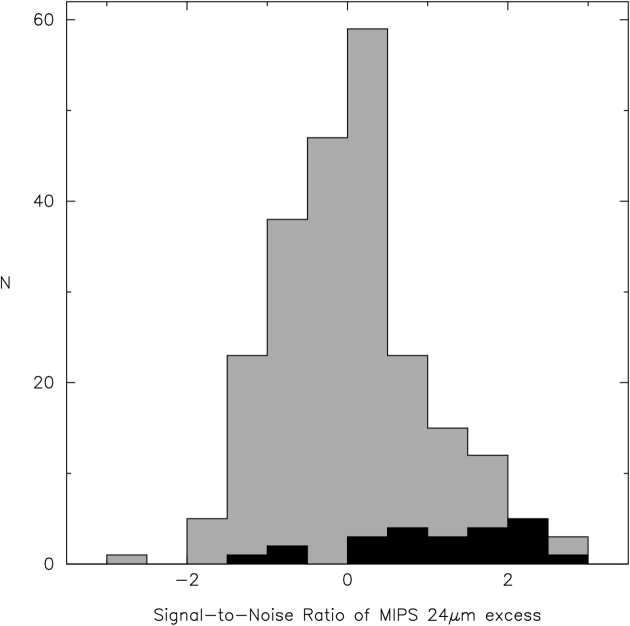
Of the 314 sources, 70µm emission was detected toward 22 sources with a signal to noise ratio . To establish which sources exhibit a 70µm excess from circumstellar dust, we present in Figure 6 a histogram of the signal-to-noise ratio of the observed 70µm emission above the stellar photosphere. The signal to noise of the excess is defined as , where is the uncertainty in the difference between the observed and photospheric flux densities including calibration uncertainties. The signal to noise is centered near zero with a tail toward positive values that may indicate 70µm excess sources. Of the 22 sources detected at 70µm, one source (HD 13974) has 70µm emission consistent with the photosphere, and 21 sources have a 70µm excess above the stellar photosphere with a signal to noise ratio greater than three. All 21 sources were also identified as 70µm excess sources by Hillenbrand et al. (2008).
3.6 Synthesis
We now combine results from the individual instruments to select a list of sources with infrared excesses that will be analyzed in the remainder of this paper. Since the MIPS 24µm bandpass is encompassed by the IRS spectral coverage, any 24µm photometric excess should be verifiable with IRS assuming comparable sensitivity. As discussed in §3.2, approximately 7 of the candidate IRS sources could be spurious. The expected false detection rate for the MIPS 24µm excesses is 1 since no sources have observed values more than 3 below the adopted photospheric value (see Fig. 5). Given the detection rate of 3 MIPS 24µm excesses (16%), the expected number of sources with a valid MIPS 24µm and a false IRS excesses is 1. The expected number of sources with a false MIPS 24µm and false IRS excess is 0.02. This is consistent with the fact that none of the 7 IRS sources with negative solid angles have a 24µm photometric excess. By requiring both an IRS and MIPS 24µm excess, we aim to create a more reliable sample of IR excesses.
In Figure 5, the 72 sources with apparent IRS excesses (see §3.2) are marked as black circles on the color-flux diagram used to identify MIPS 24µm excesses. Of the 50 sources with a photometric excess at 24µm, 46 are also identified with an IRS excess. Conversely, 26 sources have an IRS excess but not a 24µm photometric excess.
The 4 sources with MIPS 24µm excesses that are not verified spectroscopically are R45, V343 Nor, and V383 Lac, and W79. R45 has a 10.2% excess with a SNR of 3.0 and is at the limit to define a 24µm excess. R45 is located in bright nebulosity and the extracted IRS spectrum has negative flux densities at the longer wavelengths, perhaps because of poor background subtraction. The apparent 24µm photometric excesses in V343 Nor and V383 Lac are 6% above the photosphere. These two stars have K0 spectral types with colors of 0.53 mag, and therefore we adopted a low value for the intrinsic . Since the photospheric value of appears to increase toward later spectral types (see Fig. 4), the apparent photometric excess could be explained if we have underestimated the intrinsic value of by more than 0.6%. This is possible given our simplistic treatment on how varies with color. The star W79 has a photometric 24µm excesses of 22% above the photosphere at a signal-to-noise ratio of 6.5. We estimate that the apparent 24µm excess should have been detected in the IRS spectra between 24 and 34µm at 4.4 for dust temperature 100 K. The 24µm image for W79 contains extended and structured cirrus emission that complicates background subtraction and could conceivably create an apparent excess. Given the discrepant results between the IRS spectra and MIPS 24µm for W79, V343 Nor, and V383 Lac, and that R45 is at the limit to identify a photometric excess but does not have a confirming spectrum, we do not consider these four sources to have a MIPS 24µm excess in the remainder of this paper.
We thus have 46 sources with both a 24µm and IRS excess. Spectra for 40 of these sources are presented in Figure 7; spectra for 5 sources appear in Bouwman et al. (2008) in a study of optically thick disks in the FEPS sample, and 1RXS J051111.1281353 is presented in Figure 3. The detection of an infrared excess in both MIPS and IRS does not ensure the dust emission is associated with the star, since contamination by interstellar cirrus and galaxies will affect both measurements. The expected extragalactic contamination can be assessed from the observed extragalactic counts as a function of 24µm flux density from Papovich et al. (2004). For each star, we computed the probability that at least one galaxy is present within the FWHM size (6″) of the MIPS 24µm point response function that will produce a photometric excess at 24µm. The photospheric 24µm fluxes were computed from the observed 8µm flux density and the adopted photospheric values of (see §3.4). We find that 1 FEPS source could be contaminated by an extragalactic source bright enough to produce an apparent 24µm excess.
In Paper I, we considered the positional coincidence of the MIPS 24µm sources with the stellar coordinates to search for potential contaminants. For this sample of 314 stars, the largest astrometric offset between a MIPS 24µm excess source and the 2MASS stellar position is 1.3″ for HD 201219, which is a 2.5 deviation based on the observed dispersion in the coordinate offsets. (Two sources without 24µm excesses had larger angular offsets.) The 70µm detection of HD 201219 is offset by 3.4″ from the stellar position. We consider this source to have an excess, but the photometry should be viewed with some caution. We conclude that while the photometry for 1 FEPS source may be contaminated by a galaxy, there are no clear instances of contamination to the 24µm photometry444Stauffer et al. (2005) concluded that the measured 24µm excesses toward HII 152 and HII 250 were likely caused by background galaxies based on the positional mismatches between 2MASS and the 24µm Spitzer image from pipeline version S10.5. However, the positional differences in the Spitzer data reduction pipeline version S13 were not significant (see Paper I) and we consider these apparent excesses to be real..
The reliability of sources with 70µm excesses can be assessed in a similar manner. Of the 21 sources with excess at 70µm, 17 also have a 24µm and IRS excess. Three of the remaining four 70µm excess sources have an IRS excess but not a 24µm excess; spectra for these sources are presented in Figure 8. The one 70µm excess source without a confirming 24µm or IRS excess is HD 187897 (), where the signal-to-noise ratio of the 70µm excess is 6. The detected 70µm sources are within 5″ of the stellar position, and the expected number of contaminants from extragalactic sources that are nearly centered on the stellar source is negligible (Hillenbrand et al., 2008). We anticipate that most, if not all, of these sources are real 70µm excesses associated with the stellar target.
While the infrared excesses in most sources are confirmed with two or more Spitzer instruments, 23 sources have an excess detected with IRS that is not substantiated by either 24µm or 70µm photometry. The apparent IRS excesses for two sources (HD 104467 and RX J1531.3-3329) are deemed spurious since the inferred IRS dust temperatures are less than 14 K, and the model 70µm flux density should have been readily detected () if the excess was real. For the other 21 sources, the model 70µm density would have been detected at less than 2 and the observations cannot rule out the IRS excess. Spectra for the these 21 sources are presented in Figure 9.
To investigate whether or not these sources likely contain real IRS excesses, in Figure 10 we compare the signal-to-noise ratio of the MIPS 24µm excess for sources with unconfirmed IRS excesses (black histogram) and without a detectable excess in any of the Spitzer instruments (gray histogram). Sources with unconfirmed IRS excesses tend to have larger signal-to-noise ratios for the MIPS 24µm excess than sources without IRS excesses. Comparison of the dereddened colors for the two samples using the Kolmogorov-Smirnoff (K-S) test indicates the two samples have indistinguishable distributions of colors (K-S probability = 0.24), indicating that the differences in the excess distributions is not a result of a systematic error in the assumed intrinsic colors. By contrast, the K-S probability that the two populations have the same signal-to-noise distribution of 24µm excesses is 10-6, which suggests that it is unlikely the positive bias to the 24µm excesses can be attributed to random noise. Moreover, if the IRS-only excesses were due to random noise, the age distribution of these sources should mimic that of the full sample. Instead, 19 of the 21 sources with IRS-only excesses are younger than 300 Myr, while 202 of the 314 stars in the full sample are this young. The probability that this difference in the age distributions could result by chance is 1.6%. These results suggest that many of the IRS-only excess sources likely have a real infrared excess, but the 24µm photometric excess is too weak to detect.
In summary, we identified 50 stars that are considered to have a reliable infrared excess: 46 stars have both a MIPS 24µm () and IRS excess (), 3 stars have both IRS and MIPS 70µm excess () but no MIPS 24µm excess, and 1 star has a 70µm excess only. Of these 50 stars, 45 are considered “debris” disks and 5 are “primordial” disks (see §4). An additional 21 stars have an apparent IRS excess that is unconfirmed photometrically, but many of these sources likely have an excess based on the tendency to have positive 24µm photometric excesses (but less than ).
4 Temporal Evolution of Debris Disk Properties
The results presented in Figures 1 plus Figures 7 and 8 suggest a dichotomy in disk properties in that only 5 sources have excess emission at wavelengths 8µm, while for the remaining sources the excesses appear only at longer (µm) wavelengths. The 5 sources with 8µm excesses have properties (e.g. circumstellar disk masses, H accretion signatures, shape of the spectral energy distribution, high fractional disk luminosities) consistent with optically thick accretion disks (Silverstone et al., 2006; Bouwman et al., 2008). We show in §4.4 that the remaining sources have fractional infrared excess luminosities of and are consistent with optically thin dust emission. We assume that the thick disks represent “primordial” disks formed during the star formation process, and the optically thin systems are “debris” disks, although the transition between these states is not well characterized observationally.
In this section, we establish the empirical signature of disk evolution within the FEPS sample from this sample of debris disks. Since no debris disks were detected at 8µm, we investigate any evolutionary trends using MIPS photometry and IRS spectra. We first examine if the FEPS sample of debris disks contains any bias with respect to stellar luminosity, since dust emission will be brighter around more luminous stars for a given dust surface area and orbital radius. Stars with detected debris disks have spectral types ranging from K3 to F5 and span an order of magnitude in stellar luminosity. The median stellar luminosity for stars with 24µm excesses is 1.15 L⊙, compared to the median luminosity of 1.07 L⊙ for the entire sample. The K-S test indicates a 77% probability that the stellar luminosities for stars with and without 24µm excesses are drawn from the same parent population. A similar probability was derived for stars with and without 70µm excesses. Thus there is no evidence for luminosity bias within the FEPS debris disk sample, and we use these stars to investigate trends in the debris properties.
4.1 24µm excesses
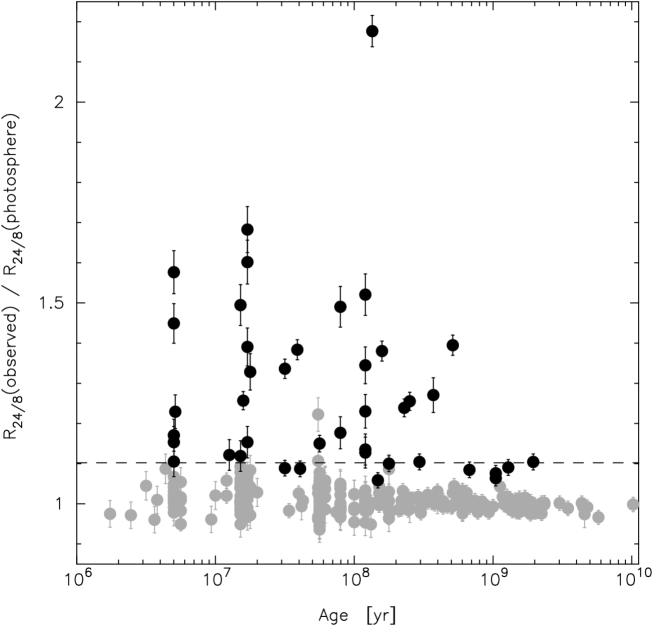
In Figure 11, we show the ratio of observed-to-photospheric versus stellar age to investigate the temporal evolution of 24µm excess emission. The magnitude of the 24µm excesses ranges from a low of 5.9% above the photosphere, as limited by the accuracy of the photometric calibrations, to a high of 118% for HD 61005555Hines et al. (2007) present resolved scatter light images of the HD 61005 debris system obtained with the Hubble Space Telescope.. The decline in the magnitude of the excess toward older ages appears abrupt in that the upper envelope of 24µm excesses is roughly flat at 50% above the photosphere (with HD 61005 as the main outlier) for ages 300 Myr, and 10% above the photosphere for ages 500 Myr. Based on the Kendall’s rank correlation statistic, as implemented in the ASURV Rev 1.2 package (Lavalley, Isobe, & Feigelson, 1992), the probability that the apparent correlation between stellar age and the magnitude of the 24µm excess can result from chance is .
To further quantify the temporal evolution of the 24µm excess, we select a uniform sample of excess sources over all ages. While the IRS spectra are sensitive to smaller excesses, the 24µm photometry is more uniform and is available for the full FEPS sample. Therefore, we draw a uniform sample based upon the 24µm photometry. The precision of is poorest for sources with mJy, where ()/ = 3.4% (see §3.4). The minimum 24µm excess that can be detected over all stellar ages at is 10.2%. A total of 38 sources have a 24µm photometric excess greater than this limit, of which 5 are primordial disks and 33 are debris disks.
In Figure 12, we show the fraction of debris disks that have a 24µm excess greater than 10.2% versus stellar age. The age bins, selected to span a factor of three in age, are younger than 10 Myr, between 10 and 30 Myr, 30-100 Myr, 100-300 Myr, 300-1000 Myr, and older than 1 Gyr. Preliminary results of this analysis were presented in Meyer et al. (2008), but we use the combined MIPS and IRS data to select a more reliable sample of sources with 24µm excesses. The results presented in Figure 12 and tabulated in Table 4 are consistent with the 24µm excess fraction remaining constant to within the uncertainties at a mean of 15% for ages less than 300 Myr. For older ages, the excess fraction declines to a mean of 2.7%. Using the two-tailed Fisher’s exact test to compare ratios, the probability that the 24µm excess fraction is the same for ages younger and older than 300 Myr is 0.04%. This result indicates a decline in the 24µm excess fraction with stellar age. However, the stellar age uncertainties prevent us from determining the form of the decline. As noted in Meyer et al. (2008), age uncertainties will tend to soften the decline perhaps indicating that it is starker than observed here.
Because the Fisher’s exact test considers only the binomial distribution of the excess fraction and does not account age uncertainties, we conducted a Monte Carlo experiment where the estimated stellar ages were modified randomly within a Gaussian distribution, and the fraction of stars with 24µm excesses younger and older than 300 Myr was re-evaluated. For stars that are members of associations or clusters, we assumed an age uncertainty of . For field stars and members of the Corona Australis association, we assumed uncertainty . A larger uncertainty for Corona Australis was adopted since it represents our youngest association where not only is the fractional error in age likely larger than for the older associations and clusters, but a true range of stellar ages may indeed be present as perhaps indicated by the mixture of stars without any disks and with optically thick disks. Our adopted age uncertainties are ad hoc, but we believe that they represent reasonable estimates. In 10,000 simulations, the number of stars younger than 300 Myr with 24µm excesses exceeded the number of such excess sources older than 300 Myr by at least a factor of two in 99% of the trials. Even if the age uncertainty for all stars was as large as , the excess fraction is larger than older stars in 99.6% of the trials. We conclude that the temporal decline in the fraction of stars with 24µm excesses is robust to plausible, random age uncertainties.
The sample of stars younger than 300 Myr contain a mixture of stars in clusters (20%), associations (28%), and the field (52%), while 80% of the sample older than 300 Myr are field stars. Clusters are typically considered to have stable dynamical times longer than 100 Myr while associations disperse into the field on timescales less than this (e.g. Lada & Lada, 2003). Environment, either in the form of high initial stellar density in clusters or the high radiation field from any OB stars in clusters or associations, could impact the lifetime of primordial disks and ultimately the formation of debris systems. We examine then whether or not the declining 24µm excess fraction with age is a result of differences in the excess properties in cluster, association and field-star populations666Many of the field stars could have formed in a cluster or association that has since dispersed. However, we have no means to distinguish dispersed cluster or association stars from sources that actually formed in relative isolation..
For stars younger than 300 Myr, the fraction of stars that have a 24µm excess above the photosphere is 7/38 (18%), 11/56 (20%), and 12/103 (12%) for clusters, associations, and field stars, respectively. Given the similar percentages for clusters and associations, we combine those samples into one. While the excess fraction for clusters/associations is nearly twice as high as for field stars, the probability that the field star excess fraction is drawn from the same parent population as cluster/associations is 17% based on the Fisher’s exact test. Therefore we are unable to determine definitively if a significant difference exists in the excess fraction between the two populations. We also considered the evolution of cluster/association stars and field stars separately. The probability that the excess fraction of cluster/association members younger than 300 Myr is the same as for older cluster stars (0/22) is 2%. Similarly, there is a 6% chance that the excesses fraction in young and old field stars was drawn from the same excess parent population. The fact that the decline in the excess fraction is suggestive for both clusters/associations and field stars, albeit at weak confidence for the individual samples, suggests that the overall decline in the excess fraction with age results from temporal evolution and not a change in the mix of clusters/association and field star populations.
Our results can be compared with other Spitzer surveys of debris disks. Since each survey adopts different detection thresholds and sample selection, this comparison is qualitative in nature. Siegler et al. (2007) compiled various Spitzer 24µm surveys of FGK stars and found a decline in the 24µm excess fraction with age similar to that observed in the FEPS sample. However, they inferred a higher excess fraction (36% on average) in clusters younger than 50 Myr compared to the FEPS sample despite having a higher detection threshold for a 24µm excess (15%). The frequency of debris disks found around A-stars declines on similar time scales as solar-type stars, although the debris disk frequency is higher (Rieke et al., 2005). One should keep in mind that debris disks identified towards A-type stars as a relative fraction of the stellar photospheric emission possess greater dust masses than similarly selected debris disks around G stars. Further, the dust detected at a given temperature generating 24µm excess is located at a greater orbital radius around A stars compared to G stars. Currie et al. (2008) suggest a more complicated evolutionary picture where the magnitude of the 24µm excess for A- and F-type stars increases from 5 to 10 Myr, peaks at ages of 10-15 Myr, and then declines toward older ages. Based on the Kendall’s rank correlation statistic and visual inspection of Figure 11, we do not find a similar trend for solar-type stars.
4.2 70µm excesses
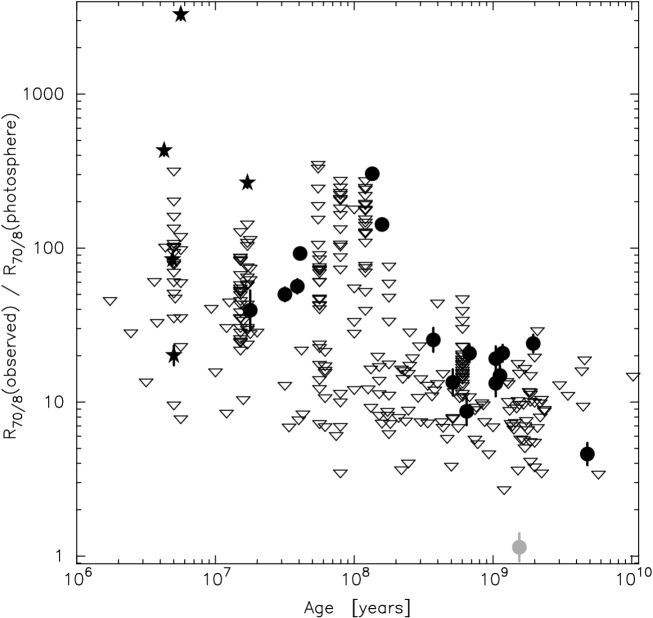
We present in Figure 13 the ratio of the observed-to-photospheric 70µm flux density as a function of stellar age. For sources that were not detected at 70µm, upper limits to the observed flux density were computed as 3 if , or as if . The upper limits include both internal and calibration uncertainties. The upper limits to the 70µm emission are typically 3-30 times the photosphere for stars older than 300 Myr, and 10-200 times for the younger, more distant stars. The detected 70µm sources have excesses up to 300 and 3000 the photosphere for the debris and primordial disks, respectively.
The maximum fractional 70µm excess occurs between ages of 30 and 200 Myr. Of the 105 stars in this age range, at least 5 sources have a 70µm fractional excess more than 50 times the photosphere. By contrast, of the 126 stars older than 200 Myr, none have this large of an excess and the upper limits to the 70µm fractional excess are all below 50. The probability that the luminous excess sources in the two ages samples are drawn from the same parent population is 1.8% according to the Fisher’s exact test. However, the significance of this comparison is sensitive to the age range chosen. If we compare all stars younger than 300 Myr to the older stars, the probability that the luminous excess are down from the same parent population is 8%. We also used the Kendall’s rank correlation statistic to evaluate if the 70µm excess depends on stellar age. Considering both detections and upper limits to the 70µm excess, the probability of a trend of 70µm excess emission with age is 46%.
The results presented in Figure 13 possibly suggests that relatively few luminous 70µm excess sources indicative of debris dust are found among the youngest sources. Considering only sources younger than 200 Myr, the Kendall’s rank correlation statistic indicates a 84% probability that a correlation is present the 70µm excess with age. We therefore do not find any evidence for evolution in the debris luminosity between 3 and 200 Myr.
In summary, we find weak evidence for a decline in the magnitude of the peak 70µm excess from intermediate-age stars (30-200 Myr) to older ages. We do not find any systematic temporal change in the overall 70µm excess, or if the amount of 70µm emission evolves between stellar ages of 3 and 200 Myr. Observations of additional stars in this age range combined with more sensitive flux density limits are needed to make more definitive conclusions. Compared to debris disks around A-star, Su et al. (2006) found that the decay time of the 70µm emission is 400 Myr. Qualitatively that is consistent with the FEPS data in that the upper envelope of 70µm emission appears to decline between 100 and 300 Myr.
4.3 Dust Temperature
Assuming the dust grains are in thermal equilibrium with the stellar radiation field, the dust temperature is a first order indicator of the orbital radius. For grains that are efficient absorbers of stellar radiation, the orbital radius, , is proportional to , where is the stellar luminosity and the dust temperature. In practice, the orbital radius cannot be derived uniquely from spectral energy distributions without knowledge of the grain size, composition, and porosity. Nonetheless, variations in the dust temperature may translate into a range of orbital radii if the grain properties are similar amongst the debris disks.
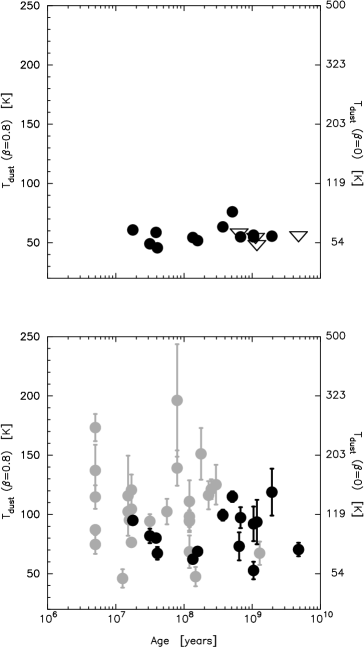
Dust temperatures derived by fitting a Kurucz model plus a modified blackbody () to the IRS spectra between 12 and 35µm (see §3.2) are plotted versus stellar age in the bottom panel in Figure 14 for debris disks with an IRS excess and either a MIPS 24 or 70µm excess. Different colored symbols are shown for sources with (black circles) and without (gray circles) 70µm excesses. A greater fraction of the older sources tend to have 70µm excesses, which most likely reflects that older stars tend to be closer in distance than the younger objects, and smaller excesses can be detected. The dust temperatures range from K (HD 281691) to K (HE 750) with a median of 112 K. The distribution of dust temperatures overlaps for sources with and without 70µm detections, although the median dust temperature is higher for sources without 70µm detections (102 K vs. 81 K). The top panel in Figure 14 shows the dust temperature derived from the MIPS 24 and 70µm photometry. The temperatures derived from the MIPS photometry are lower than that inferred from the IRS spectra, suggesting the presence of cooler dust (see §4.4). No strong trend between dust temperature and stellar age is evident.
The observed scatter in the ratio , which is proportional to the orbital radius assuming isothermal dust radiating as a blackbody, is three times larger than the expected scatter if the orbital radius was the same for all sources. These results suggest variations are present in the orbital location of dust. Variations in dust properties may also contribute to the scatter, but we consider here only the range of orbital radii implied by the observations. The minimum orbital radius of the dust grains can be estimated assuming the grains radiate like blackbodies. The implied orbital radius is . The range of blackbody temperatures derived from the IRS spectra, K to K with a median of 113 K, corresponds to orbital radii of 31 AU and 1 AU with a median of 6 AU. (We excluded 1RXS J051111.1281353 since the IRS excess is poorly fitted with a modified blackbody.) If most of the surface area is from smaller grains which do not emit as blackbodies, the corresponding radii will be larger.
4.4 Fractional Dust Luminosity
The amount of dust emission radiated in the 24µm and 70µm bandpasses depends on both the surface area and temperature of the dust grains. The fractional dust luminosity (), or equivalently the fractional dust bolometric flux (), accounts for variations in dust cross-sectional surface area and temperatures to reflect the total amount of stellar emission absorbed and re-radiated by dust grains.
The luminosity of “warm” dust emission between 12 and 35µm is constrained by the IRS spectra. The modified-blackbody fits provide estimates of both the dust temperature and surface area of dust grains, and extrapolation of these fits yields the bolometric flux of warm dust () over all wavelengths. For sources without a detectable IRS excess, upper limits to were computed by first integrating the excess emission in the IRS spectrum after subtracting the model photosphere and computing the formal uncertainty in the integrated flux. The 3 upper limits were then computed in a manner similar to that for the 70µm upper limits as described in §4.2. The warm dust bolometric flux, was normalized by the photospheric bolometric flux () estimated as
| (1) |
where is the Stefan-Boltzmann constant, is the photospheric temperature estimated from the observed stellar colors or spectral type (see Paper I), is the observed IRAC 3.6µm flux density, and is the Planck function.
The “cool” dust luminosity radiated at wavelengths longer than 35µm is not as well determined since we have a single observation at 70µm and most of our measurements are upper limits. Moreover, Hillenbrand et al. (2008) found that the color temperature inferred from the observed 33 to 24µm flux densities is often higher than that derived from the 70 to 33µm flux density ratio, although the significance of the temperature difference is marginal for any single star. The modified blackbody fits to the IRS spectra provide a more accurate assessment of the dust temperature since the shape of the entire emission spectrum is used to estimate the dust temperature and luminosity. We find that the 70µm flux density from the modified blackbody fits underestimates the observed 70µm excess flux density by 3-11 for 11 of the 16 debris disks with a 70µm detection even if is assumed to maximize the predicted 70µm emission. For the 5 remaining debris disks, the observed flux density exceeds the projected value, but by less than 3. These results suggests that an additional cool dust component is present in many sources which contributes significantly to the 70µm emission but not at IRS wavelengths. The dust luminosities estimated from the IRS spectra then underestimate the total luminosity.
Given that the distribution of dust temperatures is poorly constrained by the 70µm observations, we adopt a two component model to estimate the bolometric dust luminosity. The predicted 70µm flux density from the warm component was subtracted from the observed 70µm flux density to yield the 70µm emission from cooler dust (). The bolometric flux of cool dust was estimated assuming a single dust temperature, , as
| (2) |
where is the frequency corresponding to the mean wavelength of the MIPS 70µm bandpass. We adopt K to conform to the temperature frequently inferred from mid-infrared observations of debris disks around solar-type stars (Zuckerman & Song, 2004; Hillenbrand et al., 2008). Upper limits to the cool luminosity were computed using and the upper limit to . The upper limits do not include the uncertainty in nor the arbitrary amount of luminosity that could be generated by adding even cooler dust that does not radiate prominently at 70µm.
The fractional dust luminosity as a function of stellar age is presented in Figure 15 for the warm dust, and the sum of the warm and cool dust components. The trends apparent in this figure are similar to those concluded based on the MIPS 24 and 70µm photometry considered alone. The fractional warm luminosity from the young (optically thick) disks is typically an order of magnitude greater than that from older (debris) disks, although the fractional luminosity from the strongest debris disk (HD 61005) is lower by only a factor of 5. For sources with 70µm detections, the debris disk sources with the highest fractional dust luminosity are at ages younger than 200 Myr with a decline in the peak fractional luminosity toward old ages. The fractional luminosities of the detected debris disks in the FEPS sample are similar to the solar-type stars of comparable age observed by Trilling et al. (2008). A-type stars show a similar decline in the fractional luminosity on timescales of 100-300 Myr (Su et al., 2006) as observed in the FEPS solar-star sample.
5 Debris Disk Models
The dynamics of dust grains in optically thin systems are dominated by radiative and collisional processes when the effects of gas drag are negligible (Takeuchi & Artymowicz, 2001). Pascucci et al. (2006) used Spitzer high resolution spectroscopy to place an upper limit of 0.04 MJupiter to the gas mass in the inner disk for 15 debris systems within the FEPS program having ages between 5 and 400 Myr. While these limits are still too high to establish whether gas drag is a marginal process in the evolution of dust grains (gas–to–dust ratio 0.1), we assume here that is in fact the case.
For debris disks detectable with current instrumentation, Dominik & Decin (2003) demonstrated that collisional processes combined with radiation pressure dominate over Poynting-Robertson drag in removing dust grains from the system (see also Wyatt, 2005). Hillenbrand et al. (2008) confirmed that collisions are likely the dominant process for the disks detected at 70µm in the FEPS sample. Stellar mass loss also produces a drag on the orbiting dust in a manner analogous to the Poynting-Robertson effect, and for the Sun, the current rate of dust mass loss from corpuscular drag is about 0.3 that of radiation drag (Gustafson, 1994). At younger ages the stellar mass loss rates are likely higher, and wind drag may be more important than Poynting-Robertson drag and even collisions for young debris disks (Jura, 2004; Chen et al., 2005). However, given the uncertainties on the scaling of mass loss rates with stellar age (Wood et al., 2002, 2005), we do not consider wind drag effects.
Assuming that collisional processes are the dominant forces influencing dust dynamics, the location of the dust grains should trace the spatial distribution of the planetesimals. Therefore, we adopt a model in which the planetesimals are co-spatial with the debris dust. The following section describes the model calculations, and in subsequent sections we apply this model to infer the properties and evolution of the planetesimals.
5.1 Model Description
The model planetesimal belt extends between an inner orbital radius and an outer radius , and contains particles with radii between and . The particle size distribution as a function of orbital radius () and particle radius () is
| (3) |
such that is the number of particles between and , and between and . Since the slope of the particle size distribution is the same over all orbital radii in this model, the particle surface area and mass surface density will also scale as . The particle size distribution of is appropriate for a collisional cascade without boundary conditions on the minimum and maximum particle size (Dohnanyi, 1969). In practice, radiation pressure imposes limits on the minimum particle size, and numerical simulations predict a “wavy” pattern of particle sizes since the smallest grains are not available to break up particles near the cutoff limit (Campo Bagatin et al., 1994; Thébault & Augereau, 2007). For simplicity, however, we consider only a power-law distribution of particle sizes. With this adopted size distribution, most of the grain surface area is contained in the smallest particles such that is the critical parameter, while the larger particles contain most of the disk mass (M).
The flux density from the disk assuming optically thin emission is
| (4) |
where is the dust temperature as a function of particle size and orbital radius, is the absorption coefficient, and is the distance to the star. For particle sizes smaller than 3 mm in radius, we computed using the procedure described in Wolf & Hillenbrand (2003) and the optical constants for “astronomical silicates” (Weingartner & Draine, 2001). For larger particles, we adopted = 1, which is valid for the wavelength range considered here (µm). Dust temperatures were computed assuming the disk is optically thin and in thermal equilibrium with the stellar radiation field.
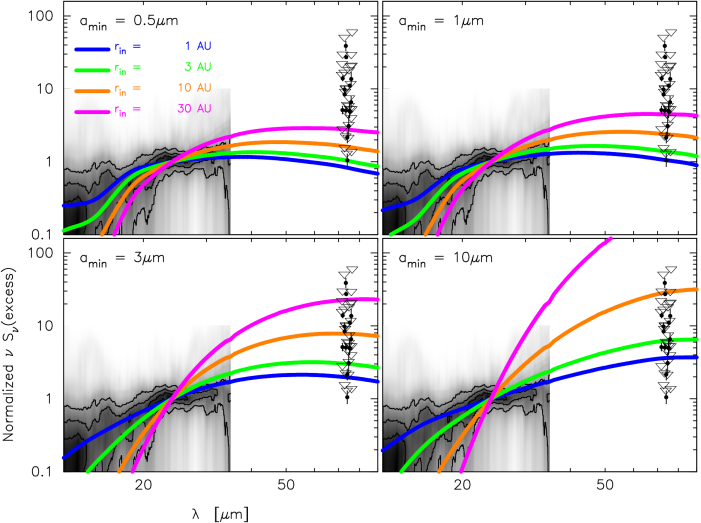
In Figure 16, we present calculations that illustrate how various model parameters affect the resulting spectra. The model disk surrounds a solar type star and contains minimum grain sizes that span the range from the approximate radiation blow-out size (Burns, Lamy, & Soter, 1979) to the smallest grain size that radiates like a blackbody at 70µm. The inner disk radii range from the terrestrial planet zone in our Solar System to the Kuiper Belt. The models are compared to sources with IRS excesses that are confirmed by MIPS 24µm or 70µm photometry.
The main features of the data that need to be explained are the shape of the IRS spectra, and the intensity of the MIPS 70µm photometry relative to the IRS excess. The density contours allows one to assess the median behavior and the deviation around a “typical” debris disk. Models with small grains ( 1µm) and small inner disk radii ( 10 AU) tend to reproduce the general shape of the IRS spectra, but underestimate the 70µm flux densities for those stars detected at this longer wavelength due to the falloff in small grain radiative efficiency. If the minimum grain size is 3µm, the models can explain the level of 70µm emission, but then cannot produce the tail of warm excess emission observed between 20 and 30µm. When 70µm excess emission is not detected, then a broad combination of model parameters can reproduce the observations. From these illustrative models of debris dust located over a range of orbital distances from a central star and having a range of grain sizes, we conclude that some of the features typical of the observations can be explained, but that a more systematic parameter study is needed. In the following subsections we first examine which of the disk parameters can be constrained robustly, and then study the time evolution of the plausible debris belts.
5.2 Constraints on the Inner Disk Radius
To place constraints on the disk and grain properties, we used a Bayesian approach to infer the likelihood of model parameters given the observational data (see, e.g., Lay, Carlstrom, & Hills, 1997) for the debris disks that have reliable infrared excesses (see §3.6). We constructed a grid of models spanning the three dimensional parameter space of inner disk radius, disk width (), and the power-law slope of the mass surface density. Plausible ranges for each of the parameters were considered. The inner disk radius was varied between 0.1 and 1000 AU to encompass the size scales inferred for protoplanetary disks. The disk width was varied between 0.1 and 1000 AU to allow for narrow rings and wide belts. Models were computed for surface density power-laws (see Eq. 3) between 1.5 to 0 in steps of 0.5, encompassing the mass surface density of the current Solar System (; Weidenschilling, 1977), of that commonly inferred for protoplanetary disks (; Beckwith et al., 1990; Kitamura et al., 2002; Andrews & Williams, 2005), and a constant surface density ().
Spectra over the Spitzer wavelength range were computed for each combination of the above parameters assuming an optically thin disk with particle size distribution extending from the radiation blowout size to a 1000 km radius. The spectral types for stars with debris disks span between K3 and F5, or approximately an order of magnitude in stellar luminosity. The corresponding radiation blowout size varies between 0.2-0.7µm (Burns, Lamy, & Soter, 1979). Nonetheless, we did not compute a grid of models for each source, but adopted stellar parameters for a canonical solar type star and fixed the radiation blowout size at µm. The maximum particle radius of 1000 km corresponds to the size of the bodies needed to excite the collisional cascade in the debris disk models by Kenyon & Bromley (2004). The maximum particle size has negligible influence on the model calculations for the observed emission since large bodies contain a relatively small surface area for the adopted particle size distribution.
The model at a given grid point was fitted to the observations with a normalization constant as a free parameter that is proportional to the total particle cross-sectional area for optically thin emission. The photospheric contribution was determined using the fits described in §3. The relative probability of the model, given the data, is proportional to , where is the sum of the squares of the difference between the model and the data normalized by the observational uncertainties. The probability distribution of a single model parameter is determined by summing the probabilities over the other two model parameters, and normalizing the integrated probability to unity. The parameter constraints from the ensemble of sources is then computed as the sum of the probability distributions for each source, and re-normalizing the sum to unity.
The probability distributions are only meaningful if the model provides a reasonable fit to the observations, which can be judged from the minimum values across the grid. For model fits to the IRS spectra between 12 and 35µm, 35 of the debris disks have probabilities that the residuals are consistent with noise. For fits to both the IRS spectra and the MIPS 70µm photometry (detections and non-detections), 27 sources have probabilities . In general, sources with 70µm detections have higher values that reflect the difficulty in finding models that can fit the IRS spectral shape and the 70µm photometric excess simultaneously (as illustrated in Figure 16).
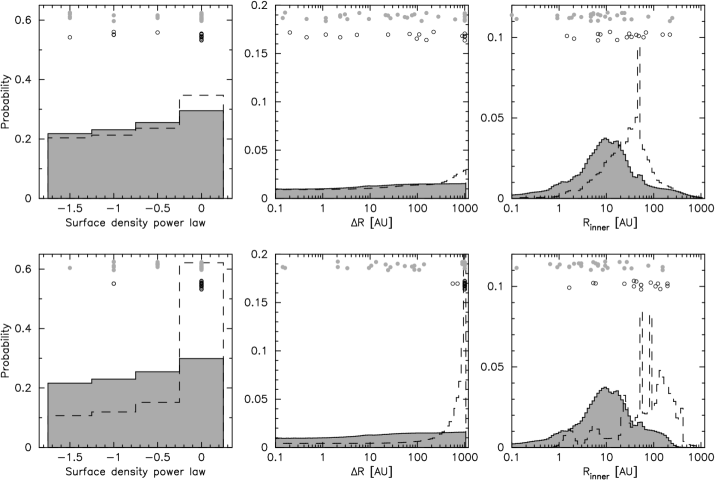
Probability distributions for infrared excess sources with and without MIPS 70µm detections are presented in the top panels of Figure 17 for fits to the IRS spectra only, and in the bottom panels for fits to both the IRS spectra and 70µm photometry. Best fit model parameters for each source are represented by circles. We do not find any correlation of best-fit model parameters with spectral type, suggesting that adopting a single stellar model did not significantly impact the results. These histograms indicate the constraints on the model parameters for the ensemble of observed debris disks. For two of the parameters, surface density power law and disk width, the probability distributions are relatively flat. The one input parameter having moderate constraint is the inner disk radius. This is most apparent in the probability distribution that considers only the IRS spectra (which are most diagnostic of warm inner disk material). Most debris disks appear to have inner radii between 3-40 AU, with somewhat larger inner radii for stars with 70µm detections. We explore the implications of this result starting in §5.3.2.
For the sources with 70µm detections, adding the 70µm flux densities as a constraint in the model fits accentuates many of the trends described above (see Fig. 17). Models with flatter surface density profiles are generally preferred. The inner disk radius increases to 100-200 AU. There is a strong tendency for a large disk width; indeed, since the most probable disk width is also the maximum value in the model grid (1000 AU), these model calculations have not established the upper bound of the outer disk radius. Disks this wide, however, are inconsistent with the other observations of debris disks around solar-type stars in that scattered-light images images and resolved submillimeter images typically find radii less than 200 AU (Schneider et al., 2006; Ardila et al., 2004; Greaves et al., 1998). Furthermore, the reduced values for the model fits tend to be high for sources with 70µm detections, indicating as we illustrated earlier that the model has difficulty fitting both the IRS spectral shape and the 70µm photometry. Better fits with smaller outer disk radii could be obtained by modifying the model assumptions to decrease the relative number of smaller grains. This can be accomplished, for example, by adopting for a less steep grain size distribution than , or adopting a larger minimum grain size. Also, improved model fits could be obtained by allowing for a population of small grains that are decoupled spatially from the larger grains, as was found for the Vega debris disk (Su et al., 2006). Finally, adopting a different grain composition (e.g. water ice for the outer disk particles), may modify the fits as well.
5.3 Evolution of the Planetesimal Belts
The analysis presented in §5.2 was intended to constrain the properties of the debris systems, which indicate the presence of planetesimal belts. The most strongly constrained parameter is the inner belt radius, which we find is typically 3-40 AU. We now extend our analysis, adopting these parameters, in order to study temporal evolution of the debris belt properties. The main observational characteristics of the observed debris disks related to temporal evolution (Figures 11, 12, 13, and 15) are: (1) the lack of debris emission at wavelengths shorter than 16µm for ages older than 3 Myr, (2) a flat distribution to the upper-envelope of 24µm excesses for age 300 Myr with a decline toward older ages, and (3) the apparent decline in the maximum 70µm excess emission for stars older than 300 Myr. In this section, we explore if temporal collisional models can explain these aspects of the observational data.
We adopt the analytic model developed by Dominik & Decin (2003) and extended by Wyatt et al. (2007a) to describe the collisional evolution of a planetesimal belt in quasi-steady state equilibrium. The model posits that small grains are continually produced by collisional grinding of massive bodies, and mass is removed by radiation blowout of the smallest grains. For a system in collisional equilibrium, the mass surface density of solid particles in a narrow annulus of a planetesimal belt () as a function of time is
| (5) |
where is the initial mass surface density of particles and is the collisional timescale for the largest planetesimals when the cascade begins at . A similar expression is valid for the number of particles and the cross-sectional surface area. In the calculations described below, we use the formula for presented in Equation 13 in Wyatt et al. (2007a). However, it is instructive to view an approximate formula for to understand how the collisional evolution depends on disk parameters. We make three assumptions: i) a particle size distribution of (Dohnanyi, 1969), ii) the orbital eccentricity () is approximately equal to the orbital inclination, and iii) the size of the planetesimals that can destroy the largest planetesimals is much smaller than . The collisional time at for a narrow planetesimal belt at orbital radius is then
| (6) |
where is the particle density and the specific incident energy required to destroy a planetesimal (Wyatt et al., 2007a). In this model, the collisional timescale is inversely proportional to the surface density. For , the mass surface density of the disk at radius is constant in time since the largest particles in the system have undergone few collisions. The spread in debris disk luminosities at young ages then depends on the cross-sectional surface area at and the distance of the dust from the star. However, for , the mass surface density, and hence the emission from the disk, is independent of the initial disk surface density (see Dominik & Decin, 2003; Wyatt et al., 2007a).
To compute the emission from a debris disk as a function of time, the disk was divided into annuli of width that corresponds to the range of orbital radii for a particle. As an approximation to the different evolution timescales at different radii in the disk, Equations 5 and 6 were applied to each annulus separately. The emission from individual annuli was computed using Equation 4 and then summed to get to the total disk emission. The model assumes that the collisional cascade begins at a stellar age of 0 Myr. We note that primordial disks survive for 1–10 Myr (see, e.g., Haisch, Lada, & Lada, 2001), and the collisional cascade in the planetesimal belt will be delayed relative to the stellar age by at least the minimum time to form the planetesimals.
5.3.1 Gas-Giant and Kuiper Belt Zones
We first attempt to explain the excess characteristics at 8, 16, and 24µm. The 70µm data are not used since the disk properties needed to produce this emission are poorly constrained by the data (see §5.2 and Fig. 17). The model planetesimal belt has a fiducial inner radius of 10 AU in accordance with the disk properties inferred in §5.2. In the following section we relax this assumption and explore the signatures of planetesimals in the inner 10 AU. For the other disk parameters we explore a range of properties. The disk surface density at is parameterized as a constant surface density disk of ; models were computed for ranging from 0.03 to 3 g cm-2. We consider disks with an outer radius of 15 and 100 AU to emulate a narrow ring and a wide belt, respectively. Extending the disk beyond 100 AU will change the 24µm flux density by less than 10% since the dust at these radii is too cool to radiate prominently at µm.
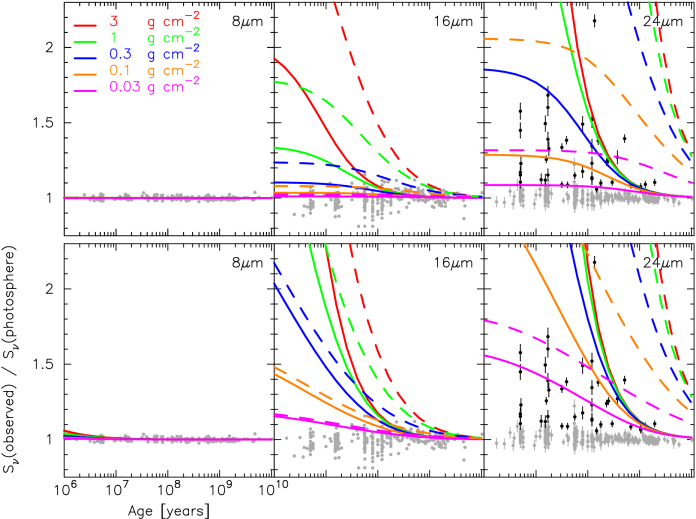
In Figure 18, we present model calculations for the temporal evolution of the 8, 16, and 24µm emission. In the top panels, different colored curves represent distinct values of for an outer radius of 15 AU (solid curves) and 100 AU (dashed curves). The IRAC 8µm, 16µm, and MIPS 24µm observations discussed in §3 are also shown, with black circles representing sources with infrared excesses at the wavelength.
The model curves shown in the top row of panels of Figure 18 shows a flat emission profiles for younger ages, followed by a fall off in the intensity toward older ages. This general shape is expected based on the adopted density distribution with time (Eq. 5). Models with an outer radius of 100 AU have brighter emission than models with a 15 AU outer radius since the larger disk contains more dust surface area.
The models predict that the 8µm excess is % at an age of 1 Myr for all surface densities considered here. This excess level is consistent with the observed 3 upper limit of 3% found toward individual stars. The lack of 8µm emission in the models is expected since the inner 10 AU was assumed to be evacuated of dust.
At 16 and 24µm, the models cannot provide a unique interpretation of the results since the disk size and power-law surface density are degenerate parameters. Nonetheless, we show in Figure 18 that a class of models exists that can account for many of the observed characteristics. For example, these models predict 16µm emission of less than 20% for surface densities 0.3 g cm-2. At 24µm, the emission is relatively constant for ages 100 Myr if g cm-2 and =100 AU, or for g cm-2 and =15 AU. The =15 AU models agrees well with the observations in that the emission falls sharply with age at 300 Myr. However, for models with =100 AU, the 24µm emission persists for as long as 10 Gyr, which is much longer than observed. The time constant of the emission could be decreased for the =100 AU models to better match the data by decreasing the maximum planetesimal size, having a steeper radial density profile, or increasing the particle eccentricity.
While we have not done an exhaustive parameter study, we conclude that basic characteristics of the 8, 16, and 24µm excess emission can be explained by a planetesimal belt with an inner radius of 10 AU in quasi-steady state collisional evolution. This model can account for the magnitude of the excesses, and the relatively flat distribution of 24µm excess for young ages, and the decline in the 24µm excess for ages older than 100-300 Myr.
5.3.2 Depletion of the Inner Disk
The models presented in the top panel of Figure 18 assume an inner disk radius of 10 AU, which is a typical radius inferred from analysis of the IRS spectra (§5.2). By contrast, the inferred inner disk radius in primordial disks is 0.3 AU (e.g. Akeson et al., 2005), and at least in our solar system, the terrestrial planets must have formed from planetesimals well within 3 AU. Collisions in the inner planetesimal belt would presumably produce warm debris that will emit at wavelengths shorter than 24µm and could be traced by IRS spectra and IRAC photometry.
One difficulty in detecting warm debris disks is related to the speed at which they are expected to evolve. For a disk with a power-law surface density distribution (Eq. 3), the timescale for collisional growth of planetesimals varies with orbital radius as (Lissauer, 1987)777The radial exponent for planetesimal growth adopted here differs from that for planetesimal destruction (see Eq. 6) because of additional assumptions about how physical parameters vary with radius in the latter model (see Wyatt et al., 2007a).. We thus expect that the collisional cascade will also proceed on faster timescales at smaller orbital radii for , and that the inner disk will be depleted more quickly of dust mass via radiation blowout of the smallest grains than the outer disk. We consider then if a planetesimal belt that originally extended to small radii will deplete on timescales fast enough to remain consistent with the lack of observed excess emission at 8 and 16µm, or if another mechanism is needed to increase the dissipation timescale. For this exercise, we consider a disk model with an inner radius of 0.5 AU, and otherwise adopt the disk parameters assumed in §5.3.1. Model calculations that show the temporal variations of the emission are presented in bottom row of panels in Figure 18.
As expected, changing the inner disk radius from 10 AU to 0.5 AU increases the amount of short-wavelength emission. For 3 Myr, the model 8µm disk emission is 3.0% above the photosphere and detectable in individual sources with the FEPS IRAC observations in disk models with and gm cm-2. These models are consistent with the observations in that no optically thin 8µm emission was detected in FEPS sample, which covers stellar ages older than 3 Myr.
Based on the FEPS observations, 12% of stars are surrounded by optically thick disks between ages of 3-10 Myr. If we assume that the collisional cascade begins primarily after the cessation of accretion and all optically thick disks pass through a debris phase, then 12% of stars with ages of 3-10 Myr may contain recent production of 8µm debris emission. Since 8µm emission will be detectable for up to 3 Myr after the start of the collisional cascade for an inner disk radius of 0.5 AU, we expect to detect 1-2 stars with optically thin 8µm emission. This is consistent with the null detections of optically thin emission in the FEPS sample. We conclude that the absence of 8µm detections in the FEPS sample does not meaningfully constrain the presence or lack thereof of the initial planetesimal belts at a radius of 0.5 AU, and that observations for a much larger sample of young stars are needed to probe this rapid evolutionary stage (see Currie et al., 2007).
The IRS and MIPS 24µm observations provide more meaningful constraints on the temporal evolution of the inner planetesimal belts. With the smaller inner disk radius, the collisional time scale is smaller for the AU model than the 10 AU model considered in §5.3.1 for the same surface density (see Eq. 6). The emission curves are largely on the evolution phase and the predicted 16 and 24µm emission decline rapidly with time for most of the surfaced densities considered here (see Figure 18). Yet the observed emission is much less than predicted by many of the models explored here.
Because the inner disk radius is smaller than considered in §5.3.1, this class of models requires lower overall surface densities to match the observations. Model with surface densities of g cm-2 produce higher 16 and 24µm flux densities and a sharp decline in the flux densities with increasing age that is inconsistent with the observations. Qualitative agreement between the models and the observations is found for g cm-2 in that the 16µm excess is less than 20%, and that the magnitude of 24µm is consistent with the observations. As was found in §5.3.1, models with AU provide a better match to the temporal decline than models with AU for the assumed parameters. We conclude that if the inner planetesimal belt initially extended to 0.5 AU, the belt can deplete fast enough to explain the observations. However, bright 16µm excess emission from debris dust would be expected to found around young ( Myr) stars.
5.4 Timescale of the Debris Phase
The fraction of stars in the FEPS sample with 24µm excesses greater than 10.2% above the photosphere is constant to within the uncertainties at 15% for ages less than 300 Myr. By contrast, while some primordial disks dissipate within 1 Myr (Padgett et al., 2006; Cieza et al., 2007), about half of solar mass stars at age of 1-3 Myr remain surrounded by primordial disks whether traced by emission at 3-8µm (Haisch, Lada, & Lada, 2001; Hernández et al., 2007), 10µm (Mamajek et al., 2004), or 24µm (e.g. Lada et al., 2006; Damjanov et al., 2007). We consider then why the fraction of 1 Myr stars with primordial disks, and therefore have at least the potential to form planets, is much higher than the stars detected with debris dust.
As discussed in Meyer et al. (2008), the observed fraction of stars with 24µm excesses as a function of age (see Fig. 11) may reflect one of two scenarios. One possibility is that only 15% of disks around solar-type stars form planets or large planetesimals, and the resulting debris disks emit at 24µm for 100-300 Myr. The results presented in §5.3.1 indicate that a quasi-steady state collisional cascade can explain basic characteristics of the excess emission observed in debris disks under certain assumptions (see also Dominik & Decin, 2003; Wyatt et al., 2007a), although this model is not a unique interpretation of the data. Another possibility is that the debris phase is more common, but for any given star it is short lived and so for any given age interval, only 15% of stars exhibit the debris phenomenon. In this interpretation, more than 60% of FEPS stars pass through a debris phase at some point in their lifetime, suggesting that most solar-type stars form planetary systems.
The critical distinction between the above two scenarios is the lifetime of the debris phase and whether the dust is continuously replenished over tens of million of years in a quasi-steady state, or if the dust is a transient phenomenon. We reconsider the arguments in Meyer et al. (2008) using the full complement of Spitzer data from the FEPS program. We assume that the planetesimal belt extends from inner radius to outer radius . The lower limit to the debris disk lifetime is set by the timescale for the collisional cascade to propagate through the disk. For a power-law radial surface density of , the timescale for collisional growth is proportional to . If the debris phase is a transient phenomenon, the duration of the debris phase, defined as , is much less than the age intervals used to create Figure 12, or . The width of the planetesimal belt () to limit the debris phase to is then given by . For a typical inner radius of 10 AU and between 0 and 1.5, the width of the planetesimal belts responsible fo the 24µm emission must be AU to allow for a short debris phase.
We consider the likelihood that most of the debris disks have narrow planetesimal belts given the observations. The model calculations presented in §5.2 suggest that the grains producing the 70µm emission, and by inference the corresponding planetesimal belt, extend over tens of astronomical units. By the above arguments, we expect the debris phase for these systems to persist over tens of millions of years. Whether or not the emission is detectable at 24 or 70µm over this time period depends on the characteristics of the planetesimal belt.
As demonstrated in §5.3.1, large planetesimal belts in a quasi-steady state can produce 24µm emission above the FEPS detection limit for 100 Myr. This result is model dependent, however, and we consider the case where 24µm emission is only produced when a “wave” of debris production propagates through the disk (Kenyon & Bromley, 2002, 2005). In this scenario, stars have narrow planetesimal belts at various radii, and we observe 24µm emission only when the collisional cascade is initiated at a given radius. The expectation is that debris in planetesimal belts at large radii will be produced at later times, such that the observed 100-300 Myr lifetime of the 24µm emission would translate to a factor of 6–10 variation in radii for . The temperature of the debris emission would decrease by a factor of over this range of radius for blackbody grains. While the observed range of dust temperatures is of this magnitude (see Figure 14), there is no evidence for a systematic change in the dust temperatures with age to support this scenario.
Alternatively, the 100-300 Myr lifetime of strong 24µm emission could primarily reflect variations in the disk surface density, where the collisional cascade is initiated at later times in lower density disks. Since 24µm excesses are observed over a factor of 10-30 in age, we expect a corresponding variation in the magnitude of the 24µm excess, with smaller excesses at older ages. As show in Figure 11, there is no evidence for a systematic decline of this magnitude for stars younger than 300 Myr.
Another possibility is that the debris emission is produced by catastrophic events that produce copious amounts of debris dusts for brief periods (Rieke et al., 2005). Wyatt et al. (2007a) evaluated the probability of such collisions and found that the frequency of such collisions will vary with time as at a given orbital radius. Assuming the orbital radii of planetesimal belts are approximately the same, one would expect a two order of magnitude decrease in the fraction of disks exhibiting a catastrophic collision between 10 and 100 Myr. This contrasts with the observed flat distribution of fractional excesses with age for ages 300 Myr (see Figure 12). We therefore suggest the 15% detection rate of debris disks younger than 300 Myr primarily reflects that only 15% of solar-type stars exhibit 24µm excesses (greater than 10.2% above the photosphere) over their lifetime.
If the fraction of stars that pass through a relatively long-lived, luminous 24µm debris phase is about 15%, we return now to the question of why this percentage is so low given that most young stars are surrounded by primordial disks. The spread in lifetimes of primordial disks is 10 Myr. If planetesimal production from primordial disks is the same regardless of the lifetime of the primordial phase, then a delay of 10 Myr in the offset of debris production will have little influence on the duration ( 100-300 Myr) of the 24µm debris phase. However, we can anticipate a range of planetesimal growth timescales related to the observed dispersion in primordial disk masses, as well as diversity in dynamical processes that sculpt planetary systems.
It is tempting to compare this frequency of detected debris ( 15%) to the occurrence of gas giant planets. Cumming et al. (2008) report the frequency of sun-like stars with gas giants 0.1 MJupiter of up to 20% when extrapolated out to 20 AU. Moro-Martín et al. (2007a) were unable to confirm a correlation between debris disk phenomenon and the presence of close in gas giant planets (see however Moro-Martín et al., 2007b, for a notable example). Apai et al. (2008) did not find evidence of massive gas giants in debris systems with large inner holes. It remains unclear to whether these debris disks represent those with inner gas giants or are another population representing a diverse planetary system architecture. Perhaps these large inner holes are evidence of rapid planet formation in the terrestrial planet zone. The question remains whether those sources lacking obvious debris represent dynamically full planetary systems that rapidly cleared all potential sources of debris, or primordial disks that dissipated leaving nothing behind.”
Could we have missed a significant number of debris disks in our survey? Debris disks could not have been detected if the dust is colder or less luminous than the sample detected here. In the context of the collisional planetesimal model, on timescales shorter than the collisional time scale, the most massive and larger planetesimal belts will produce more luminous 24µm emission. Similarly, increasing the inner disk radius would decrease the 24µm disk emission. Evidence for additional debris disks is present within the FEPS data. Analysis of the IRS spectra suggest a possible additional 21 disk candidates that do not exhibit a 24µm excess, and most of the sources appear younger than 300 Myr. If these infrared excesses are real, the debris disk percentage would increase from 15% to 24%. However, this is still much less than the primordial disk fraction found around stars, and it remains unclear what primordial disk properties produced this small percentage of debris disk detections.
6 Comparison to the Solar System
The basic geometry of the planetesimal disks inferred from debris dust surrounding the FEPS sample is a cleared inner disk out to 10 AU with optically thin dust beyond these radii. For the sources with 70µm detections, the inferred radii are many tens of AU wide (see also Hillenbrand et al., 2008). This morphology is similar to that of the Kuiper Belt of our Solar System. In this section, we make more quantitative comparison between the Solar System and the debris disks in the FEPS sample, considering both Kuiper Belt-like dust on tens of AU scales and the available constraints on zodiacal dust on several AU scales.
The model results in §5 suggest that the initial surface density of solids for FEPS detected debris disks is 3 g cm-2 at 1 AU; this is less than surface density of solids expected for the “minimum-mass-solar-nebula” ( 7-30 g cm-2, Weidenschilling, 1977; Hayashi, 1981). However, the model surface densities are extremely sensitive to the adopted parameters since most of the surface area is contained in smaller particles, while the large particles contain the majority of the mass. For example, by changing the power law slope of the size distribution from to for particle sizes between 0.5µm and 1000 km, the total cross-sectional surface density of particles can be maintained if the mass surface density is increased by a factor of 1000. Given the poor constraints on the planetesimal belt mass, our comparisons to the solar system will focus on the fractional dust luminosity which is more closely tied to the observations.
We first consider the sensitivity of the Spitzer observations to the present day Solar System zodiacal dust (see also Mamajek et al., 2004). Following Gaidos (1999), the luminosity emitted by zodiacal dust is L⊙ with a characteristic temperature of 260 K (Reach et al., 1996). The implied surface area of particles to reproduce this luminosity given the characteristic temperature is cm2, which Gaidos (1999) defined as 1 “zody” ( 1 ). For the median observed 8µm flux density of 127 mJy, and the 3 sensitivity limit of 3% to 8µm excesses (see §3.1), the IRAC observations can detect 8µm excesses of 4 mJy typically. At the median distance of 50 pc to stars in the FEPS sample, this limit corresponds to a sensitivity limit of 4500 for 260 K dust. Similarly, the synthetic IRS 16µm photometry is sensitive to an infrared excess of 16.2% (5 mJy for the typical star), and 5.4-10.2% (0.8-1.6 mJy) for MIPS 24µm. For 260 K dust, these limits translate to a sensitivity limit of 1400 and 220-440 , respectively. Our sensitivity limits then do not preclude the presence of zodiacal-type dust present in the FEPS debris disk sample.
The MIPS 70µm observations are sensitive to cooler temperature dust ( 70 K), and the more appropriate comparison is the Kuiper Belt. Emission from debris dust in the Kuiper Belt has not been detected. Stern (1996) place an upper limit of to the optical depth at 60µm, and models of the Kuiper Belt population suggest that the current luminosity emitted by dust in the Kuiper Belt is L⊙ (Backman, Dasgupta, & Stencel, 1995). This disk luminosity is substantially lower than the luminosities derived for disks in the FEPS sample. However, the Sun, at an age of 4.57 Gyr (Bahcall, Pinsonneault, & Wasserburg, 1995), is significantly older than most stars observed here ( 3 Gyr). Therefore we must account for temporal depletion of small dust grains from Poynting-Robertson drag and collisional processes to make a proper comparison between the FEPS sample and the Kuiper Belt (e.g. Meyer et al., 2007). Including the effects of the dynamical rearrangements of the outer planets indicated in the Nice Model (Gomes et al., 2005, e.g.) is vital for a complete comparison to the solar system, but is beyond the scope of this work.
We use the quasi-steady state collisional model developed by Dominik & Decin (2003) and described in §5 to project forward the evolution of the FEPS debris disks. We can identify three regimes for the anticipated evolution of the disks. When the age of the debris disks is shorter than the initial collisional timescale () of the largest particles in the cascade, the debris emission will be approximately constant in time. When system ages is , but collisions still dominate, the debris luminosity will vary in time as . Finally, when the Poynting-Robertson (PR) drag time scale becomes shorter than the collisional timescale, the number of particles and the emission will vary in time as .
For the debris disks detected by FEPS, the collisional timescale is likely shorter than the PR timescale for all particle sizes (Dominik & Decin, 2003; Hillenbrand et al., 2008). However, it is not possible to determine if the debris disk luminosity is on the constant, , or the phase of collisional evolution. We assume that each debris disk is currently in the phase to achieve the fastest dissipation time. The debris system luminosity evolves as until the Poynting-Robertson drag is shorter than the instantaneous collisional timescale. From Backman & Paresce (1993) the collisional time scale is
| (7) |
where is the fraction of the geometric surface area that is covered with particles. For a uniform surface density disk, , where is the fractional dust luminosity (Backman, 2004). Also from Backman & Paresce (1993) the Poynting-Robertson time scale is given by
| (8) |
where is the particle size. Adopting an inner disk radius of 10 AU and an outer radius of 100 AU, the PR time scale for the smallest grains (0.5 m) will be shorter than the collisional time scale for .
The debris disks detected by FEPS at ages of 20-200 Myr have fractional luminosities between and . If these luminosities are projected forward in time using the above prescription for a disk that extends between 10 and 100 AU, by the age of the solar system the expected luminosity is between and (see Figure 15). Between ages of 400 and 1200 Myr the median fractional luminosity observed for the FEPS detected debris disks is . These systems project forward to luminosities of at 4.5 Gyr. Clearly any such projections are extremely uncertain, though we conclude that with the possible exception of the youngest debris disks, the projected luminosities are 1-2 orders of magnitude brighter than the estimated luminosity of the Kuiper Belt. These data are consistent with the solar system debris luminosity being “typical” (c.f. Bryden et al., 2006).
7 Summary
We have completed a Spitzer photometric (3.6, 4.5, 8, 24, and 70µm) and spectroscopic (7-35µm) survey of 314 FGK solar-type stars that span ages between 3 Myr and 3 Gyr. These data were used to identify sources that have infrared emission above the stellar photosphere that is diagnostic of circumstellar dust. This study complements previous Spitzer studies which have surveyed either more massive A- and F- type stars (Rieke et al., 2005; Su et al., 2006), lower mass M-type stars (Gautier et al., 2007), solar-mass field stars (Trilling et al., 2008; Beichman et al., 2006b; Bryden et al., 2006), or stars in open clusters of well defined ages (Siegler et al., 2007; Gorlova et al., 2007; Cieza, Cochran, & Augereau, 2008; Currie, Plavchan, & Kenyon, 2008). Moreover, the extensive photometric and spectroscopic coverage enables a thorough investigation of the circumstellar dust properties.
The multi-wavelength dataset was utilized to select a reliable sample of sources with infrared excesses. Five sources display infrared excesses in the IRAC, MIPS, and IRS data, and have characteristics of optically thick, gas-rich, primordial disks. The other sources identified with infrared excesses have properties more akin to debris disks in that the excess emission is detected at wavelengths longer than 16µm and the fractional luminosity is . Physical properties of the putative planetesimal belts that produce the debris were inferred by fitting the spectral energy distribution emitted from an optically thin debris disk containing a power-law distribution of silicate particles (). The results suggest that the inner disk is typically cleared out to 3-40 AU, and for sources with detected 70µm excesses, the debris extends over tens of astronomical units.
An average 15% of the stars younger than 300 Myr have a 24µm excess more than 10.2% above the photosphere, and this fraction declines to 2% for older stars. The maximum 70µm excess exhibits decline over the same age range. The temporal properties were modeled with a planetesimal belt in quasi-steady state collisional equilibrium where mass is removed from the system by radiation blowout of the smallest particles. Such a model can account for the lack of excess emission shortwards of 16µm and the relatively flat distribution of 24µm excesses with age. These results suggest it is not necessary to invoke transient collisional events to explain the emission characteristics though they cannot be ruled out. Another possibility is that they were cleared out to 10 AU by dynamical processes associated with inner planet formation. We can only speculate whether those sources lacking evidence for debris in the present survey will never (or have never) exhibited such evidence, or whether they represent systems with the maximum (or minimum) numbers of planets expected from primordial disks.
The properties of the debris disks in the FEPS sample were compared to that of the Solar System zodiacal dust and Kuiper Belt. The FEPS observations are sensitive to times the luminosity of the zodiacal disk and cannot rule out the presence of a Solar System type debris disk. The luminosity of the debris systems was compared with a simple model for the evolution of the debris dust that neglects dynamical events suggested in the Nice model of the solar system (Gomes et al., 2005). Comparing the expected evolution of the younger, luminous debris disks detected in our survey, as well as our upper limits, we cannot rule out that cold outer debris disks comparable to our own solar system are the rule rather than the exception.
References
- Akeson et al. (2005) Akeson, R. L. et al. 2005, ApJ, 635, 1173
- Andrews & Williams (2005) Andrews, S. M., & Williams, J. P. 2005, ApJ, 631, 1134
- Apai et al. (2008) Apai, D., et al. 2008, ApJ, 672, 1196
- Ardila et al. (2004) Ardila, D. R., et al. 2004, ApJ, L617
- Aumann (1985) Aumann, H. H. 1985, PASP, 97, 885
- Aumann et al. (1984) Aumann, H. H., et al. 1984, ApJ, 278, L23
- Aumann & Probst (1991) Aumann, H. H., & Probst, R. G. 1991, ApJ, 368, 264
- Backman (2004) Backman, D. E. 2004, in Debris Disks and the Formation of Planets: A Symposium in Memory of Fred Gillett, ASP Conference Series, 324, 9
- Backman, Dasgupta, & Stencel (1995) Backman, D. E., Dasgupta, A., & Stencel, R. E. 1995, ApJ, 450, L35
- Backman & Gillett (1987) Backman, D. E., & Gillett, F. C. 1987, in Cool Stars, Stellar Systems and the Sun, ed. J. L. Linsky & R. E. Stencel (Berlin: Springer), 340
- Backman & Paresce (1993) Backman, D. E., & Paresce, F. 1993, in Protostars and Planets III, ed. E. H. Levy & K. L. Lunine, 1253
- Bahcall, Pinsonneault, & Wasserburg (1995) Bahcall, J. N., Pinsonneault, M. H., & Wasserburg, G. J. 1995, Reviews of Modern Physics, 67, 781
- Beckwith et al. (1990) Beckwith, S. V. W., Sargent, A. I., Chini, R. S., & Guesten, R. 1990, AJ, 99, 924
- Beichman et al. (2005a) Beichman et al. 2005a, ApJ, 626, 1061
- Beichman et al. (2005b) Beichman et al. 2005b, ApJ, 622, 1160
- Beichman et al. (2006a) Beichman et al. 2006a, ApJ, 652, 1674
- Beichman et al. (2006b) Beichman et al. 2006b, ApJ, 639, 1166
- Bouwman et al. (2008) Bouwman, J., et al. 2008, ApJ, in press
- Bryden et al. (2006) Bryden, G., et al. 2006, ApJ, 636, 1098
- Burns, Lamy, & Soter (1979) Burns, J. A., Lamy, P. L., & Soter, S. 1979, Icarus, 40, 1
- Campo Bagatin et al. (1994) Campo Bagatin, A., Cellinio, A., Davis, D. R., Farinella, P., & Paolicchi, P. 1994, Planetary and Space Science, 42, 1079
- Carpenter et al. (2008) Carpenter, J. M., et al. 2008, ApJS, submitted, Paper I
- Chen et al. (2005) Chen, C. H., Jura, M., Gordon, K. D., & Blaylock, M. 2005, ApJ, 623, 493
- Cieza et al. (2007) Cieza, L. et al. 2007, ApJ, 667, 308
- Cieza, Cochran, & Augereau (2008) Cieza, L. A., Cochran, W. D., & Augereau, J.-C. 2008, ApJ, 679, 720
- Cumming et al. (2008) Cumming, A., Butler, R. P., Marcy, G. W., Vogt, S., Wright, J. T, & Fischer, D. A. 2008, 867, 531
- Currie et al. (2007) Currie, T., et al. 2007, ApJ, 659, 599
- Currie et al. (2008) Currie, T., et al. 2008, ApJ, 672, 574
- Currie, Plavchan, & Kenyon (2008) Currie, T., Plavchan, P., & Kenyon, S. J. 2008, arXiv0807.2056
- Cutri et al. (2003) Cutri, R. M., et al. 2003, The IRSA 2MASS All-Sky Point Source Catalog (Pasadena: IPAC), http://irsa.ipac.caltech.edu/applications/Gator
- Damjanov et al. (2007) Damjanov, I., Jayawardhana, R., Scholz, A., Ahmic, M., Nguyen, D. C., Brandeker, A., & van Kerkwijk, M. H. 2007, ApJ, 670, 1337
- Decin et al. (2003) Decin, G., Dominik, C., Waters, L. B. F. M., & Waelkens, C. 2003, ApJ, 598, 636
- Dohnanyi (1969) Dohnanyi, J. W. 1969, J. Geophys. Res., 74, 2531
- Dominik & Decin (2003) Dominik, C. & Decin, G. 2003, ApJ, 598, 626
- Gaidos (1999) Gaidos, E. J. 1999, ApJ, 510, L131
- Gautier et al. (2007) Gautier, T. N. III, et al. 2007, ApJ, 667, 527
- Gehrels (1986) Gehrels, N. 1986, ApJ, 303, 336
- Gomes et al. (2005) Gomes, R., Levison, H. F., Tsiganis, K., & Morbidelli, A. 2005, Nature, 435, 466
- Gorlova et al. (2007) Gorlova, N., Balog, Z., Rieke, G. H., Muzerolle, J., Su, K. Y. L., Ivanov, V. D., Young, E. T. 2007, ApJ, 670, 516
- Gray (1992) Gray, D. F. 1992, The Observation and Analysis of Stellar Photospheres (Cambridge: Cambridge Univ. Press)
- Greaves et al. (1998) Greaves, J. S., et al. 1998, ApJ, 506, L133
- Greenberg et al. (1984) Greenberg, R., Wacker, J. F., Hartmann, W. K., & Chapman, C. R. 1978, Icarus, 35, 1
- Gustafson (1994) Gustafson, B. A. S. 1994, Annual Review of Earth and Planetary Sciences, 22, 553
- Habing et al. (1999) Habing, H. J., et al. 1999, Nature, 401, 456
- Habing et al. (2001) Habing, H. J., et al. 2001, A&A, 365, 545
- Haisch, Lada, & Lada (2001) Haisch, K. E. Jr., Lada, E. A., & Lada, C. J. 20001, ApJ, 443, L153
- Hayashi (1981) Hayashi, C. 1981, Progress of Theoretical Physics Supplement, 70, 35
- Hernández et al. (2007) Hernández, J., et al. 2007, ApJ, 662, 1067
- Hillenbrand et al. (2008) Hillenbrand, L. A., et al. 2008, ApJ, 677, 630
- Hines et al. (2007) Hines, D. C., et al. 2007, ApJ, 671, 165
- Holland et al. (1998) Holland, W. S., et al. 1998, Nature, 392, 788
- Hollenbach et al. (2005) Hollenbach, D., et al. 2005, ApJ, 631, 1180
- Jura (2004) Jura, M. 2004, ApJ, 603, 729
- Kalas, Liu, & Matthews (2004) Kalas, P., Liu, M. C., & Matthews, B. C. 2004, Science, 303, 1990
- Kenyon & Bromley (2001) Kenyon, S. J., & Bromley, B. C. 2001, AJ, 121, 538
- Kenyon & Bromley (2002) Kenyon, S. J., & Bromley, B. C. 2002, ApJ, 577, L35
- Kenyon & Bromley (2004) Kenyon, S. J., & Bromley, B. C. 2004, ApJ, 602, L133
- Kenyon & Bromley (2005) Kenyon, S. J., & Bromley, B. C. 2005, AJ, 130, 269
- Kim et al. (2005) Kim, J. S., et al. 2005, ApJ, 632, 659
- Kitamura et al. (2002) Kitamura, Y., Momose, M., Yokogawa, S., Kawabe, R., Tamura, M., & Ida, s. 2002, ApJ, 581, 357
- Koerner et al. (1998) Koerner, D. W., Ressler, M. E., Werner, M. W., & Backman, D. E. 1998, ApJ, 503, L83
- Krivov et al. (2007) Krivov, A. V., Queck, M., Löhne, T., & Sremčević, M. 2007, A&A, 462, 199
- Lada & Lada (2003) Lada, C. J., & Lada, E. A. 2003, ARA&A, 41, 57
- Lada et al. (2006) Lada, C. J., et al. 2006, AJ, 131, 1574
- Lagrange, Backman, & Artymowicz (2000) Lagrange, A.-M., Backman, D. E., & Artymowicz, P. 2000, Protostars and Planets IV, ed. V. Mannings, A. P. Boss, & S. S. Russell (Tucson: Univ. Arizona Press), 639
- Lavalley, Isobe, & Feigelson (1992) Lavalley, M., Isobe, T., & Feigelson, E. 1992, in ASP Conf. Ser. 25, Astronomical Data Analysis Software and Systems I, ed. D. M. Worrall, C. Biemesderfer, & J. Barnes (San Francisco: ASP), 245
- Lay, Carlstrom, & Hills (1997) Lay, O. P., Carlstrom, J. E., & Hills, R. E. 1997, ApJ, 489, 917
- Liou & Zook (1999) Liou, J.-C., & Zook, H. A. 1999, AJ, 118, 580
- Lissauer (1987) Lissauer, J. J. 1987, Icarus, 69, 249
- Mamajek & Hillenbrand (2008) Mamajek E. & Hillenbrand, L. A. 2008, ApJ, submitted
- Mamajek et al. (2004) Mamajek, E. E., Meyer, M. R., Hinz, P. M., & Hoffman, W. F. 2004, ApJ, 612, 496
- Mannings & Barlow (1998) Mannings, V., & Barlow, M. J. 1998, ApJ, 497, 330
- Mathis (1990) Mathis, J. S. 1990, ARA&A, 28, 37
- Meyer, Calvet, & Hillenbrand (1997) Meyer, M. R., Calvet, N., & Hillenbrand, L. A. 1997, AJ, 114, 288
- Meyer et al. (2004) Meyer, M. R., et al. 2004, ApJS, 154, 422
- Meyer et al. (2006) Meyer, M. R. et al. 2006, PASP, 118, 1690
- Meyer et al. (2007) Meyer, M. R., Backman, D. E., Weinberger, A. J., & Wyatt, M. C. 2007, in Protostars and Planets V, edits. B. Reipurth, D. Jewitt, and K. Keil, (U. Arizona Press: Tucson)
- Meyer et al. (2008) Meyer, M. R. et al. 2008, ApJ, 673, L181
- Moór et al. (2006) Moór, A., Ábrahám, P., Derekas, A., Kiss, Cs., Kiss, L. L., Apai, D., Grady, C., & Henning, Th. 2006, ApJ, 644, 525
- Moro-Martín & Malhotra (2003) Moro-Martín, A., & Malhotra, R. 2003, AJ, 125, 2255
- Moro-Martín & Malhotra (2005) Moro-Martín, A., & Malhotra, R. 2005, AJ, 633, 1150
- Moro-Martín et al. (2007a) Moro-Martín, A., et al. 2007a, ApJ, 658, 1312
- Moro-Martín et al. (2007b) Moro-Martín, A., et al. 2007b, ApJ, 668, 1165
- Padgett et al. (2006) Padgett, D. L. et al. 2006, ApJ, 645, 1283
- Papovich et al. (2004) Papovich, C. et al. 2004, ApJS, 154, 70
- Pascucci et al. (2006) Pascucci, I., et al. 2006, ApJ, 651, 1177
- Pascucci et al. (2007) Pascucci, I., et al. 2007, ApJ, 663, 383
- Plets & Vynckier (1999) Plets, H., & Vynckier, C. 1999, A&A, 343, 496
- Preibisch & Mamajek (2008) Preibisch, T., & Mamajek, E., in press, Handbook of Low Mass Star Forming Regions Vol. II: The Southern Sky, ed. B. Reipurth
- Press et al. (2002) Press, W. H., Teukolsky, S. A., Vetterling, W. T., & Flannery, B. P. 2002, Numerical Recipes in C++ (Cambridge: Cambridge Univ. Press)
- Protassov et al. (2002) Protassov, R., van Dyk, D. A., Connors, A., Kashyap, V. L., & Siemiginowska, A. 2002, ApJ, 571, 545
- Reach et al. (1996) Reach, W. T., et al. 1996, A&A, 315, L381
- Rebolo, Martín, & Magazzú (1992) Rebolo, R., Martiín, E. L, & Magazzù, A. 1992, ApJ, 389, L83
- Rhee et al. (2008) Rhee, J. H., Song, I., & Zuckerman, B. 2008, ApJ, 675, 777
- Rhee et al. (2007) Rhee, J. H., Song, I., Zuckerman, B., & McElwain, M. 2007, ApJ, 660, 1556
- Rieke et al. (2005) Rieke, G. H. 2005, ApJ, 620, 1010
- Safronov (1969) Safronov, V. S. 1969, Evolyutsiya doplanetnogo oblaka i obrazovanie Zemli i planet (Moscow: Nauka) (English transl. Evolution of the Protoplanetary Cloud and Formation of the Earth and the Planets NASA Tech. Transl. F-677 Jerusalem: Israel Program Sci. Transl. 1972)
- Schneider et al. (2006) Schneider, G., et al., 2006, ApJ, 650, 414
- Siegler et al. (2007) Siegler, N., Muzerolle, J., Young, E. T., Rieke, G. H., Mamajek, E. E., Trilling, D. E., Gorlova, N., & Su, K. Y. L. 2007, ApJ, 654, 580
- Silverstone et al. (2006) Silverstone, M. D., et al. 2006, ApJ, 639, 1138
- Smith & Terrile (1984) Smith, B. A., & Terrile, R. J. 1984, Science, 226, 1421
- Song et al. (2005) Song, I., Zuckerman, B., Weinberger, A. J., & Becklin, E. E. 2005, nature, 436, 363
- Spangler et al. (2001) Spangler, C., Sargent, A. I., Silverstone, M. D., Becklin, E. E., & Zuckerman, B. 2001, ApJ, 555, 932
- Spaute et al. (1991) Spaute, D., Weidenschilling, S. J., Davis, D. R., & Marzari, F. 1991, Icarus, 92, 147
- Stauffer et al. (2005) Stauffer, J. R., et al. 2005, AJ, 130, 1834
- Stern (1996) Stern, S. A. 1996, A&A, 310, 999
- Su et al. (2006) Su, K. Y. L., et al. 2006, ApJ, 653, 675
- Takeuchi & Artymowicz (2001) Takeuchi, T., & Artymowicz, P. 2001, ApJ, 557, 990
- Thébault & Augereau (2007) Thébault, P. & Augereau, J.-C. 2007, A&A, 472, 169
- Trilling et al. (2008) Trilling, D. E., et al. 2008, ApJ, 675, 1086
- Weidenschilling (1977) Weidenschilling, S. J., 1977, Ap&SS, 51, 153
- Weingartner & Draine (2001) Weingartner, J. C., & Draine, B. T. 2001, ApJ, 548, 296
- Werner et al. (2004) Werner, M., et al. 2004, ApJS, 154, 1
- Wetherill & Stewart (1989) Wetherill, G. W., & Stewart, G. R. 1989, Icarus, 77, 300
- Williams & Wetherill (1994) Williams, D. R., & Wetherill, G. W. 1994, Icarus, 107, 117
- Williams & Andrews (2006) Williams, J. P., & Andrews, S. M. 2006, ApJ, 653, 1480
- Williams et al. (2004) Williams, J. P., Najita, J., Liu, M. C., Bottinelli, S., Carpenter, J. M., Hillenbrand, L. A., Meyer, M. R., & Soderblom, D. R. 2004, ApJ, 604, 414
- Wolf & Hillenbrand (2003) Wolf, S. & Hillenbrand, L. A. 2003, ApJ, 496, 603
- Wood et al. (2002) Wood, B. E., Müller, H.-R., Zank, G. P., & Linsky, J. L. 2002, ApJ, 574, 412
- Wood et al. (2005) Wood, B. E., Müller, H.-R., Zank, G. P., Linsky, J. L., & Redfield, S. 2005, ApJ, 628, L143
- Wyatt (2003) Wyatt, M. C. 2003, ApJ, 598, 1321
- Wyatt (2005) Wyatt, M. C. 2005, A&A, 433, 1007
- Wyatt et al. (2007a) Wyatt, M. C., Smith, R., Greaves, J. S., Beichman, C. A., Bryden, G., & Lisse, C. M. 2007a, ApJ, 658, 569
- Wyatt et al. (2007b) Wyatt, M. C., Smith, R., Su, K. Y. L., Rieke, G. H., Greaves, J. S., Beichman, C. A., & Bryden, G. 2007b, ApJ, 663, 365
- Zuckerman & Song (2004) Zuckerman, B., & Song, I. 2004, ApJ, 603, 738
| Group | Age Range | Number Stars | Spectral type | ||
|---|---|---|---|---|---|
| (Myr) | F | G | K | ||
| Corona Australis | 3-10 | 7 | 0 | 2 | 5 |
| Upper Scorpius | 5 | 16 | 0 | 8 | 8 |
| Upper Centaurus Lupus | 15 | 23 | 1 | 13 | 9 |
| Lower Centaurus Crux | 17 | 14 | 0 | 9 | 5 |
| IC 2602 | 55 | 5 | 0 | 4 | 1 |
| Alpha Per | 80 | 13 | 6 | 6 | 1 |
| Pleiades | 120 | 20 | 5 | 14 | 1 |
| Hyades | 600 | 22 | 5 | 10 | 7 |
| Field | 3-3000 | 194 | 22 | 131 | 41 |
| Age Range | Number | Percentage | Spectral Type | |||||
|---|---|---|---|---|---|---|---|---|
| (Myr) | Total | Associations | Field | Associations | Field | F | G | K |
| 10 | 34 | 21 | 13 | 62 | 38 | 1 | 15 | 18 |
| 10-30 | 49 | 39 | 10 | 80 | 20 | 2 | 26 | 21 |
| 30-100 | 59 | 18 | 41 | 31 | 69 | 10 | 37 | 12 |
| 100-300 | 60 | 20 | 40 | 33 | 67 | 11 | 38 | 11 |
| 300-1000 | 55 | 22 | 33 | 40 | 60 | 6 | 38 | 11 |
| 1000 | 57 | 0 | 57 | 0 | 100 | 10 | 42 | 5 |
| All | 314 | 120 | 194 | 38 | 62 | 40 | 196 | 78 |
| Name | Stellar | log (age/years) | 22Dereddened color | Normalized ratios33Ratio of the observed flux density ratio to the photospheric value. | log 44Probability statistic computed from -test for fitting model photospheres and modified blackbodies to IRS spectra. | Excess? | |||||||
|---|---|---|---|---|---|---|---|---|---|---|---|---|---|
| Group11 Per: Alpha Perseus; CrA: Corona Australis; LCC: Lower Centaurus Crux; UCL: Upper Centaurus Crux; USco: Upper Scorpius | (mag) | 8µm | 16µm | IRS | 24µm | 70µm | |||||||
| 1E 0307.4+1424 | Field | 7.8 | 0.40 | 0.92 0.05 | 1.06 0.03 | -41.9 | 21.0 | -0.73 | |||||
| 1E 0324.1-2012 | Field | 7.8 | 0.37 | 1.16 0.05 | 1.08 0.03 | -7.1 | 15.0 | -2.52 | |||||
| 1RXS J025216.9+361658 | Field | 7.8 | 0.69 | 0.81 0.05 | 0.94 0.03 | -0.6 | 4.3 | -1.37 | |||||
| 1RXS J025751.8+115759 | Field | 7.8 | 0.49 | 0.95 0.05 | 0.97 0.03 | 3.6 | 15.0 | -0.16 | |||||
| 1RXS J030759.1+302032 | Field | 8.2 | 0.43 | 0.95 0.05 | 0.96 0.03 | 2.2 | 5.4 | -1.18 | |||||
| 1RXS J031644.0+192259 | Field | 7.7 | 0.43 | 1.09 0.05 | 1.03 0.03 | -57.8 | 36.9 | -0.68 | |||||
| 1RXS J031907.4+393418 | Field | 7.8 | 0.49 | 0.98 0.05 | 1.02 0.03 | -22.1 | 31.6 | -0.23 | |||||
| 1RXS J034423.3+281224 | Field | 7.8 | 0.38 | 1.01 0.05 | 0.96 0.03 | -0.4 | 4.9 | -1.44 | |||||
| 1RXS J035028.0+163121 | Field | 7.8 | 0.45 | 0.96 0.05 | 1.00 0.03 | -32.3 | 21.1 | -0.26 | |||||
| 1RXS J043243.2-152003 | Field | 6.6 | 0.43 | 0.95 0.05 | 1.01 0.03 | -7.8 | 11.4 | -1.82 | |||||
| 1RXS J051111.1+281353 | Field | 6.7 | 0.51 | 1.02 0.05 | 1.23 0.03 | 2.0 | 15.8 | -0.94 | |||||
| 1RXS J053650.0+133756 | Field | 8.2 | 0.53 | 0.90 0.05 | 0.98 0.03 | -0.3 | 20.6 | -4.54 | Y | ||||
| 2RE J0255+474 | Field | 7.9 | 0.68 | 1.00 0.05 | 0.97 0.03 | -1.1 | 4.0 | -0.27 | |||||
| AO Men | Field | 7.1 | 0.72 | 1.10 0.05 | 1.02 0.02 | 2.8 | 2.0 | -0.27 | |||||
| AP 93 | Per | 7.9 | 0.58 | 0.98 0.05 | 1.05 0.03 | 32.3 | 62.4 | -0.46 | |||||
| B102 | IC 2602 | 7.7 | 0.43 | 0.94 0.05 | 1.04 0.03 | -57.9 | 85.3 | -25.38 | Y | ||||
| BPM 87617 | Field | 8.1 | 0.78 | 0.99 0.05 | 0.95 0.03 | -4.0 | 5.7 | -0.32 | |||||
| HD 105 | Field | 7.5 | 0.35 | 0.99 0.05 | 1.09 0.02 | 50.1 | 5.2 | -18.90 | Y | Y | Y | ||
| HD 377 | Field | 7.6 | 0.31 | 1.06 0.05 | 1.38 0.02 | 56.5 | 6.0 | -45.36 | Y | Y | Y | ||
| HD 691 | Field | 8.5 | 0.40 | 0.99 0.05 | 1.02 0.02 | 3.1 | 2.7 | -3.00 | Y | ||||
| HD 984 | Field | 7.6 | 0.33 | 0.81 0.05 | 1.01 0.02 | -3.2 | 2.9 | -0.39 | |||||
| HD 6434 | Field | 9.5 | 0.39 | 1.03 0.05 | 0.99 0.02 | 3.0 | 2.8 | -0.14 | |||||
| HD 6963 | Field | 9.0 | 0.40 | 1.00 0.05 | 1.06 0.02 | 13.3 | 2.6 | -7.72 | Y | Y | Y | ||
| HD 7661 | Field | 8.6 | 0.47 | 1.00 0.05 | 0.99 0.02 | 1.1 | 2.0 | -1.28 | |||||
| HD 8941 | Field | 9.2 | 0.28 | 1.05 0.05 | 0.99 0.02 | 0.8 | 1.7 | -0.07 | |||||
| HD 9472 | Field | 8.9 | 0.38 | 0.99 0.05 | 1.00 0.02 | 0.4 | 3.2 | -0.81 | |||||
| HD 11850 | Field | 8.8 | 0.38 | 1.04 0.05 | 1.01 0.02 | -1.6 | 3.7 | -1.57 | |||||
| HD 12039 | Field | 7.5 | 0.38 | 1.10 0.05 | 1.34 0.02 | 1.7 | 3.9 | -24.80 | Y | Y | |||
| HD 13382 | Field | 8.7 | 0.33 | 1.01 0.05 | 1.03 0.02 | 0.8 | 2.5 | -0.37 | |||||
| HD 13507 | Field | 8.9 | 0.38 | 1.02 0.05 | 0.98 0.02 | 0.9 | 1.6 | -0.40 | |||||
| HD 13531 | Field | 8.7 | 0.40 | 1.00 0.05 | 0.99 0.02 | 0.4 | 1.9 | -1.36 | |||||
| HD 13974 | Field | 9.2 | 0.95 0.05 | 1.01 0.02 | 1.1 | 0.2 | -2.70 | Y | |||||
| HD 15526 | Field | 7.6 | 0.43 | 1.01 0.05 | 0.99 0.03 | -8.6 | 7.6 | -1.59 | |||||
| HD 18940 | Field | 8.9 | 0.36 | 1.03 0.05 | 1.00 0.02 | -0.9 | 2.0 | -0.94 | |||||
| HD 19019 | Field | 9.2 | 0.31 | 0.98 0.05 | 1.01 0.02 | 0.9 | 2.3 | -2.22 | |||||
| HD 19668 | Field | 8.4 | 0.46 | 1.12 0.05 | 1.24 0.02 | -1.2 | 5.6 | -15.91 | Y | Y | |||
| HD 21411 | Field | 8.9 | 0.44 | 0.98 0.05 | 0.99 0.02 | 1.4 | 2.8 | -1.17 | |||||
| HD 22179 | Field | 7.2 | 0.34 | 0.97 0.05 | 1.33 0.03 | 39.5 | 11.7 | -47.54 | Y | Y | Y | ||
| HD 25300 | Field | 8.2 | 0.78 | 1.11 0.05 | 1.01 0.02 | 0.4 | 2.4 | -1.00 | |||||
| HD 26182 | Field | 7.8 | 0.33 | 0.98 0.05 | 0.97 0.03 | 2.4 | 13.2 | -1.44 | |||||
| HD 26990 | Field | 8.9 | 0.40 | 0.97 0.05 | 1.01 0.02 | 2.6 | 2.6 | -0.17 | |||||
| HD 27466 | Field | 9.2 | 0.37 | 0.98 0.05 | 0.98 0.02 | 0.7 | 3.1 | -1.59 | |||||
| HD 28495 | Field | 8.5 | 0.49 | 1.06 0.05 | 1.02 0.02 | -1.7 | 2.5 | -0.25 | |||||
| HD 29231 | Field | 9.2 | 0.44 | 1.02 0.05 | 0.99 0.02 | 1.0 | 2.0 | -0.17 | |||||
| HD 31143 | Field | 9.1 | 0.50 | 1.01 0.05 | 0.99 0.02 | 1.1 | 3.1 | -0.77 | |||||
| HD 31281 | Field | 6.8 | 0.34 | 0.94 0.05 | 1.01 0.03 | 12.0 | 16.8 | -5.18 | Y | ||||
| HD 31392 | Field | 9.1 | 0.48 | 0.99 0.05 | 1.02 0.02 | 20.8 | 2.6 | -4.67 | Y | Y | |||
| HD 31950 | Field | 7.8 | 0.27 | 1.00 0.05 | 1.06 0.03 | -7.3 | 24.1 | -1.68 | |||||
| HD 32850 | Field | 9.1 | 0.49 | 1.03 0.05 | 1.01 0.02 | 0.6 | 2.9 | -0.26 | |||||
| HD 37006 | Field | 8.9 | 0.40 | 1.05 0.05 | 1.01 0.02 | -1.1 | 3.1 | -0.20 | |||||
| HD 37216 | Field | 8.8 | 0.42 | 1.04 0.05 | 0.99 0.02 | 2.2 | 3.0 | -0.53 | |||||
| HD 37572 | Field | 7.8 | 0.56 | 1.06 0.05 | 1.01 0.02 | 1.5 | 2.0 | -2.22 | |||||
| HD 37962 | Field | 9.2 | 0.41 | 1.03 0.05 | 1.01 0.02 | 6.8 | 3.1 | -1.44 | |||||
| HD 38529 | Field | 9.7 | 0.95 0.05 | 0.99 0.02 | 4.6 | 0.8 | -12.99 | Y | Y | ||||
| HD 38949 | Field | 8.3 | 0.31 | 1.03 0.05 | 1.03 0.02 | 3.4 | 3.8 | -4.80 | Y | ||||
| HD 40647 | Field | 8.8 | 0.48 | 1.05 0.05 | 1.00 0.02 | 2.9 | 2.8 | -0.12 | |||||
| HD 43989 | Field | 7.8 | 0.30 | 1.04 0.05 | 1.15 0.02 | 3.5 | 4.9 | -13.83 | Y | Y | |||
| HD 44594 | Field | 9.8 | 0.40 | 1.01 0.05 | 0.97 0.02 | 0.7 | 0.9 | -1.80 | |||||
| HD 45270 | Field | 7.9 | 0.39 | 1.04 0.05 | 1.04 0.02 | 1.2 | 0.8 | -5.46 | Y | ||||
| HD 47875 | Field | 7.8 | 0.47 | 1.07 0.05 | 1.06 0.03 | 0.0 | 3.7 | -0.58 | |||||
| HD 60737 | Field | 8.2 | 0.33 | 1.03 0.05 | 1.06 0.02 | 7.2 | 4.5 | -3.57 | Y | Y | |||
| HD 61005 | Field | 8.1 | 0.45 | 1.11 0.05 | 2.18 0.02 | 303.9 | 22.9 | -90.66 | Y | Y | Y | ||
| HD 61994 | Field | 9.0 | 0.43 | 0.99 0.05 | 0.98 0.02 | 1.2 | 1.2 | -0.24 | |||||
| HD 64324 | Field | 9.1 | 0.35 | 1.00 0.05 | 1.02 0.02 | 2.5 | 3.9 | -0.95 | |||||
| HD 66751 | Field | 9.2 | 0.34 | 0.97 0.05 | 0.98 0.02 | 0.8 | 1.0 | -0.08 | |||||
| HD 69076 | Field | 9.3 | 0.45 | 1.02 0.05 | 1.01 0.02 | 0.2 | 3.9 | -0.05 | |||||
| HD 70516 | Field | 7.9 | 0.37 | 1.02 0.05 | 0.99 0.02 | 3.0 | 2.5 | -0.87 | |||||
| HD 70573 | Field | 8.0 | 0.37 | 0.97 0.05 | 1.02 0.03 | 13.4 | 5.3 | -3.03 | Y | ||||
| HD 71974 | Field | 8.9 | 0.45 | 0.99 0.05 | 1.00 0.02 | 3.2 | 1.5 | -0.79 | |||||
| HD 72687 | Field | 8.4 | 0.34 | 1.06 0.05 | 1.26 0.02 | 2.0 | 5.4 | -26.32 | Y | Y | |||
| HD 73668 | Field | 9.3 | 0.36 | 1.02 0.05 | 1.00 0.02 | 2.7 | 2.7 | -0.16 | |||||
| HD 75302 | Field | 9.1 | 0.40 | 1.01 0.05 | 0.99 0.02 | 0.4 | 2.4 | -0.29 | |||||
| HD 75393 | Field | 8.4 | 0.33 | 1.01 0.05 | 1.00 0.02 | -1.8 | 2.6 | -0.87 | |||||
| HD 76218 | Field | 8.7 | 0.43 | 1.03 0.05 | 0.99 0.02 | -1.4 | 2.7 | -0.24 | |||||
| HD 77407 | Field | 7.5 | 0.36 | 1.03 0.05 | 0.98 0.02 | 2.0 | 1.7 | -1.31 | |||||
| HD 80606 | Field | 9.7 | 0.39 | 0.97 0.03 | 3.6 | 5.3 | |||||||
| HD 85301 | Field | 8.7 | 0.37 | 1.12 0.05 | 1.39 0.02 | 13.4 | 2.6 | -42.12 | Y | Y | Y | ||
| HD 86356 | Field | 7.8 | 0.46 | 0.94 0.05 | 0.99 0.03 | -4.7 | 7.9 | -0.94 | |||||
| HD 88201 | Field | 8.5 | 0.28 | 1.01 0.05 | 0.99 0.02 | -0.4 | 2.6 | -0.88 | |||||
| HD 88742 | Field | 9.3 | 0.37 | 1.02 0.05 | 0.98 0.02 | 1.0 | 1.1 | -0.39 | |||||
| HD 90712 | Field | 8.3 | 0.37 | 1.02 0.05 | 0.99 0.02 | -0.9 | 2.8 | -0.33 | |||||
| HD 90905 | Field | 8.2 | 0.33 | 1.00 0.05 | 1.10 0.02 | 4.5 | 2.4 | -9.23 | Y | Y | |||
| HD 91782 | Field | 8.2 | 0.30 | 1.04 0.05 | 1.03 0.02 | -1.2 | 4.8 | -0.16 | |||||
| HD 91962 | Field | 8.4 | 0.45 | 1.00 0.05 | 0.98 0.02 | -0.1 | 1.4 | -0.73 | |||||
| HD 92788 | Field | 9.7 | 0.41 | 0.98 0.05 | 0.99 0.02 | 2.8 | 2.3 | -0.50 | |||||
| HD 92855 | Field | 8.2 | 0.39 | 1.01 0.05 | 1.00 0.02 | 2.8 | 1.9 | -0.60 | |||||
| HD 95188 | Field | 8.4 | 0.45 | 0.99 0.05 | 1.01 0.02 | 3.6 | 5.6 | -0.37 | |||||
| HD 98553 | Field | 9.2 | 0.35 | 1.01 0.05 | 0.98 0.02 | 1.3 | 2.8 | -0.57 | |||||
| HD 100167 | Field | 9.2 | 0.36 | 1.01 0.05 | 0.99 0.02 | -0.8 | 2.3 | -0.18 | |||||
| HD 101472 | Field | 8.4 | 0.32 | 1.02 0.05 | 1.00 0.02 | -0.2 | 3.1 | -0.92 | |||||
| HD 101959 | Field | 9.2 | 0.35 | 1.01 0.05 | 0.99 0.02 | 2.2 | 1.9 | -1.82 | |||||
| HD 102071 | Field | 9.3 | 0.49 | 1.02 0.05 | 1.00 0.02 | 3.2 | 2.5 | -0.24 | |||||
| HD 103432 | Field | 9.3 | 0.41 | 0.97 0.05 | 0.99 0.02 | 4.5 | 5.3 | -0.81 | |||||
| HD 104467 | Field | 6.7 | 0.39 | 1.04 0.05 | 1.03 0.02 | -1.3 | 3.3 | -2.70 | |||||
| HD 104576 | Field | 8.2 | 0.46 | 0.97 0.05 | 1.01 0.02 | 4.0 | 4.6 | -1.77 | |||||
| HD 104860 | Field | 7.6 | 0.32 | 1.03 0.05 | 1.09 0.02 | 92.2 | 7.7 | -16.50 | Y | Y | Y | ||
| HD 105631 | Field | 9.2 | 0.43 | 1.00 0.05 | 0.99 0.02 | 0.2 | 1.7 | -0.12 | |||||
| HD 106156 | Field | 9.3 | 0.45 | 1.01 0.05 | 0.99 0.02 | 5.4 | 3.4 | -1.31 | |||||
| HD 106252 | Field | 9.5 | 0.37 | 1.00 0.05 | 1.00 0.02 | 5.0 | 2.9 | -1.54 | |||||
| HD 106772 | Field | 8.8 | 0.33 | 1.00 0.05 | 1.01 0.02 | -1.6 | 2.4 | -0.18 | |||||
| HD 107146 | Field | 8.2 | 0.33 | 1.01 0.05 | 1.38 0.02 | 142.4 | 10.6 | -66.32 | Y | Y | Y | ||
| HD 107441 | LCC | 7.2 | 0.42 | 0.99 0.05 | 1.05 0.03 | 2.1 | 9.6 | -2.00 | |||||
| HD 108799 | Field | 8.3 | 0.41 | 1.03 0.05 | 0.99 0.02 | 0.5 | 1.1 | -0.35 | |||||
| HD 108944 | Field | 8.2 | 0.27 | 1.04 0.05 | 1.00 0.02 | 0.5 | 2.7 | -1.37 | |||||
| HD 111170 | LCC | 7.2 | 0.47 | 0.96 0.05 | 1.01 0.03 | -4.5 | 8.3 | -1.30 | |||||
| HD 112196 | Field | 7.9 | 0.33 | 1.02 0.05 | 0.98 0.02 | 0.7 | 1.9 | -0.91 | |||||
| HD 115043 | Field | 8.7 | 0.34 | 0.99 0.05 | 0.99 0.02 | -0.1 | 1.3 | -1.14 | |||||
| HD 116099 | LCC | 7.2 | 0.39 | 1.04 0.05 | 1.15 0.03 | 10.5 | 10.2 | -13.96 | Y | Y | |||
| HD 117524 | LCC | 7.2 | 0.47 | 1.02 0.05 | 0.99 0.03 | -15.4 | 15.1 | -0.64 | |||||
| HD 119269 | LCC | 7.2 | 0.36 | 1.02 0.05 | 1.02 0.03 | 27.4 | 13.5 | -6.89 | Y | ||||
| HD 120812 | UCL | 7.2 | 0.40 | 1.00 0.05 | 1.00 0.03 | -15.1 | 13.4 | -0.66 | |||||
| HD 121320 | Field | 9.3 | 0.35 | 0.98 0.05 | 0.97 0.02 | 0.8 | 3.8 | -0.10 | |||||
| HD 121504 | Field | 9.3 | 0.43 | 1.04 0.05 | 0.99 0.02 | 9.9 | 6.8 | -2.30 | |||||
| HD 122652 | Field | 9.3 | 0.28 | 1.03 0.05 | 1.10 0.02 | 24.0 | 3.2 | -7.98 | Y | Y | Y | ||
| HD 126670 | UCL | 7.2 | 0.46 | 1.00 0.05 | 1.05 0.03 | -1.3 | 9.0 | -2.05 | |||||
| HD 128242 | UCL | 7.2 | 0.38 | 1.01 0.05 | 1.01 0.03 | -9.4 | 8.7 | -1.27 | |||||
| HD 129333 | Field | 7.9 | 0.40 | 1.01 0.05 | 1.02 0.02 | 1.8 | 1.8 | -0.31 | |||||
| HD 132173 | Field | 8.2 | 0.36 | 1.04 0.05 | 1.04 0.02 | -0.3 | 4.0 | -3.00 | Y | ||||
| HD 133295 | Field | 8.5 | 0.34 | 1.04 0.05 | 1.01 0.02 | 3.3 | 3.4 | -0.29 | |||||
| HD 133938 | UCL | 7.2 | 0.43 | 0.94 0.05 | 0.97 0.03 | -13.3 | 30.4 | -0.79 | |||||
| HD 135363 | Field | 7.8 | 0.64 | 1.06 0.05 | 1.04 0.02 | 0.1 | 2.4 | -3.43 | Y | ||||
| HD 136923 | Field | 9.3 | 0.42 | 1.00 0.05 | 0.98 0.02 | 1.9 | 1.3 | -1.96 | |||||
| HD 138004 | Field | 9.3 | 0.36 | 1.01 0.05 | 0.98 0.02 | 0.5 | 2.2 | -0.84 | |||||
| HD 139498 | UCL | 7.2 | 0.45 | 0.94 0.05 | 1.01 0.03 | -8.7 | 18.4 | -1.46 | |||||
| HD 139813 | Field | 8.3 | 0.42 | 0.98 0.02 | 3.0 | 1.5 | |||||||
| HD 140374 | UCL | 7.2 | 0.45 | 0.88 0.05 | 0.95 0.03 | -19.0 | 18.1 | -7.55 | |||||
| HD 141521 | UCL | 7.2 | 0.47 | 0.98 0.05 | 1.01 0.03 | -14.7 | 17.3 | -1.66 | |||||
| HD 141937 | Field | 9.4 | 0.36 | 1.01 0.05 | 1.00 0.02 | -0.7 | 3.0 | -1.08 | |||||
| HD 141943 | Field | 7.2 | 0.40 | 1.03 0.05 | 1.26 0.02 | 15.9 | 6.5 | -39.34 | Y | Y | |||
| HD 142229 | Field | 8.8 | 0.36 | 1.06 0.05 | 1.03 0.02 | 1.5 | 4.5 | -0.09 | |||||
| HD 142361 | USco | 6.7 | 0.46 | 1.01 0.05 | 1.05 0.02 | 9.2 | 14.7 | -2.15 | |||||
| HD 143358 | UCL | 7.2 | 0.39 | 1.01 0.05 | 1.08 0.03 | 4.0 | 28.9 | -7.24 | Y | ||||
| HD 145229 | Field | 8.8 | 0.33 | 0.99 0.05 | 1.08 0.02 | 20.7 | 2.8 | -15.17 | Y | Y | Y | ||
| HD 146516 | USco | 6.7 | 0.41 | 0.99 0.05 | 1.02 0.03 | 6.7 | 18.8 | -0.01 | |||||
| HD 150554 | Field | 9.4 | 1.01 0.05 | 1.00 0.02 | -3.0 | 3.1 | -0.27 | ||||||
| HD 150706 | Field | 8.8 | 0.33 | 1.02 0.05 | 1.03 0.02 | 8.7 | 1.8 | -4.38 | Y | Y | |||
| HD 151798 | Field | 7.8 | 0.34 | 0.99 0.05 | 0.99 0.02 | -2.5 | 8.3 | -0.34 | |||||
| HD 152555 | Field | 8.1 | 0.34 | 0.95 0.05 | 0.99 0.02 | -0.2 | 4.2 | -0.36 | |||||
| HD 153458 | Field | 9.2 | 0.35 | 0.95 0.05 | 1.02 0.02 | -2.7 | 5.8 | -1.74 | |||||
| HD 154417 | Field | 9.1 | 0.94 0.05 | 1.00 0.02 | 0.5 | 0.8 | -2.22 | ||||||
| HD 157664 | Field | 9.6 | 0.25 | 1.02 0.05 | 1.00 0.02 | 1.9 | 4.9 | -0.84 | |||||
| HD 159222 | Field | 9.3 | 0.34 | 0.99 0.05 | 0.98 0.02 | 0.8 | 1.0 | -1.77 | |||||
| HD 161897 | Field | 9.3 | 0.37 | 1.04 0.05 | 0.98 0.02 | -0.6 | 3.5 | -1.15 | |||||
| HD 167389 | Field | 9.3 | 0.31 | 1.02 0.05 | 0.99 0.02 | -1.3 | 2.8 | -0.58 | |||||
| HD 170778 | Field | 8.6 | 0.36 | 1.05 0.05 | 1.00 0.02 | 1.3 | 2.1 | -0.06 | |||||
| HD 172649 | Field | 8.2 | 0.25 | 1.02 0.05 | 1.01 0.02 | -0.5 | 3.0 | -0.78 | |||||
| HD 174656 | CrA | 6.5 | 0.48 | 1.01 0.05 | 1.04 0.03 | 1.5 | 4.2 | -1.18 | |||||
| HD 179949 | Field | 9.3 | 0.36 | 0.94 0.05 | 1.00 0.02 | -0.6 | 1.3 | -0.12 | |||||
| HD 183216 | Field | 9.1 | 0.31 | 0.97 0.05 | 1.09 0.02 | 5.8 | 2.6 | -5.38 | Y | Y | |||
| HD 187897 | Field | 9.1 | 0.38 | 0.94 0.05 | 1.04 0.02 | 14.9 | 2.3 | -0.74 | Y | ||||
| HD 190228 | Field | 10.0 | 0.47 | 1.03 0.05 | 1.00 0.02 | 2.0 | 4.5 | -0.09 | |||||
| HD 193017 | Field | 9.2 | 0.29 | 1.01 0.05 | 1.00 0.02 | 2.0 | 2.9 | -0.61 | |||||
| HD 195034 | Field | 9.3 | 0.32 | 1.05 0.05 | 0.98 0.02 | 0.4 | 1.8 | -2.05 | |||||
| HD 199019 | Field | 8.4 | 0.39 | 1.06 0.05 | 1.02 0.02 | 4.5 | 3.9 | -2.00 | |||||
| HD 199143 | Field | 7.2 | 0.40 | 1.08 0.05 | 1.04 0.02 | 2.4 | 2.8 | -1.31 | |||||
| HD 199598 | Field | 9.2 | 0.31 | 1.02 0.05 | 1.00 0.02 | 1.4 | 1.6 | -0.50 | |||||
| HD 200746 | Field | 8.6 | 0.40 | 1.07 0.05 | 1.01 0.02 | 5.1 | 3.6 | -1.00 | |||||
| HD 201219 | Field | 9.0 | 0.40 | 1.06 0.05 | 1.08 0.02 | 19.1 | 3.5 | -6.46 | Y | Y | Y | ||
| HD 201989 | Field | 9.0 | 0.41 | 1.04 0.05 | 0.99 0.02 | -0.0 | 2.4 | -1.13 | |||||
| HD 202108 | Field | 9.2 | 0.39 | 1.00 0.05 | 0.99 0.02 | -0.1 | 2.4 | -1.54 | |||||
| HD 203030 | Field | 8.3 | 0.41 | 1.06 0.05 | 1.01 0.02 | 3.9 | 4.4 | -0.18 | |||||
| HD 204277 | Field | 8.7 | 0.26 | 1.03 0.05 | 1.04 0.02 | 5.8 | 2.1 | -7.13 | Y | ||||
| HD 205905 | Field | 9.1 | 0.37 | 1.01 0.05 | 0.98 0.02 | 2.9 | 1.5 | -0.21 | |||||
| HD 206374 | Field | 9.2 | 0.37 | 0.96 0.05 | 1.00 0.02 | 4.8 | 1.8 | -2.40 | |||||
| HD 209393 | Field | 8.6 | 0.39 | 0.94 0.05 | 1.00 0.02 | -1.0 | 3.8 | -0.41 | |||||
| HD 209779 | Field | 8.6 | 0.44 | 1.05 0.05 | 1.00 0.02 | 2.8 | 3.2 | -0.45 | |||||
| HD 212291 | Field | 9.3 | 0.37 | 0.99 0.05 | 0.98 0.02 | 3.2 | 3.0 | -0.61 | |||||
| HD 216275 | Field | 9.3 | 0.31 | 0.99 0.05 | 0.99 0.02 | 1.9 | 2.8 | -1.41 | |||||
| HD 217343 | Field | 7.6 | 0.35 | 1.06 0.05 | 1.03 0.02 | -0.2 | 2.7 | -0.88 | |||||
| HD 219498 | Field | 8.6 | 0.38 | 1.01 0.05 | 1.27 0.03 | 25.4 | 4.5 | -34.85 | Y | Y | Y | ||
| HD 224873 | Field | 8.5 | 0.45 | 1.02 0.05 | 0.98 0.02 | -3.9 | 4.9 | -0.51 | |||||
| HD 245567 | Field | 6.6 | 0.41 | 0.88 0.05 | 0.96 0.03 | -32.4 | 21.1 | -3.35 | |||||
| HD 279788 | Field | 6.6 | 0.41 | 0.94 0.05 | 1.09 0.03 | 7.4 | 32.8 | -1.92 | |||||
| HD 281691 | Field | 7.1 | 0.53 | 0.99 0.05 | 1.12 0.03 | -4.7 | 15.5 | -3.30 | Y | Y | |||
| HD 282346 | Field | 8.0 | 0.59 | 0.99 0.05 | 0.99 0.03 | -22.6 | 11.6 | -1.02 | |||||
| HD 284135 | Field | 6.8 | 0.35 | 0.97 0.05 | 1.01 0.03 | 11.4 | 8.5 | -5.91 | Y | ||||
| HD 284266 | Field | 7.2 | 0.54 | 0.98 0.05 | 1.04 0.03 | -9.1 | 39.6 | -1.06 | |||||
| HD 285281 | Field | 7.0 | 0.54 | 0.95 0.05 | 1.02 0.03 | -2.2 | 5.5 | -0.99 | |||||
| HD 285372 | Field | 6.8 | 0.63 | 1.02 0.05 | 0.98 0.03 | -16.1 | 34.0 | -3.00 | Y | ||||
| HD 285751 | Field | 6.8 | 0.55 | 0.96 0.05 | 1.05 0.03 | -8.1 | 41.4 | -3.00 | |||||
| HD 285840 | Field | 7.8 | 0.54 | 0.97 0.05 | 1.01 0.03 | -10.3 | 25.0 | -1.52 | |||||
| HD 286179 | Field | 7.2 | 0.38 | 0.88 0.05 | 0.97 0.03 | -12.7 | 25.8 | -0.21 | |||||
| HD 286264 | Field | 7.3 | 0.59 | 0.94 0.05 | 1.03 0.03 | -8.4 | 9.9 | -1.74 | |||||
| HE 350 | Per | 7.9 | 0.36 | 0.97 0.05 | 1.05 0.03 | 36.3 | 59.5 | -0.47 | |||||
| HE 373 | Per | 7.9 | 0.43 | 0.93 0.05 | 1.00 0.03 | -20.3 | 30.6 | -9.67 | |||||
| HE 389 | Per | 7.9 | 0.33 | 0.95 0.05 | 0.97 0.03 | -1.0 | 77.7 | -0.97 | |||||
| HE 622 | Per | 7.9 | 0.46 | 0.88 0.05 | 0.99 0.03 | 14.2 | 82.0 | -2.22 | |||||
| HE 696 | Per | 7.9 | 0.43 | 0.85 0.05 | 0.98 0.03 | -175.5 | 96.0 | -4.98 | |||||
| HE 699 | Per | 7.9 | 0.43 | 0.99 0.03 | 26.2 | 37.8 | |||||||
| HE 750 | Per | 7.9 | 0.24 | 0.92 0.05 | 1.18 0.03 | -78.0 | 57.4 | -4.07 | Y | Y | |||
| HE 767 | Per | 7.9 | 0.27 | 0.91 0.05 | 0.99 0.03 | -0.2 | 37.0 | -1.66 | |||||
| HE 848 | Per | 7.9 | 0.24 | 0.97 0.05 | 1.49 0.03 | -24.2 | 35.9 | -18.77 | Y | Y | |||
| HE 935 | Per | 7.9 | 0.35 | 0.97 0.05 | 1.00 0.03 | -24.6 | 25.4 | -0.19 | |||||
| HE 1101 | Per | 7.9 | 0.42 | 0.88 0.05 | 0.98 0.03 | -59.4 | 63.4 | -3.21 | |||||
| HE 1234 | Per | 7.9 | 0.38 | 0.81 0.05 | 0.97 0.03 | -45.0 | 80.0 | -5.18 | |||||
| HII 120 | Pleiades | 8.1 | 0.40 | 1.02 0.05 | 1.00 0.03 | -59.8 | 86.2 | -8.37 | |||||
| HII 152 | Pleiades | 8.1 | 0.41 | 1.09 0.05 | 1.34 0.03 | 64.6 | 73.8 | -8.90 | Y | Y | |||
| HII 173 | Pleiades | 8.1 | 0.48 | 0.94 0.05 | 1.00 0.03 | -20.1 | 44.4 | -0.45 | |||||
| HII 174 | Pleiades | 8.1 | 0.56 | 0.92 0.05 | 1.01 0.03 | 31.0 | 73.7 | -14.54 | |||||
| HII 250 | Pleiades | 8.1 | 0.42 | 1.01 0.05 | 1.13 0.03 | 21.5 | 60.9 | -3.04 | Y | Y | |||
| HII 314 | Pleiades | 8.1 | 0.42 | 1.03 0.05 | 1.03 0.03 | 13.9 | 62.1 | -2.30 | |||||
| HII 514 | Pleiades | 8.1 | 0.37 | 1.04 0.05 | 1.23 0.03 | 48.8 | 46.1 | -11.53 | Y | Y | |||
| HII 1015 | Pleiades | 8.1 | 0.35 | 1.00 0.03 | -115.3 | 53.8 | |||||||
| HII 1101 | Pleiades | 8.1 | 0.34 | 1.12 0.05 | 1.52 0.03 | 68.3 | 53.7 | -30.26 | Y | Y | |||
| HII 1182 | Pleiades | 8.1 | 0.36 | 1.04 0.05 | 1.01 0.03 | -18.4 | 24.3 | -0.80 | |||||
| HII 1200 | Pleiades | 8.1 | 0.30 | 0.99 0.05 | 1.14 0.03 | -69.5 | 48.9 | -7.26 | Y | Y | |||
| HII 1776 | Pleiades | 8.1 | 0.41 | 0.90 0.05 | 1.02 0.03 | -33.4 | 61.3 | -15.65 | |||||
| HII 2147 | Pleiades | 8.1 | 0.54 | 1.00 0.05 | 1.01 0.03 | -14.4 | 18.2 | -1.19 | |||||
| HII 2278 | Pleiades | 8.1 | 0.46 | 0.87 0.05 | 1.00 0.03 | -56.6 | 38.0 | -3.41 | |||||
| HII 2506 | Pleiades | 8.1 | 0.33 | 0.96 0.05 | 1.02 0.03 | 23.3 | 19.1 | -0.66 | |||||
| HII 2644 | Pleiades | 8.1 | 0.42 | 0.93 0.05 | 0.99 0.03 | 24.9 | 43.0 | -0.97 | |||||
| HII 2786 | Pleiades | 8.1 | 0.31 | 0.96 0.05 | 0.98 0.03 | 8.4 | 41.2 | -0.98 | |||||
| HII 2881 | Pleiades | 8.1 | 0.60 | 0.95 0.03 | 40.8 | 29.8 | |||||||
| HII 3097 | Pleiades | 8.1 | 0.38 | 0.97 0.05 | 1.02 0.03 | -29.7 | 26.0 | -0.63 | |||||
| HII 3179 | Pleiades | 8.1 | 0.33 | 0.99 0.05 | 1.00 0.03 | -12.9 | 13.7 | -0.49 | |||||
| HIP 6276 | Field | 8.5 | 0.48 | 1.04 0.05 | 1.10 0.02 | 7.2 | 5.7 | -11.45 | Y | Y | |||
| HIP 42491 | Field | 9.2 | 0.45 | 0.99 0.02 | -4.2 | 6.2 | |||||||
| HIP 59154 | Field | 8.6 | 0.58 | 1.03 0.05 | 1.03 0.02 | 0.7 | 4.4 | -1.10 | |||||
| HIP 76477 | UCL | 7.2 | 0.60 | 0.93 0.05 | 1.01 0.03 | -1.9 | 19.2 | -0.35 | |||||
| MML 1 | LCC | 7.2 | 0.59 | 0.99 0.05 | 1.07 0.03 | 4.9 | 9.0 | -1.43 | |||||
| MML 8 | LCC | 7.2 | 0.45 | 1.03 0.05 | 1.68 0.03 | 35.7 | 26.0 | -38.39 | Y | Y | |||
| MML 9 | LCC | 7.2 | 0.48 | 1.04 0.05 | 1.05 0.03 | -12.8 | 13.8 | -10.02 | Y | ||||
| MML 17 | LCC | 7.2 | 0.35 | 0.99 0.05 | 1.60 0.03 | 26.9 | 11.5 | -43.54 | Y | Y | |||
| MML 18 | LCC | 7.2 | 0.54 | 0.94 0.05 | 0.97 0.03 | -16.9 | 26.2 | -3.09 | |||||
| MML 26 | LCC | 7.2 | 0.51 | 0.95 0.05 | 0.98 0.03 | -4.0 | 20.0 | -0.09 | |||||
| MML 28 | LCC | 7.2 | 0.65 | 1.00 0.05 | 1.39 0.03 | 37.4 | 37.4 | -43.71 | Y | Y | |||
| MML 32 | LCC | 7.2 | 0.36 | 0.94 0.05 | 1.01 0.03 | 16.2 | 30.8 | -0.22 | |||||
| MML 36 | UCL | 7.2 | 0.51 | 1.03 0.05 | 1.49 0.03 | 6.1 | 6.5 | -50.52 | Y | Y | |||
| MML 38 | UCL | 7.2 | 0.52 | 1.02 0.05 | 1.04 0.03 | -3.1 | 18.6 | -3.00 | Y | ||||
| MML 40 | UCL | 7.2 | 0.50 | 1.03 0.05 | 1.00 0.03 | -8.7 | 12.2 | -0.75 | |||||
| MML 43 | UCL | 7.2 | 0.46 | 1.02 0.05 | 1.12 0.03 | -22.1 | 23.4 | -2.70 | Y | Y | |||
| MML 51 | UCL | 7.2 | 0.64 | 1.00 0.05 | 1.00 0.03 | 4.5 | 8.4 | -0.17 | |||||
| MML 57 | UCL | 7.2 | 0.37 | 1.03 0.05 | 1.09 0.03 | 22.4 | 37.0 | -9.90 | Y | ||||
| PDS 66 | LCC | 7.2 | 0.78 | 8.41 0.10 | 32.70 0.02 | 265.2 | 19.5 | -106.27 | Y | Y | Y | Y | Y |
| PZ99 J155847.8-175800 | USco | 6.7 | 0.65 | 0.96 0.05 | 1.45 0.03 | -47.9 | 32.6 | -30.41 | Y | Y | |||
| PZ99 J160814.7-190833 | USco | 6.7 | 0.56 | 0.93 0.05 | 0.98 0.03 | 15.6 | 32.2 | -0.22 | |||||
| PZ99 J161318.6-221248 | USco | 6.7 | 0.54 | 0.90 0.05 | 1.01 0.03 | -20.8 | 12.2 | -1.30 | |||||
| PZ99 J161329.3-231106 | USco | 6.7 | 0.54 | 0.97 0.05 | 1.02 0.03 | 29.2 | 25.6 | -0.86 | |||||
| PZ99 J161402.1-230101 | USco | 6.7 | 0.39 | 0.96 0.05 | 1.07 0.03 | -52.7 | 35.1 | -3.00 | Y | ||||
| PZ99 J161411.0-230536 | USco | 6.7 | 0.57 | 3.73 0.05 | 7.39 0.02 | 20.1 | 3.0 | -126.65 | Y | Y | Y | Y | Y |
| PZ99 J161459.2-275023 | USco | 6.7 | 0.49 | 1.04 0.05 | 1.58 0.03 | 86.3 | 81.3 | -41.39 | Y | Y | |||
| PZ99 J161618.0-233947 | USco | 6.7 | 0.50 | 1.03 0.05 | 1.11 0.03 | -28.6 | 27.2 | -7.04 | Y | Y | |||
| QT And | Field | 7.8 | 0.66 | 0.99 0.05 | 1.02 0.03 | -8.6 | 6.0 | -1.72 | |||||
| R3 | IC 2602 | 7.7 | 0.51 | 1.04 0.05 | 0.96 0.03 | -62.4 | 53.6 | -1.46 | |||||
| R45 | IC 2602 | 7.7 | 0.34 | 1.11 0.03 | 12.6 | 117.4 | |||||||
| R83 | IC 2602 | 7.7 | 0.38 | 0.98 0.05 | 0.97 0.03 | -125.6 | 65.8 | -0.51 | |||||
| RE J0137+18A | Field | 6.8 | 0.76 | 1.05 0.05 | 0.95 0.02 | 1.4 | 2.3 | -0.08 | |||||
| RE J0723+20 | Field | 8.1 | 0.76 | 1.05 0.05 | 1.00 0.02 | 0.6 | 3.0 | -0.92 | |||||
| RX J0258.4+2947 | Field | 8.0 | 0.51 | 0.89 0.05 | 0.98 0.03 | -25.3 | 19.2 | -1.74 | |||||
| RX J0329.1+0118 | Field | 7.8 | 0.32 | 0.93 0.05 | 0.98 0.03 | 11.2 | 25.9 | -1.41 | |||||
| RX J0331.1+0713 | Field | 6.4 | 0.65 | 0.89 0.05 | 0.97 0.03 | -8.8 | 9.8 | -3.26 | |||||
| RX J0354.4+0535 | Field | 8.2 | 0.34 | 0.98 0.05 | 1.09 0.03 | -24.0 | 16.7 | -2.40 | |||||
| RX J0357.3+1258 | Field | 7.8 | 0.44 | 1.01 0.05 | 1.04 0.03 | -14.7 | 25.6 | -1.68 | |||||
| RX J0434.3+0226 | Field | 7.8 | 0.70 | 0.95 0.05 | 0.94 0.03 | -38.0 | 26.3 | -1.17 | |||||
| RX J0442.5+0906 | Field | 7.8 | 0.45 | 0.95 0.05 | 0.97 0.03 | 6.4 | 23.1 | -0.37 | |||||
| RX J0849.2-7735 | Field | 8.2 | 0.60 | 1.03 0.05 | 1.03 0.02 | 0.7 | 1.9 | -1.04 | |||||
| RX J0850.1-7554 | Field | 7.8 | 0.50 | 1.02 0.05 | 1.03 0.03 | 11.6 | 12.4 | -0.29 | |||||
| RX J0853.1-8244 | Field | 8.6 | 0.59 | 0.97 0.05 | 1.01 0.03 | -24.7 | 15.3 | -0.23 | |||||
| RX J0917.2-7744 | Field | 7.8 | 0.44 | 1.01 0.05 | 0.96 0.03 | 12.0 | 12.5 | -0.16 | |||||
| RX J1111.7-7620 | Field | 6.7 | 1.13 | 3.72 0.05 | 9.49 0.02 | 84.2 | 6.9 | -103.16 | Y | Y | Y | Y | Y |
| RX J1140.3-8321 | Field | 7.8 | 0.56 | 0.87 0.05 | 0.95 0.03 | -5.9 | 14.8 | -4.72 | |||||
| RX J1203.7-8129 | Field | 8.2 | 0.55 | 1.02 0.05 | 1.01 0.03 | 12.2 | 22.5 | -0.17 | |||||
| RX J1209.8-7344 | Field | 8.4 | 0.56 | 0.91 0.05 | 0.99 0.03 | -8.7 | 9.9 | -0.11 | |||||
| RX J1220.6-7539 | Field | 7.8 | 0.55 | 0.98 0.05 | 0.99 0.03 | -20.9 | 7.4 | -1.39 | |||||
| RX J1225.3-7857 | Field | 8.2 | 0.49 | 0.97 0.05 | 0.98 0.03 | -2.8 | 11.7 | -0.48 | |||||
| RX J1450.4-3507 | UCL | 7.2 | 0.55 | 1.02 0.05 | 0.98 0.03 | -7.0 | 7.6 | -0.63 | |||||
| RX J1457.3-3613 | UCL | 7.2 | 0.42 | 0.96 0.05 | 1.04 0.03 | -2.8 | 12.3 | -1.01 | |||||
| RX J1458.6-3541 | UCL | 7.2 | 0.66 | 1.02 0.05 | 0.99 0.03 | 11.9 | 6.7 | -0.45 | |||||
| RX J1500.8-4331 | UCL | 7.2 | 0.53 | 0.92 0.05 | 0.99 0.03 | -35.2 | 28.9 | -0.63 | |||||
| RX J1507.2-3505 | UCL | 7.2 | 0.51 | 0.97 0.05 | 1.06 0.03 | -0.2 | 15.1 | -0.56 | |||||
| RX J1518.4-3738 | UCL | 7.2 | 0.51 | 0.94 0.05 | 1.02 0.03 | -4.8 | 15.9 | -0.77 | |||||
| RX J1531.3-3329 | Field | 8.0 | 0.56 | 0.91 0.05 | 0.95 0.03 | 44.9 | 47.5 | -2.52 | |||||
| RX J1541.1-2656 | USco | 6.7 | 0.47 | 0.96 0.05 | 1.00 0.03 | -153.7 | 56.1 | -1.77 | |||||
| RX J1544.0-3311 | UCL | 7.2 | 0.58 | 1.04 0.03 | -54.1 | 29.3 | |||||||
| RX J1545.9-4222 | UCL | 7.2 | 0.64 | 0.92 0.05 | 1.01 0.03 | -44.0 | 20.1 | -0.40 | |||||
| RX J1600.6-2159 | USco | 6.7 | 0.52 | 0.94 0.05 | 1.15 0.03 | 24.5 | 38.9 | -10.02 | Y | Y | |||
| RX J1839.0-3726 | CrA | 7.2 | 0.49 | 0.94 0.05 | 1.08 0.03 | -23.0 | 21.7 | -0.99 | |||||
| RX J1841.8-3525 | CrA | 7.2 | 0.50 | 0.98 0.05 | 1.03 0.03 | -3.0 | 9.7 | -1.21 | |||||
| RX J1842.9-3532 | CrA | 6.6 | 1.16 | 3.95 0.05 | 17.94 0.02 | 429.3 | 32.0 | -71.22 | Y | Y | Y | Y | Y |
| RX J1844.3-3541 | CrA | 6.2 | 0.67 | 1.01 0.05 | 0.97 0.03 | -42.8 | 15.9 | -2.30 | |||||
| RX J1852.3-3700 | CrA | 6.8 | 0.61 | 11.09 0.34 | 124.31 0.03 | 3281.9 | 259.6 | -116.17 | Y | Y | Y | Y | Y |
| RX J1917.4-3756 | CrA | 6.8 | 0.67 | 0.95 0.05 | 1.02 0.03 | 2.2 | 7.2 | -1.10 | |||||
| RX J2313.0+2345 | Field | 7.0 | 0.33 | 1.02 0.05 | 0.96 0.03 | -10.7 | 14.1 | -1.28 | |||||
| SAO 150676 | Field | 7.8 | 0.37 | 1.01 0.05 | 1.06 0.03 | 2.4 | 4.8 | -9.57 | Y | ||||
| SAO 178272 | Field | 8.0 | 0.64 | 1.00 0.05 | 1.02 0.03 | 1.6 | 3.7 | -3.67 | Y | ||||
| ScoPMS 21 | USco | 6.7 | 0.64 | 0.93 0.05 | 1.04 0.03 | -21.9 | 70.2 | -2.52 | |||||
| ScoPMS 27 | USco | 6.7 | 0.66 | 0.94 0.05 | 1.01 0.03 | 12.8 | 20.0 | -0.55 | |||||
| ScoPMS 52 | USco | 6.7 | 0.57 | 0.99 0.03 | 34.9 | 24.1 | |||||||
| ScoPMS 214 | USco | 6.7 | 0.64 | 1.07 0.05 | 1.17 0.03 | 20.6 | 21.1 | -16.41 | Y | Y | |||
| V343 Nor | Field | 7.1 | 0.53 | 1.00 0.05 | 1.06 0.02 | -0.3 | 10.6 | -0.16 | |||||
| V383 Lac | Field | 7.8 | 0.53 | 0.99 0.05 | 1.06 0.02 | 3.8 | 4.2 | -0.32 | |||||
| vB 1 | Hyades | 8.8 | 0.30 | 1.01 0.05 | 0.98 0.02 | 4.4 | 3.8 | -0.71 | |||||
| vB 39 | Hyades | 8.8 | 0.37 | 1.02 0.05 | 1.02 0.02 | -1.4 | 4.0 | -0.53 | |||||
| vB 49 | Hyades | 8.8 | 0.28 | 1.00 0.05 | 0.99 0.02 | -3.9 | 5.1 | -0.09 | |||||
| vB 52 | Hyades | 8.8 | 0.36 | 1.02 0.05 | 1.01 0.02 | 0.3 | 4.4 | -0.08 | |||||
| vB 63 | Hyades | 8.8 | 0.41 | 1.01 0.05 | 1.01 0.02 | 1.4 | 5.0 | -0.52 | |||||
| vB 64 | Hyades | 8.8 | 0.35 | 0.99 0.05 | 1.00 0.02 | -2.4 | 6.4 | -0.53 | |||||
| vB 66 | Hyades | 8.8 | 0.27 | 1.04 0.05 | 1.01 0.02 | 3.9 | 4.3 | -0.42 | |||||
| vB 73 | Hyades | 8.8 | 0.29 | 1.01 0.05 | 1.02 0.02 | -3.9 | 4.9 | -0.91 | |||||
| vB 79 | Hyades | 8.8 | 0.47 | 0.73 0.91 | 0.99 0.03 | -6.4 | 6.6 | -0.32 | |||||
| vB 88 | Hyades | 8.8 | 0.28 | 1.02 0.05 | 1.02 0.02 | -5.6 | 6.2 | -0.66 | |||||
| vB 91 | Hyades | 8.8 | 0.52 | 1.00 0.05 | 1.01 0.02 | -5.9 | 8.0 | -0.07 | |||||
| vB 92 | Hyades | 8.8 | 0.38 | 0.98 0.05 | 0.99 0.02 | -1.9 | 10.4 | -0.07 | |||||
| vB 93 | Hyades | 8.8 | 0.49 | 1.00 0.05 | 0.99 0.03 | 8.2 | 9.1 | -0.94 | |||||
| vB 96 | Hyades | 8.8 | 0.52 | 0.99 0.05 | 0.99 0.02 | -6.7 | 6.1 | -0.04 | |||||
| vB 97 | Hyades | 8.8 | 0.30 | 1.01 0.05 | 1.01 0.02 | -2.6 | 5.8 | -0.96 | |||||
| vB 99 | Hyades | 8.8 | 0.49 | 0.99 0.05 | 1.00 0.03 | -5.3 | 13.7 | -0.79 | |||||
| vB 106 | Hyades | 8.8 | 0.37 | 1.02 0.05 | 1.01 0.02 | 4.9 | 5.5 | -1.15 | |||||
| vB 142 | Hyades | 8.8 | 1.02 0.05 | 0.99 0.02 | 1.4 | 7.6 | -1.48 | ||||||
| vB 143 | Hyades | 8.8 | 0.26 | 0.99 0.05 | 1.00 0.02 | -2.8 | 6.6 | -0.86 | |||||
| vB 176 | Hyades | 8.8 | 0.55 | 1.03 0.05 | 0.99 0.02 | -0.4 | 4.6 | -3.17 | |||||
| vB 180 | Hyades | 8.8 | 0.48 | 1.06 0.05 | 1.00 0.03 | 2.1 | 6.3 | -0.38 | |||||
| vB 183 | Hyades | 8.8 | 0.51 | 0.98 0.05 | 1.00 0.03 | -15.3 | 16.3 | -3.04 | |||||
| W79 | IC 2602 | 7.7 | 0.46 | 1.04 0.05 | 1.22 0.03 | 1.4 | 114.5 | -1.24 | |||||
| Age Range | Mean Age | Number of Stars | Excess Fraction | |
|---|---|---|---|---|
| (Myr) | (Myr) | Excess | Total | |
| 10 | 5 | 6 | 30 | 0.20 |
| 10-30 | 16 | 9 | 48 | 0.19 |
| 30-100 | 59 | 5 | 59 | 0.085 |
| 100-300 | 150 | 10 | 60 | 0.17 |
| 300-1000 | 560 | 2 | 55 | 0.036 |
| 1000 | 1800 | 1 | 57 | 0.018 |


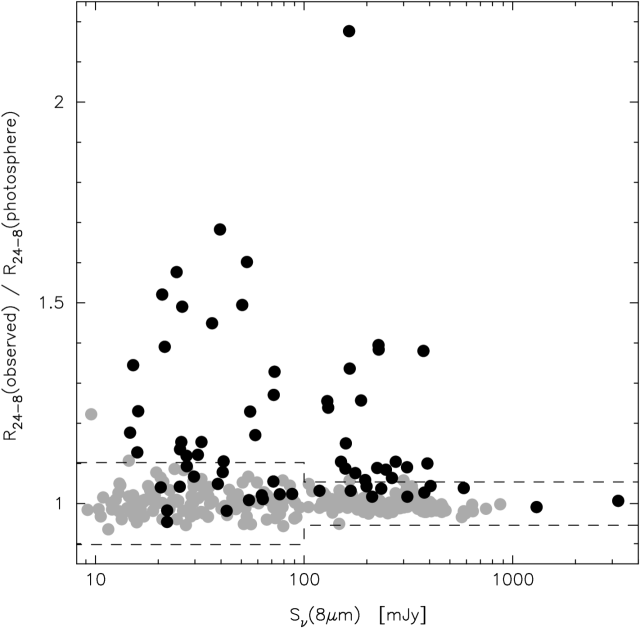
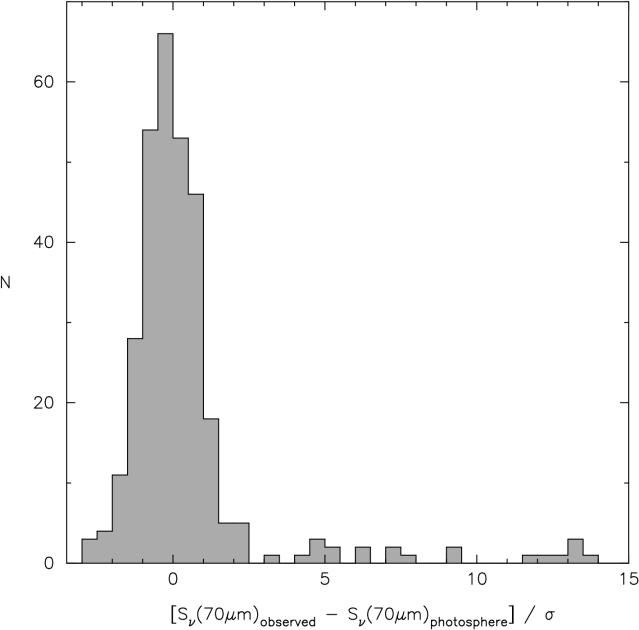

![[Uncaptioned image]](/html/0810.1003/assets/x8.png)
![[Uncaptioned image]](/html/0810.1003/assets/x9.png)
![[Uncaptioned image]](/html/0810.1003/assets/x10.png)
![[Uncaptioned image]](/html/0810.1003/assets/x11.png)
![[Uncaptioned image]](/html/0810.1003/assets/x12.png)
![[Uncaptioned image]](/html/0810.1003/assets/x13.png)


![[Uncaptioned image]](/html/0810.1003/assets/x16.png)
![[Uncaptioned image]](/html/0810.1003/assets/x17.png)
![[Uncaptioned image]](/html/0810.1003/assets/x18.png)