OPTICAL IDENTIFICATION OF A NEW CATACLYSMIC VARIABLE FROM INTEGRAL ALL SKY SURVEY: IGR J08390–4833
Abstract
We have optically identified a recently discovered INTEGRAL source, IGR J08390–4833, with a cataclysmic variable, i.e. an accreting white dwarf in a binary system. The spectrum exhibits a rising blue continuum together with Balmer and HeII emission lines. Analysis of the light curve of the source shows clear presence of intrinsic variability on a time scale of the order of an hour, although we do not claim that this variability is periodic. Therefore we are not yet able to classify the object into a specific CV subclass.
keywords:
cataclysmic variables — X-ray sources — optical observationsINTRODUCTION
Surveys of the sky in X-ray energy band are very useful in constructing catalogs of different classes of sources with minimal biases. These catalogs, in turn, provides us a possibility to study properties of populations of different astrophysical objects. However, in order for such measurements to be accurate one needs to minimize incompleteness of the catalogs.
INTEGRAL observatory (Winkler et al. 2003) is performing the most sensitive all sky survey in hard X-ray energy band up to date (Krivonos et al. 2007) and provides important information about populations of nearby AGNs (Sazonov et al. 2007), X-ray binaries (Lutovinov et al. 2005; Bodaghee et al. 2007; Revnivtsev et al. 2008) and cataclysmic variables (Revnivtsev et al. 2008).
The catalog contains more than 400 sources, many of which still lack a secure optical identification. Our group systematically performs optical observations of unidentified INTEGRAL sources with the aim of determining their nature (Bikmaev et al. 2006a, b; Burenin et al. 2006a, b; Mescheryakov et al. 2006; Bikmaev et al. 2008; Burenin et al. 2008). The increase of the completeness of the INTEGRAL all sky catalog significantly increases its scientific value. In the present paper we report on the identification of the source IGR J08390–4833 as a new cataclysmic variable.
OBSERVATIONS
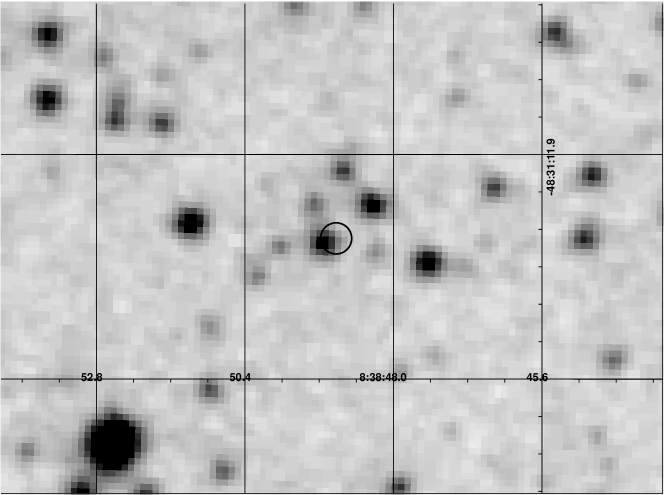
The source IGR J08390–4833 was discovered in INTEGRAL observations by Sazonov et al. (2008)and follow-up observations with Chandra (Sazonov et al. 2008) led to a likely optical identification with a V magnitude star at RA=08h 38m 49.11s, Dec=-48d 31m 24.7s. An image of a [1.4x1.2 arcmin] region around the object from the DSS2-R all sky survey is shown in Fig. 1.
SPECTRAL
Our spectroscopic observations were carried out with the SAAO 1.9m telescope during three nights in April 2008. The observations were performed with the Cassegrain spectrograph using a long slit of 31.5′′. A grating with 300 lines mm-1 was used with the SITe 2661798 pixel CCD detector. This gave a wavelength range 3500–7300 Å with 2.3 Å pixel-1 and FWHM 7 Å along the dispersion direction and the scale along the slit 0\farcs7 pixel-1. The seeing during the observations varied from 1.0′′ to 1.6′′, but was stable during each night. Spectra of Cu–Ar comparison arcs were obtained to calibrate the wavelength scale. The airmass range was from 1.04 to 1.18 and spectrophotometric flux standards were observed after object for flux calibration.
The reduction of all data was performed using the IRAF111http://iraf.noao.edu/ data reduction package. Cosmic ray hits were removed from the 2D spectral using MIDAS. We corrected for the overscan, subtracted the bias and performed flat-field corrections ussing IRAF tasks in the ccdred package and used the software tasks in twodspec to perform the wavelength calibration and to correct each frame for distortion and tilt. The accuracy of the wavelength calibration was better than 0.4 Å. After the 2D spectrum was wavelength-calibrated, the night sky background was subtracted. Using our data of the spectrophotometry standard stars, the intensities of the 2D spectrum were transformed to absolute fluxes. One-dimensional spectra were extracted in order to get the total flux.
IMAGING AND PHOTOMETRY
On 26 April 2008 we obtained a light curve of the source with using the SAAO 1m telescope and UCT CCD. The aim of the observation was to study its variability and to search for possible periodicities,caused by either by rotational or orbital modulations.
The high-speed photometry was taken with the University of Cape Town CCD photometer (UCT CCD, O’Donoghue (1995)) on the SAAO 1-m telescope. We used 10-s exposures (there is no dead time between exposures, since the photometer is a frame transfer CCD) with no filter. Unfiltered observations with the UCT CCD gives photometry with an effective wavelength similar to Johnson -band, but with a very broad bandpass. The use of white light means that the observations cannot be precisely placed on a standard photometric system; the magnitude calibration approximates Johnson V only to within 0.1 mag. We performed differential photometry, implying that colour differences between the targets and comparison stars were ignored in correcting the data for atmospheric extinction.
Due to the detection of nebular emission lines around the object (see below), some H images were obtained with the SAAO 1.0-m telescope. One pair of images was obtained in V and H on the night of 3 May 2008 while four pairs of images were obtained in R and H on the night of 10 May 2008, with exposure times of 300 and 1200 sec, respectively using the SITe 512512 pixel CCD camera (scale 0.31 arcsec/pixel). The data reduction was performed using MIDAS and IRAF data reduction packages. Cosmic rays were removed from the 2D spectral frame using MIDAS. IRAF tasks in the ccdred package were used to correct for the overscan and to perform flat-field corrections.
RESULTS
SPECTRA


The grand-sum of all the spectra of IGR J08390–4833 obtained with SAAO 1.9m telescope is shown in Fig. 2. The bright Balmer emission lines with zero redshift immidiately show that the source is Galactic. The shape of the continuumoptical spectrum along with a sequence of strong Balmer emission lines, indicates that this source is a cataclysmic variable (see e.g. Schmidt, Stockman, & Grandi 1986; Bikmaev et al. 2006b; Masetti et al. 2007).
EMISSION LINE NEBULA
The 2D spectrum obtained by the long slit of the spectrograph indicates spatially extended emission lines, arising from nebulosity surrounding the source, including OII, [NII] 6548, 6584Å and [S II]6716, 6731ÅṪhe presence of these lines in the source spectrum is most likely a result of imperfect subtraction of the bright nebula emission lines, which are clearly visible in 2D spectra.
It is interesting to check the possible casual connection of the cataclysmic variable with this nebula, because cataclysmic variables sometime might undergone classical nova explosion and this might create some remnant/nebula (see e.g. Slavin, O’Brien, & Dunlop 1995). For this purpose we analized the spectrum of the nebula and obtained image of the area.
The spectrum of the nebula is shown in Fig.3. Measured line ratios are listed in Table 1. All emission lines were measured applying the MIDAS programs described in detail in Kniazev et al. (2004). All overlapping lines were fitted simultaneously as a blend of two or more Gaussian features: the H 6563 and [N ii] 6548,6584 lines and the [S ii] 6716,6731 lines. Parameters of the spectrum was analyzed using diagnostics of Kniazev et al. (2008a), which gave us values of the reddening in the spectrum and the density of emitting plasma. For the latter we assumed all lines are produced in an isothermal gas at uniform density and ionization level. The reddening correction, electron temperatures and density were calculated iteratively until the values converged.
| (Å) Ion | F()/F(H) | I()/I(H) |
|---|---|---|
| 3727 [O ii] | 3.690.29 | 3.900.32 |
| 4101 H | 0.290.07 | 0.300.10 |
| 4340 H | 0.480.07 | 0.500.08 |
| 4861 H | 1.000.08 | 1.000.09 |
| 4959 [O iii] | 0.170.06 | 0.170.06 |
| 5007 [O iii] | 0.450.05 | 0.450.05 |
| 5869 He ii | 0.090.04 | 0.090.04 |
| 6548 [N ii] | 0.500.05 | 0.470.04 |
| 6563 H | 3.130.21 | 2.940.22 |
| 6584 [N ii] | 1.470.10 | 1.390.10 |
| 6717 [S ii] | 0.830.06 | 0.780.06 |
| 6731 [S ii] | 0.590.04 | 0.550.04 |
| EW(H) Å | 131a | |
| C(H) dex | 0.08 | |
| AB mag | 0.23 | |
| S ii 6731/6717 | 1.4090.156 | |
| (S ii 6731/6717), cm-3 | 20 | |
-
a – Due to extreme weakness of the nebular continuum we can not securely determine the uncertainty of the value of the equivalent width. However we anticipate that it does not exceed 30%.
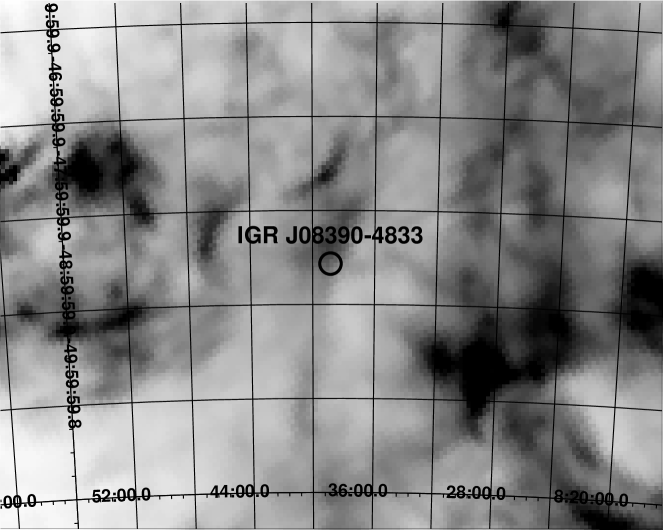
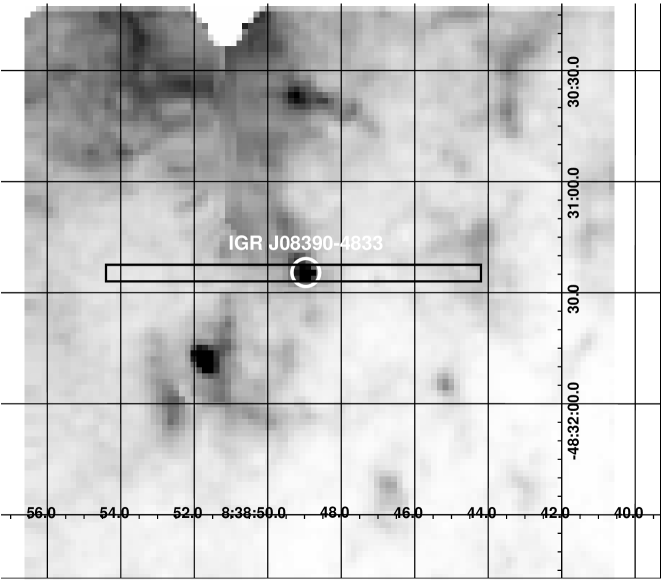
The lines intensity ratios indicate that they originate in a hot low density region, which is likely to be an extended HII region (see e.g. disgnostics of HII region in Kniazev, Pustilnik, & Zucker 2008b) which is clearly visible on the images (Finkbeiner 2003, see also Fig.4).
In order to check the association of the emission line nebula with our source we have obtained an image of the sky around the source with an filter. The resulted (continum) colour image was cleaned to remove residuals left from imperfect subtraction of stars, and then binned into pixels (see Fig. 4). The image does not show a clear association of the nebula with the source.
LIGHT CURVE
The optical light curve of the source is presented in Fig. 5 (lower panel). The Lomb-Scargle periodogram (Lomb 1976) is presented in Fig. 5(upper panel). Before construction of the Lomb-Scarge periodogram the light curve was de-trended by subtraction of the best fit quadratic function from the original data.

In absence of internal variability of the source flux the probability for Lomb-Scargle power to exceed the value is . Thus we can securely claim the presence of the instrinsic variability of the source flux at Fourier frequencies Hz. The highest peak in the periodogram corresponds to the frequency Hz, or to the period hour.
Taking into account that the length of our time series is only 3 hours, we cannot claim detection of any periodic variations. In order to make secure conclusion in this regard we need to obtain more observations spanning a longer time base.
Further classification of the source to subclasses of cataclysmic variables can be only done after collection of more data in optical and X-ray energy bands.
Acknowledgements.
This work was supported by grants RFFI 07-02-01051, 07-02-00961, NSH-1789-2003.2, NSH-1100.2006.2, and the programm of Presidium of Russian Adademy of Sciences “Formation and evolution of stars and galaxies”References
- Beuermann (2006) Beuermann K., 2006, A&A, 460, 783
- Bikmaev et al. (2006a) Bikmaev I. F., Sunyaev R. A., Revnivtsev M. G., Burenin R. A., 2006, AstL, 32, 221
- Bikmaev et al. (2006b) Bikmaev I. F., Revnivtsev M. G., Burenin R. A., Sunyaev R. A., 2006, AstL, 32, 588
- Bikmaev et al. (2008) Bikmaev I., Revnivtsev M., Burenin R., Sazonov S., Sunyaev R., Pavlinsky M., Galeev A., Sakhibullin N., 2008, ATel, 1363
- Bodaghee et al. (2007) Bodaghee A., et al., 2007, A&A, 467, 585
- Burenin et al. (2006a) Burenin R., Mescheryakov A., Revnivtsev M., Bikmaev I., Sunyaev R., 2006, ATel, 880
- Burenin et al. (2006b) Burenin R., Mescheryakov A., Sazonov S., Revnivtsev M., Bikmaev I., Sunyaev R., 2006, ATel, 883
- Burenin et al. (2008) Burenin R. A., Mescheryakov A. V., Revnivtsev M. G., Sazonov S. Y., Bikmaev I. F., Pavlinsky M. N., Sunyaev R. A., 2008, arXiv, 802, arXiv:0802.1791
- Finkbeiner (2003) Finkbeiner D. P., 2003, ApJS, 146, 407
- Kniazev et al. (2004) Kniazev, A.Y., Pustilnik, S.A., Grebel, E.K., Lee, H., & Pramskij, A.G. 2004, ApJ Suppl., 153, 429
- Kniazev et al. (2008a) Kniazev, A.Y., Zijlstra, A.A., Grebel, E.K., et al. 2008a, MNRAS, accepted (arXiv:0707.4288)
- Kniazev, Pustilnik, & Zucker (2008b) Kniazev A. Y., Pustilnik S. A., Zucker D. B., 2008b, MNRAS, 384, 1045
- Krivonos et al. (2007) Krivonos R., Revnivtsev M., Lutovinov A., Sazonov S., Churazov E., Sunyaev R., 2007, A&A, 475, 775
- Lomb (1976) Lomb N. R., 1976, Ap&SS, 39, 447
- Lutovinov et al. (2005) Lutovinov A., Revnivtsev M., Gilfanov M., Shtykovskiy P., Molkov S., Sunyaev R., 2005, A&A, 444, 821
- Masetti et al. (2007) Masetti N., et al., 2007, A&A, 470, 331
- Mescheryakov et al. (2006) Mescheryakov A., Burenin R., Sazonov S., Revnivtsev M., Bikmaev I., Sunyaev R., 2006, ATel, 948
- O’Donoghue (1995) O’Donoghue D., 1995, BaltA, 4, 519
- Revnivtsev et al. (2008) Revnivtsev M., Lutovinov A., Churazov E., Sazonov S., Gilfanov M., Grebenev S., Sunyaev R., 2008, arXiv, 805, arXiv:0805.0259
- Revnivtsev et al. (2008) Revnivtsev M., Sazonov. S, Krivonos R., Ritter H., Sunyaev R. 2008, to be submitted in A&A
- Sazonov et al. (2007) Sazonov S., Revnivtsev M., Krivonos R., Churazov E., Sunyaev R., 2007, A&A, 462, 57
- Sazonov et al. (2008) Sazonov S., Revnivtsev M., Burenin R., Churazov E., Sunyaev R., Forman W. R., Murray S. S., 2008, arXiv, 802, arXiv:0802.0928
- Skrutskie et al. (2006) Skrutskie M. F., et al., 2006, AJ, 131, 1163
- Slavin, O’Brien, & Dunlop (1995) Slavin A. J., O’Brien T. J., Dunlop J. S., 1995, MNRAS, 276, 353
- Schmidt, Stockman, & Grandi (1986) Schmidt G. D., Stockman H. S., Grandi S. A., 1986, ApJ, 300, 804
- Winkler et al. (2003) Winkler C., et al., 2003, A&A, 411, L1