Do all Flares have White Light Emission?
Abstract
High-cadence, multiwavelength optical observations of a solar active region (NOAA 10969), obtained with the Swedish Solar Telescope, are presented. Difference imaging of white light continuum data reveals a white light brightening, 2 min in duration, linked to a co-temporal and co-spatial C2.0 flare event. The flare kernel observed in the white light images has a diameter of 300 km, thus rendering it below the resolution limit of most space-based telescopes. Continuum emission is present only during the impulsive stage of the flare, with the effects of chromospheric emission subsequently delayed by min. The localized flare emission peaks at 300% above the quiescent flux. This large, yet tightly confined, increase in emission is only resolvable due to the high spatial resolution of the Swedish Solar Telescope. An investigation of the line-of-sight magnetic field derived from simultaneous mdi data shows that the continuum brightening is located very close to a magnetic polarity inversion line. Additionally, an H flare ribbon is directed along a region of rapid magnetic energy change, with the footpoints of the ribbon remaining co-spatial with the observed white light brightening throughout the duration of the flare. The observed flare parameters are compared with current observations and theoretical models for M- and X-class events and we determine the observed white-light emission is caused by radiative back warming. We suggest that the creation of white-light emission is a common feature of all solar flares.
Subject headings:
Sun: activity — Sun: evolution — Sun: flares — Sun: photosphere — Sun: sunspots1. Introduction
Solar white-light flares (WLFs) are events which are visible in the optical continuum and normally contain very small flare kernels, often less than in diameter (Neidig, 1989). Traditionally, WLFs have been associated with more energetic solar flares, where the EUV or soft X-ray luminosity exceeds a relatively large threshold (Neidig & Cliver, 1983). Large X-class WLFs have been observed with ground- and space-based telescopes in recent years (Xu et al., 2006; Isobe et al., 2007), and studies of WLF energetics have indicated that the energy required to power the WL emission is similar to the total energy carried by the electron beam, as proposed by Metcalf et al. (2003). In the regime of small-scale events, where the WLFs are energized by low-energy ( keV) electrons, the electrons are unable to penetrate through the upper chromosphere. Therefore, for these events to demonstrate WL emission, a common belief is to allow for energy transportation from the upper chromosphere to the photosphere via the back-warming effect (Machado et al., 1989).
Matthews et al. (2003) and Hudson et al. (2006) have shown, using space-based instrumentation, that WLFs are detectable in flare categories as low as C1.6. However, the mechanism describing the WL emission in such low-energy events is still inconclusive and open to debate (Fletcher et al., 2007). Often, a strong temporal correlation between the impulsive stage of a flare and the resulting WL emission is observed (Hudson et al., 1992). Indeed, Allred et al. (2005) demonstrate dramatic increases in optical continuum emission during the impulsive stage of simulated flares. However, the duration of these WL enhancements appear to be variable. Bopp & Moffett (1973) and Hawley & Pettersen (1991), through similar investigations of WLFs on dMe stars, have found very different continuum emission behaviour. The former find the WL enhancement ends once the impulsive stage of the flare has ceased, while the latter detect a gradual decay in continuum emission, even after the end of the impulsive phase.
Atmospheric seeing, which is an intrinsic part of all data sets acquired using ground-based telescopes, has previously prevented small-scale WL brightenings from being detected (Hiei, 1982). However, due to the high-order adaptive optics (AO) employed on large telescopes in conjunction with proven image reconstruction algorithms, small-scale structures can now be observed with unprecedented spatial and temporal resolution. In this letter, we utilize a high-cadence data set to search for flare-induced WL emission originating in the solar photosphere from a very modest C2.0 flare.
2. Observations
The data presented here are part of an observing sequence obtained on 2007 August 24, with the Swedish Solar Telescope (SST) on the island of La Palma. The optical setup allowed us to image a region surrounding active region NOAA 10969 complete with solar rotation tracking. This active region was located at heliocentric co-ordinates (,), or S05E33 in the solar NS-EW co-ordinate system. The Solar Optical Universal Polarimeter (SOUP) was implemented to provide 2-dimensional spectral information across the H line profile centred at Å. In addition, a series of Ca ii interference filters were used to provide high-cadence imaging in this portion of the optical spectrum. For the purpose of this letter, only red (H) continuum and blue (Ca ii) continuum observations will be presented.
The observations employed in the present analysis consist of 39000 images in each wavelength, taken with a 0.12 s cadence, providing just over one hour of uninterrupted data. The acquired H continuum images have a sampling of per pixel, to match the telescope’s diffraction-limited resolution to that of the pixel2 CCD. Images of the Ca ii continuum were captured using a pixel2 CCD with a sampling of per pixel. Although the Ca ii camera was oversampled, this was deemed necessary to keep the dimensions of the field-of-view the same for both cameras. Eighth-order AO Scharmer et al. (2003) were used throughout the data acquisition. The acquisition time for this observing sequence was early in the morning, and seeing levels were excellent with minimal variation throughout the time series. During the observing sequence a C2.0 flare was observed, originating from NOAA 10969 at 07:49 UT.
Multi-Object Multi-Frame Blind Deconvolution (MOMFBD; van Noort et al., 2005) image restoration was implemented to remove small-scale atmospheric distortions present in the data. Sets of 80 exposures were included in the restorations, producing a new effective cadence of 9 s. All reconstructed images were subjected to a Fourier co-aligning routine, in which cross-correlation and squared mean absolute deviation techniques are utilized to provide sub-pixel co-alignment accuracy. In addition, full-disk mdi magnetogrames are used to study changes in the line-of-sight magnetic field during the observations.
3. Analysis and Results
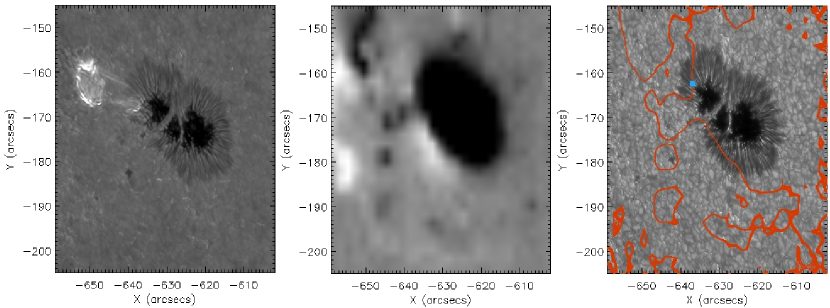
Due to the width of the red continuum filter (10 Å centered at 6565.2 Å), it includes the full H line profile. During the observed flare, the resulting images therefore include a significant contribution from the H core. Therefore, these data can be compared with the blue continuum (10 Å filtergram centered at 3953.7 Å), whose images are not contaminated by any chromospheric emission. The left panel of Figure 1 indicates the clear-cut nature of H line-core contributions to the continuum filtergrams during the observed flare sequence. A simultaneous blue continuum image is displayed in the right panel of Figure 1, yet due to the bandpass of the chosen interference filter, no chromospheric contributions are visible.
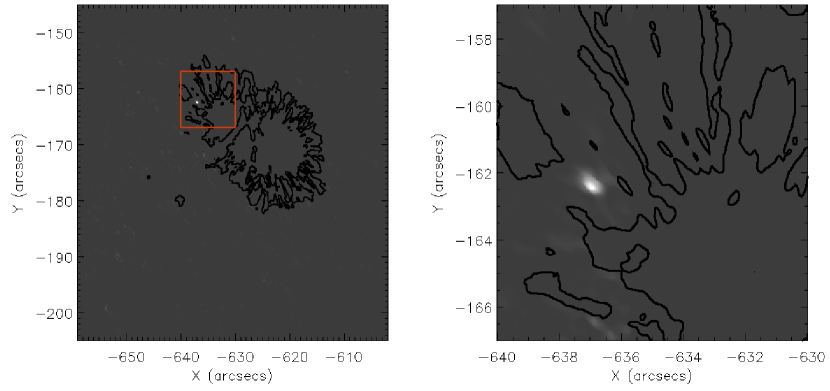
In order to pinpoint any brightenings in the blue continuum data set as a result of the flare, difference imaging techniques are implemented (see e.g. Aschwanden et al., 1999). By subtracting a quiescent continuum image from one undergoing a flare brightening, small-scale intensity enhancements become more obvious. Figure 2 shows the brightening present in the blue continuum data set at the time of the flare. When compared to the footpoint of the H flare ribbon shown in Figure 1, it is clear that the blue continuum brightening originates from the same location in the sunspot penumbra. Indeed, the location of the flare kernel is consistent with the results of a statistical study by Matthews et al. (2003), who find a number of small-flare kernels located near the penumbra/photosphere boundary. The blue continuum brightening occupies 106 pixels in an approximately circular shape, based on a detection threshold above the quiescent mean. Assuming this circular geometry, a kernel diameter of km (12 pixels) exists covering a total area of km2. A flare kernel of these dimensions will therefore be undetectable by the space-based instrumentation used in the Matthews et al. (2003) and Hudson et al. (2006) studies. These surveys struggled to detect C-class WLF emission, primarily due to the limited spatial resolution offered by the TRACE and Yohkoh instruments, which is 725 km at best.
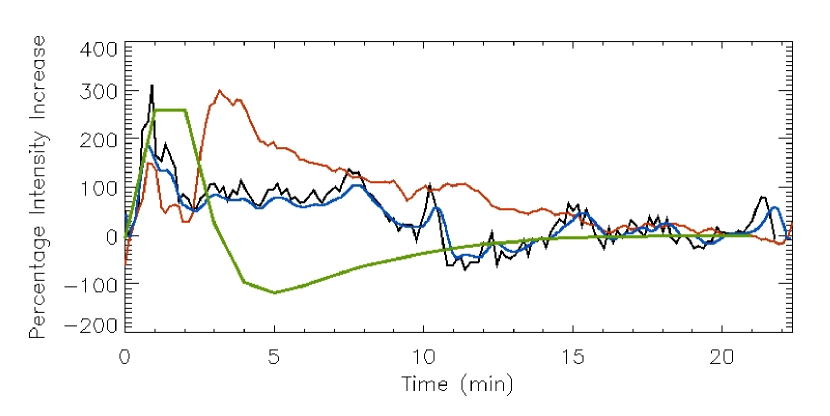
Examining the light curve of the blue continuum brightening, plotted as a solid black line in Figure 3, it is clear that the intensity increase correlates directly with the heightened red continuum emission, plotted in the upper panel. The associated peak in the blue continuum is 300% above the quiescent value. This is significantly higher than the typical % increases detected in previous analyses of WLFs (e.g. Lin & Hudson, 1976). We believe that this large increase is an effect of the high spatial resolution used in this study. By simply degrading the spatial resolution of the current data to that of TRACE (Handy et al., 1999), we find that the peak blue continuum brightening is reduced to only % above its quiescent value. This small increase in luminosity renders the brightening below the values typically observed using satellite-based instruments, since a fluctuation of % will be lost amongst detector noise. It is also interesting to note, from Figure 3, that the associated peak in the raw blue continuum is only 200% above its quiescent value compared to the 300% increase found when investigating the MOMFBD-reconstructed data. This difference can be attributed to the restoration of diffraction-limited resolution after implementation of MOMFBD. An identical intensity threshold applied to reconstructed images will identify fewer pixels (due to an improved spatial resolution), but with a higher overall intensity when compared to pre-reconstructed data. For example, using a lower limit threshold of the quiescent mean plus , MOMFBD-reconstructed data at the time of the flare isolates only 36 pixels corresponding to the brightest regions of the flare kernel, whereas pre-reconstructed continuum data extracts 57 pixels. For the 36 pixels isolated in the MOMFBD-reconstructed data, the average intensity is 300% above the quiescent mean, whereas an average increase of 200% is found for the 57 pixels extracted in the pre-reconstructed data set. This indicates the degree of intensity “smearing” caused by the Earth’s turbulent atmosphere, but through proven reconstruction algorithms this can be removed to restore the image, and hence intensity, to its true diffraction-limited resolution.
The detected contrast enhancement can provide some insight into the origin of the WL continuum brightening. Ding et al. (1999) and Ding et al. (2003) carried out detailed non-LTE calculations on solar atmospheres bombarded by electron beams and heated by backwarming, with these calculations performed for several heliocentric distances. Their main finding is that the highest contrast is produced near the limb for a heated atmosphere that does not involve non-thermal effects from the electron beam. The actual value for the measured contrast is considerably higher than those predicted by the models and may seem well in excess of the values predicted by current radiative transfer calculations. However, we need to emphasize that since localized flare temperatures are high, it is easier for WL emission to be observed in the generally cooler atmosphere of a sunspot (Ding & Fang, 1996). The high contrast (%) quoted above has been estimated relative to quiescent penumbral intensities. If the contrast is determined with respect to typical granulation values, it is reduced to 24%. We therefore conclude that the high contrast observed in this study remains consistent with current non-LTE calculations and supports heating through radiative back-warming models (see also Liu et al., 2001).
The initial impulsive stage of the flare is clearly visible in both the red and blue continuum plots. However, the red intensity plot also reveals a signature of H line-core contamination. The large intensity spike after min is a result of H core emission in the filtergrams (see also left panel of Fig. 1). As expected, this form of “chromospheric contamination” is absent in the blue continuum images. From Figure 3, it is clear that the true continuum brightening acts as a precursor to the influx of H core emission, with an associated delay time of 2 min. This is consistent with the theoretical work of Allred et al. (2005), whose simulated flare events consist of impulsive WL brightenings followed by line-core emission, often with delays of min. Furthermore, the continuum brightening lasts less than 2 min in both the red and blue channels. The WLF emission is therefore short lived and only present during the impulsive stage of the flare. Through examination of an M-class flare, Chen & Ding (2006) find WLF emission during the impulsive phase, with very little residual flux in the latter stages of the flare event. Therefore, the data presented here corroborate the work of Bopp & Moffett (1973), providing a good example of impulsively-generated, short-lived continuum emission. In many flare cases, WL emission is compared directly to the derivative of soft X-ray flux. If the Neupert effect (e.g. Ning, 2008) is valid, a direct correspondence between the derivative of the soft X-ray flux and pure WL emission should be evident. Utilizing soft X-ray data measured by the GOES spacecraft, we determine that the Neupert effect is valid during the presented flare event (Fig 3). However, the cadence of the GOES instrument is 1 min, so timing errors associated with soft X-ray investigations will be considerably larger than those based upon the continuum data presented here.
With the location of the flare kernel identified, it is important to investigate how the magnetic-field morphology ties in with the WL continuum brightening. Typically, flare kernels originate from locations of strong magnetic field gradient, where the field strength changes abruptly over a very short distance (Moore & Rabin, 1985). Additionally, it is of interest to examine where the magnetic energy is released as a result of the flare, and in what direction this release takes place. A two-dimensional magnetic field gradient can be constructed from mdi data obtained just prior to the flare, when the magnitude of the gradient should be at its greatest (Cui et al., 2007). Furthermore, by taking a difference image (pre-flare subtracted from post-flare) of mdi magnetic field information, an accurate representation of changes to the line-of-sight magnetic field can be constructed. Following this form of analysis, we find the observed continuum flare kernel is positioned within a region of strong magnetic field gradient and that the magnetic energy release (from mdi difference imaging) is directly correlated with the H flare ribbon displayed in the left panel of Figure 1. This is consistent with recent X-class flare observations (Guo et al., 2008; Jing et al., 2008), although on a much smaller scale.
From examination of the right panel of Figure 1, it appears that the detected flare kernel is located co-spatially with a polarity inversion line. Bellot Rubio et al. (2004) find that the inclination of the mean magnetic field near the penumbral boundary reaches , implying that active regions observed away from disk center often show a false polarity inversion line. In such cases, the apparent neutral line falls within the so-called limb-side penumbra (Sainz Dalda & Martínez Pillet, 2005), as observed in the right panel of Figure 1. Penumbral models involving two-component magnetic field inclinations produce two distinct neutral lines. Magnetic field vectors with more horizontal components will show an apparent neutral line lying close to the umbra, whereas a more vertical magnetic field component will display a polarity inversion line closer to the penumbral boundary. This dual neutral-line configuration is visible in the North-East part of Figure 1, close to where the WL brightening originates. The true neutral line will lie somewhere in between, with the precise location depending on the weightings made by each of the two components (Title et al., 1993). We therefore conclude that the observed WL brightening originates very close to the true polarity inversion line, often the case for large-scale WLFs (Li et al., 2005).
As detailed above, the detected flare kernel has a diameter of km, thus placing this event out of the range of most current ground- and space-based observatories. As discussed in Matthews et al. (2003) and demonstrated here, there is no reason why WLF emission should not be produced in all flares. It is only the sensitivity and resolution of telescope instrumentation which limits the lower WL emission detection threshold. Therefore, to probe these events and conclusively derive WL emission characteristics, observers must utilize high spatial and temporal resolution data sets covering the wide energy range of solar flares.
4. Concluding Remarks
The unprecedented spatial and temporal resolution data acquired with the SST has revealed WLF emission, lasting approximately 2 min, originating from a compact C2.0 flare. The localized flare emission peaks at 300% above the quiescent flux, much larger than previously observed in satellite-based data sets, simply as a consequence of the high spatial resolution achieved here. Blue continuum images clearly show a bright flare kernel located close to a region of magnetic polarity inversion. The WLF brightening is present during the impulsive stage of the flare, with the effects of core emission subsequently delayed by min. This corroborates current theoretical models (e.g. Allred et al., 2005) related to the generation of optical flare emission. Furthermore, the observed H flare ribbon correlates spatially with the location of rapidly changing magnetic energy. Additionally, the footpoint of the H flare ribbon is co-spatially located with the blue continuum brightening, thus establishing the observed WL emission as a flare-induced phenomena, consistent with radiative back-warming models.
References
- Allred et al. (2005) Allred, J. C., Hawley, S. L., Abbett, W. P., & Carlsson, M., 2005, ApJ, 630, 573
- Aschwanden et al. (1999) Aschwanden, M. J., Fletcher, L., Schrijver, C. J., & Alexander, D., 1999, ApJ, 520, 880
- Bellot Rubio et al. (2004) Bellot Rubio, L. R., Balthasar, H., & Collados, M., 2004, A&A, 427, 319
- Bopp & Moffett (1973) Bopp, B. W., & Moffett, T. J., 1973, ApJ, 185, 239
- Chen & Ding (2006) Chen, Q. R., & Ding, M. D., 2006, ApJ, 641, 1217
- Cui et al. (2007) Cui, Y., Li, R., Wang, H., & He, H., 2007, Sol. Phys., 242, 1
- Ding & Fang (1996) Ding, M. D., & Fang, C., 1996, A&A, 314, 643
- Ding et al. (1999) Ding, M. D., Fang, C., & Yun, H. S., 1999, ApJ, 512, 454
- Ding et al. (2003) Ding, M. D., Liu, Y., Yeh, C.-T., & Li, J. P., 2003, A&A, 403, 1151
- Fletcher et al. (2007) Fletcher, L., Hannah, I. G., Hudson, H. S., & Metcalf, T. R., 2007, ApJ, 656, 1187
- Guo et al. (2008) Guo, Y., Ding, M. D., Wiegelmann, T., & Li, H., 2008, ApJ, 679, 1629
- Handy et al. (1999) Handy, B. N., et al., 1999, Sol. Phys., 187, 229
- Hawley & Pettersen (1991) Hawley, S. L., & Pettersen, B. R., 1991, ApJ, 378, 725
- Hiei (1982) Hiei, E., 1982, Sol. Phys., 80, 113
- Hudson et al. (1992) Hudson, H. S., Acton, L. W., Hirayama, T., & Uchida, Y., 1992, PASJ, 44, L77
- Hudson et al. (2006) Hudson, H. S., Wolfson, C. J., & Metcalf, T. R., 2006, Sol. Phys., 234, 79
- Isobe et al. (2007) Isobe, H., et al., 2007, PASJ, 59, 807
- Jing et al. (2008) Jing, J., Chae, J., & Wang, H., 2008, ApJ, 672, L73
- Li et al. (2005) Li, J. P., Ding, M. D., & Liu, Y., 2005, Sol. Phys., 229, 115
- Lin & Hudson (1976) Lin, R. P., & Hudson, H. S., 1976, Sol. Phys., 50, 153
- Liu et al. (2001) Liu, Y., Ding, M. D., & Fang, C., 2001, ApJ, 563, L169
- Machado et al. (1989) Machado, M. E., Emslie, A. G., & Avrett, E. H., 1989, Sol. Phys., 124, 303
- Matthews et al. (2003) Matthews, S. A., van Driel-Gesztelyi, L., Hudson, H. S., & Nitta, N. V., 2003, A&A, 409, 1107
- Metcalf et al. (2003) Metcalf, T. R., Alexander, D., Hudson, H. S., & Longcope, D. W., 2003, ApJ, 595, 483
- Moore & Rabin (1985) Moore, R., & Rabin, D. M., 1985, ARA&A, 23, 239
- Neidig & Cliver (1983) Neidig, D. F., & Cliver, E. W., 1983, Sol. Phys., 88, 275
- Neidig (1989) Neidig, D. F., 1989, Sol. Phys., 121, 261
- Ning (2008) Ning, Z., 2008, Sol. Phys., 248, 99
- Sainz Dalda & Martínez Pillet (2005) Sainz Dalda, A., & Martínez Pillet, V., 2005, ApJ, 632, 1176
- Scharmer et al. (2003) Scharmer, G. B., Dettori, P. M., Lofdahl, M. G., & Shand, M., 2003, Proc. SPIE, 4853, 370
- Title et al. (1993) Title, A. M., Frank, Z. A., Shine, R. A., Tarbell, T. D., Topka, K. P., Scharmer, G., & Schmidt, W., 1993, ApJ, 403, 780
- van Noort et al. (2005) van Noort, M., Rouppe van der Voort, L., Löfdahl, M. G., 2005, Sol. Phys., 228, 191
- Xu et al. (2006) Xu, Y., Cao, W., Liu, C., Yang, G., Jing, J., Denker, C., Emslie, A. G., & Wang, H., 2006, ApJ, 641, 1210