Suzaku Observations of Cyg X-1
Abstract:
We present highlights from a series of four simultaneous Suzaku/Rossi X-ray Timing Explorer (RXTE) observations of the black hole candidate Cyg X-1. We first briefly summarize several key results from our decade long RXTE monitoring campaign (which to date contains over 250 observations). We then comment on challenges of analyzing the Suzaku data, i.e., improving the aspect correction beyond that of the existing tools, and quantitatively assessing pileup. All of our Suzaku observations (one, by design) occurred at or very near orbital phase 0 (superior conjunction), and hence show evolution in color-color diagrams due to X-ray absorption by material from the wind of the secondary. We present simple partial absorption models for this evolution. We then compare the Suzaku and RXTE data, and explicitly divide the Fe line region into narrow and broad components. Both are required for the Suzaku data, and are seen to be consistent with the RXTE data. These Suzaku observations occurred near historically hard, low flux states. We present fits of the broad band spectra with a simple phenomenological broken powerlaw model, as well as a more physically motivated Comptonization model. Whereas the former class of models described nearly all of the RXTE campaign better than any physical model, here the latter model is slightly more successful. The Comptonization model, however, exhibits little evidence for a soft disk component, which formally corresponds to a small, inner disk radius. Whether this is physical, due to unmodeled absorption, or is a calibration issue, remains an open question.
1 Summary of RXTE Campaign
Cyg X-1 is one of the best studied of the galactic black hole candidates (BHC). It has been a persistent X-ray source, exhibiting, very broadly, spectrally hard to somewhat softer X-ray states. (Whereas the hard X-ray tail softens, it never completely vanishes for Cyg X-1.) In Cyg X-1 these spectral states occur over a factor of only a few in X-ray flux. A summary of the system properties can be found in [13], while a summary of the broad band spectral behavior can be found in [22], and references therein. Whereas Cyg X-1 exhibits an interesting variety of variability behavior (see [15, 16, 1, 7, 20], etc.) and radio behavior (see [5, 6, 14, 22], etc.) correlated with the X-ray spectra and flux, here we concentrate on the X-ray spectral properties.
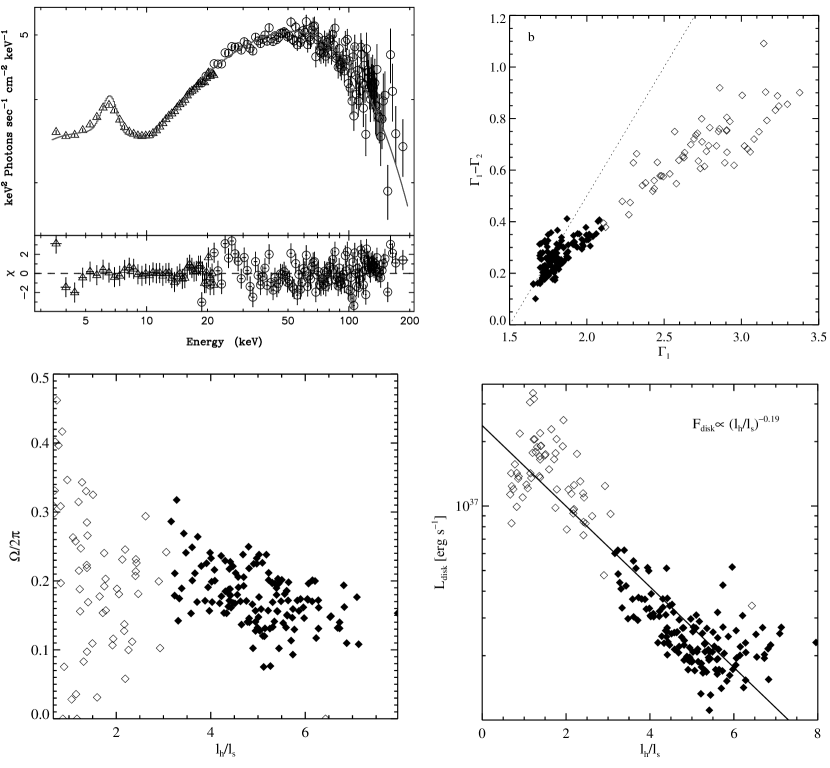
In Fig. 1, we present some of the spectral highlights from our RXTE monitoring campaign ([22]). First, we see that the broad band spectra are extremely well-described by a very simple model: an absorbed, exponentially cutoff broken powerlaw, with a broad gaussian line. The spectral break always occurs near 10 keV, with the degree of the break increasing for softer (typically brighter) spectra. More physically motivated Comptonization models ([9, 22]) and X-ray jet models ([11]) fit the data nearly as well. The former fit the soft X-ray power law with a combination of disk photons and Comptonization, and the (exponentially cutoff) hard X-ray powerlaw with Comptonization and reflection. The jet models also utilize these same physical components, but also allow for jet synchrotron radiation (usually in the soft X-ray), and jet synchrotron self-Compton (usually in the hard X-ray). For neither the Comptonization nor jet models is there a single continuum component underlying the Fe K line region.
Prior studies have ascribed the – correlation predominantly to a hardness-reflection anti-correlation ([23, 9]). Although this effect is seen somewhat by our campaign ([22], Fig. 1), it is greatly reduced from prior claims (e.g., [9]). A major difference between these studies is that we have allowed the fitted seed photon temperature to be a free parameter, whereas other studies have not (i.e., [9]). Fig. 1 shows that to some extent, a hardness-disk flux anti-correlation subsumes a substantial fraction of any hardness-reflection anti-correlation. The ability of Suzaku to measure the soft X-ray spectral regime is therefore seen to be crucial in further constraining such models.
For all of our RXTE spectral fits, whether broken power law, Comptonization, or jet, a broad gaussian is found near the expected position of the 6.4 keV, Fe K line. However, the width of this line, and its correlations with spectral hardness, do depend upon the exact fitted model. (Broken power laws tend to produce the narrowest lines; different Comptonization models, e.g., comptt vs. eqpair yield differing line widths [22].) Furthermore, RXTE lacks the spectral resolution to decompose the residuals in the line region into broad and narrow components. Suzaku, on the other hand, does have sufficient resolution to decompose the line into components, and again is seen to be crucial for further constraining spectral models.
2 Attitude Correction and Pileup Estimation for the Suzaku Observations
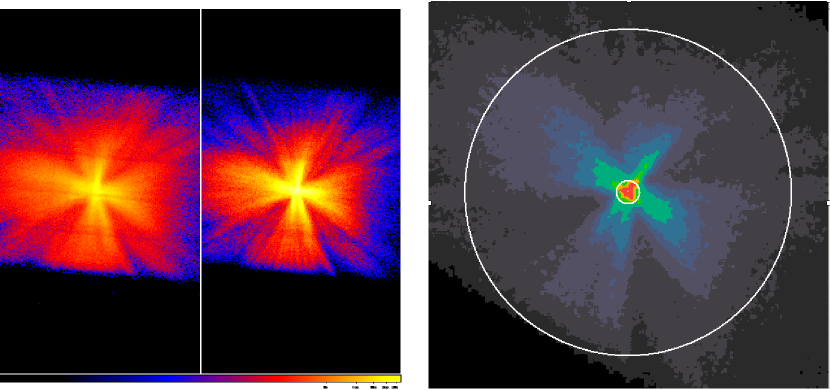
Before we can describe and fit the Suzaku spectra, we must first make sure that we have minimized instrumental effects. Most important among these is the reduction of photon pileup, i.e., when more than one photon lands in the same or adjacent pixels in one CCD readout frame (see [4] for a technical description). These “piled” events are either lost (due to exceeding the event energy threshold, or migrating to bad “event grades”), or are read as a higher energy photon, therefore distorting the spectrum. (This distortion can be especially problematic at high energies, as the intrinsic photon count rate spectra tend to be .) In order to assess the degree of pileup, we must first have the most accurate measure of the X-ray image. This in turn requires an accurate spacecraft attitude. For Suzaku, the latter is affected by “thermal wobbling” of the spacecraft, induced during day/night passages during the spacecraft orbit ([19]).
Whereas a statistical correction has been developed to correct the spacecraft attitude ([19]), for bright sources (e.g., many AGN, and our Cyg X-1 data), the correction can be improved further by measuring the mean position of the point spread function (PSF) on short time scales, then refining the empirical correction of the spacecraft attitude. Such an algorithm, aeattcor.sl, has been developed by John Davis, and as shown in Fig. 2 it further improves the Cyg X-1 image.
With this improved image, one can then calculate the mean counts per pixel region per CCD readout frame, and thereby arrive at a quantitative assessment of the fractional pileup level in a given image. We have developed a tool (pileup_estimate.sl) to automate this process. It further allows one to create a region filter that excludes the central piled regions, and returns an estimate of the average pileup fraction in the remainder of the image.
These tools have been made available publicly111http://space.mit.edu/CXC/software/suzaku/. For each of our observations we exclude approximately 1/3 of the total counts from the center of the (attitude corrected) image. We estimate that any residual pileup fractions are .
3 The Suzaku Observations
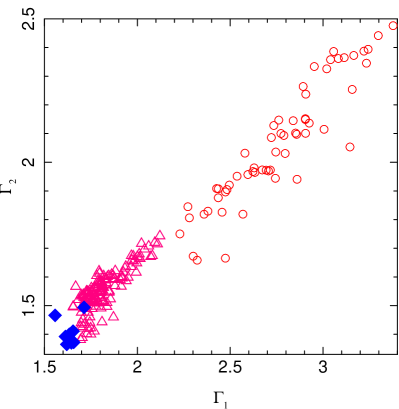
Over the course of a year and a half, we have obtained four simultaneous Suzaku/RXTE observations. (The most recent observation in April 2008 was also performed simultaneously with Chandra, XMM-Newton, INTEGRAL, and Swift.) In Fig. 3 we show the location in the – diagram of broken powerlaw fits to the simultaneous RXTE data. We immediately see that these spectra were among the spectrally hardest observations of the past decade.
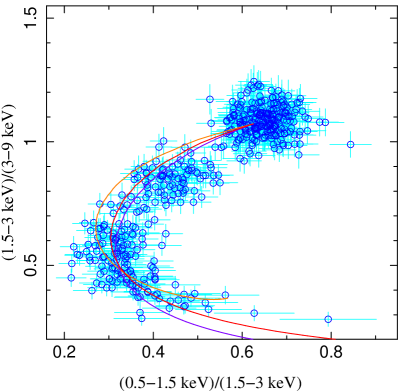
Note that Fig. 3 shows eight, rather than just four points, as we have subdivided each observation by its location on a color-color diagram defined by the Suzaku bandpasses (see Fig. 4). All of our observations show evolution towards the lower left corner of these diagrams, with three of the four observations rounding the corner and evolving to the right along the bottom of the diagram. These three observations (with durations of 0.2 in phase) overlapped with orbital phase 0 (i.e., superior conjunction; the April 2008 observation was specifically scheduled for that phase). The fourth observation covered orbital phase 0.2–0.3. Thus all observations were subject to a series of dipping events due to absorption by the stellar wind of the secondary (see [2]).
We can model the color-color diagrams by fitting a spectrum to the locus of points in the upper right hand of the plot, and then multiplying this spectrum by a range of additional column densities (above and beyond the Galactic column). This yields the downward/leftward evolution on the diagram. In order to obtain the evolution to the right along the bottom of the diagram, we need to presume a partial covering fraction of 80% (i.e., 20% uncovered) for at least the soft X-rays. Our best fit to the diagram, however, is for the middle X-rays to be 100% covered. The uncovered soft X-rays, rather than being wholly local to the source, is likely dominated by the dust scattering halo (see [17]), a substantial fraction of which is contained within the 2 arcminute Suzaku PSF. We note that Chandra observations of such dipping are more consistent with a 95% covering fraction (see [8], and the contribution by M. Hanke in this volume).
We have divided each observation into as many as three pieces - the locus of points in the upper right, the downward slope to the left, and the evolution to the right along the bottom of the diagram. These time intervals were defined by the Suzaku observations, and then RXTE spectra were extracted from the intersections with those time intervals. Throughout the rest of this work, we only consider spectra from the locus of points in the upper right.
4 The Fe K Line Region
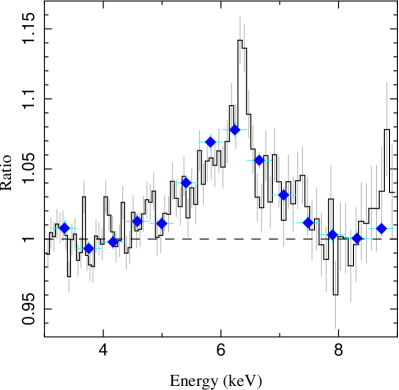
We next turn to the line region of the data. RXTE data have suggested a broad Fe line ([22]), but questions have remained as to contributions from narrow components, especially given the very modest resolution of RXTE222Chandra resolves the narrow components of the line (see [12]). For Chandra, however, the broad components are difficult to assess with great accuracy (see [8], and the contribution by M. Hanke in this volume).. First, we wish to address the consistency between the two detectors. We do this by fitting a simple phenomenological model (e.g., a powerlaw) simultaneously to the 3.5–4.5 keV and 7.5–8.5 keV data, and then noticing the ratio residuals in the full 3–9 keV range. This procedure does not necessarily produce an accurate profile for any broad line in the 4–8 keV region (it produces perhaps the “most optimistic” estimate of such a line), but it can show the consistency of the Suzaku and RXTE residuals. We show such ratio residuals in Fig. 5.
There is indeed very good agreement between the Suzaku and RXTE residuals, and both show broad deviations from a simple continuum, consistent with a relativistically broadened line. (We have not, however, included all the potential continuum complexity discussed above, i.e., disk, Comptonization, synchrotron, synchrotron self-Compton, and reflection). The Suzaku data also strongly suggest narrow components. A narrow emission feature is seen at 6.4 keV, and a possible absorption feature is seen at 6.7 keV. Based upon prior Chandra observations at orbital phase 0 ([8]), both features are expected. The emission and absorption features have comparable equivalent widths (absolute value –30 eV), and hence do not form the main contribution to the broad residuals seen in the RXTE data (equivalent width - eV, if fitting just a single component).
We see that at least three components are required to fit the broad line region residual in the RXTE data. In Fig. 6 we present such continuum plus multi-component line fits. Specifically, we include a relativistic diskline model, a narrow gaussian emission line, and a narrow gaussian absorption line. We show fits with and without an additional smeared edge. Both sets of fits require a broadened line component, with an inner radius ranging from 10 to 60 . The equivalent width of the broad line component is in the 40–130 eV range (and is 10%–30% lower if including a smeared edge). It is interesting to note that the peak in the blue wing of the line is obscured by the absorption line at 6.7 keV. We have found, however, that it is difficult to fit the width and location of the RXTE residuals without such a blue peak in the broad line component.
5 Broad Band Fits
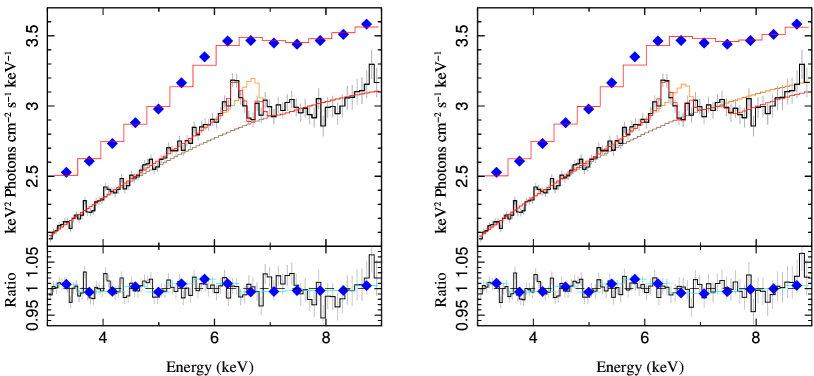
We now turn to the broad band spectra by considering models fit to the 0.7–9 keV XIS data333For plotting purposes, all XIS spectra are summed, however, we fit each XIS data set individually. The HXD-PIN data are in good agreement with the 20–70 keV RXTE-HEXTE data, and do not alter the fits. Consideration of the HXD-GSO background is a complex issue, and we defer discussion of these data to a forthcoming work., the 3–22 keV RXTE-PCA data, and the 18–200 keV RXTE-HEXTE data. As for our RXTE campaign, we first consider simple phenomenological fits consisting of an absorbed, exponentially cutoff broken powerlaw. Instead of adding a single broad gaussian, we also include a narrow gaussian. Additionally, we include a soft disk component. An example fit is shown in Fig 7.
Although this fit is relatively successful, several points are worth noting. For this, and all of our fits, there are sharp, residuals in the 0.7–1.2 keV region, i.e., near absorption edge features. We fit absorption with tbnew, a modification of the model of [21], which includes detailed structure at these edges. Altering absorption abundances, however, did not remove these residuals. We are unsure currently whether these residuals are instrumental (e.g., contaminant unmodeled in the Suzaku spectral response) or physical features (e.g., unmodeled line absorption or emission). The additional disk component is both of high temperature and low amplitude. Formally, low amplitude corresponds to a small inner disk radius444Discussions of the inner disk radius not receding as a BHC enters the low/hard state often have shown ratio residuals of the model– excluding the disk component– in order to illustrate their points. It is the relative weakness of this ratio, however, that formally indicates a small inner disk radius, i.e., a non-recessed disk. Given the high fitted disk temperature, here the disk amplitude implies an inner disk radius of only . A different (more heavily piled up, even with removal of data from the center of the image) Suzaku observation of Cyg X-1 recently has been described with a more complex Comptonization model consisting of different low and high energy Comptonized components ([10]). Perhaps the low normalization/high temperature disk component is indicating the need for continuum models with such added complexity.
In Fig. 7 we also show the same spectra fit with the eqpair Comptonization model, allowing for reflection, an unComptonized disk component tied to the temperature of the seed photons, and a second disk component with temperature left free (here, eV). Overall, this fit is somewhat better than the broken powerlaw model. However, as for the broken powerlaw fit, any soft excess (here dominated by the seed photons for Comptonization) is both of high temperature, and low amplitude. (To date, for these historically hard “low state” observations, we have been unable to find a satisfactory fit with low seed photon temperatures.) Note also that the fitted reflection fraction is , i.e., counter to any expectations from a hardness-reflection fraction anti-correlation. We have simultaneous Chandra-HETG and XMM-RGS data for one of our observations, thus, we are exploring whether the inclusion of narrow absorption and emission components (e.g., from a highly ionized wind) can fundamentally alter the broad-band properties suggested by the above models.
References
- [1] M. Axelsson, L. Borgonovo, and S. Larsson, Evolution of the 0.01-25 Hz power spectral components in Cygnus X-1, A&A 438, 999–1012 (2005).
- [2] M. Bałucińska-Church, M. J. Church, P. A. Charles, F. Nagase, J. LaSala, and R. Barnard, The distribution of X-ray dips with orbital phase in Cygnus X-1, MNRAS 311, 861–868 (2000).
- [3] Paolo Coppi, PASP Conference Series, 161, 375, 1999.
- [4] John E. Davis, Event pileup in charge coupled devices, ApJ 562, 575–582 (2001).
- [5] E. Gallo, R. P. Fender, and G. G. Pooley, A universal radio-X-ray correlation in low/hard state black hole binaries, MNRAS 344, 60–72 (2003).
- [6] T. Gleissner, J. Wilms, G. G. Pooley, M. A. Nowak, K. Pottschmidt, S. Markoff, S. Heinz, M. Klein-Wolt, R. P. Fender, and R. Staubert, Long term variability of Cyg X-1. III. radio-X-ray correlations, A&A 425, 1061–1068 (2004).
- [7] T. Gleissner, J. Wilms, K. Pottschmidt, P. Uttley, M. A. Nowak, and R. Staubert, Long term variability of Cyg X-1. II. the rms-flux relation, A&A 414, 1091–1104 (2004).
- [8] M. Hanke, J. Wilms, M. A. Nowak, K. Pottschmidt, N. S. Schulz, and J. C. Lee, Chandra X-ray spectroscopy of the focused wind in the Cygnus X-1 system I. the non-dip spectrum in the low/hard state, ApJ (2008), in press.
- [9] A. Ibragimov, J. Poutanen, M. Gilfanov, A. A. Zdziarski, and C. R. Shrader, Broad-band spectra of Cygnus X-1 and correlations between spectral characteristics, MNRAS 362, 1435–1450 (2005).
- [10] K. Makishima, H. Takahashi, S. Yamada, C. Done, A. Kubota, T. Dotani, K. Ebisawa, T. Itoh, S. Kitamoto, H. Negoro, Y. Ueda, and K. Yamaoka, Suzaku results on Cygnus X-1 in the low/hard state, PASJ 60, 585– (2008).
- [11] S. Markoff, M. Nowak, and J. Wilms, Going with the flow: Can the base of jets subsume the role of compact accretion disk coronae?, ApJ 635, 1203–1216 (2005).
- [12] J. M. Miller, A. C. Fabian, R. Wijnands, R. A. Remillard, P. Wojdowski, N. S. Schulz, T. Di Matteo, H. L. Marshall, C. R. Canizares, D. Pooley, and W. H. G. Lewin, Resolving the composite Fe K Emission line in the galactic black hole Cygnus X-1 with Chandra, ApJ 578, 348–356 (2002).
- [13] Michael A. Nowak, Brian A. Vaughan, Jörn Wilms, James Dove, and Mitchell C. Begelman, RXTE observations of Cygnus X–1: II. Timing analysis, ApJ 510, 874–891 (1999).
- [14] Michael A. Nowak, Jörn Wilms, Sebastian Heinz, Guy Pooley, Katja Pottschmidt, and Stephane Corbel, Is the ‘IR coincidence’ just that?, ApJ 626, 1006–1014 (2005).
- [15] K. Pottschmidt, J. Wilms, M. A. Nowak, W. A. Heindl, D. M. Smith, and R. Staubert, Temporal evolution of X-ray lags in Cygnus X-1, A&A 357, L17–L20 (2000).
- [16] K. Pottschmidt, J. Wilms, M. A. Nowak, G. G. Pooley, T. Gleissner, W. A. Heindl, D. M. Smith, R. Remillard, and R. Staubert, Long term variability of Cyg X-1 (1998 to 2001) I. systematic spectral-temporal correlations in the hard state, A&A 407, 1039–1058 (2003).
- [17] P. Predehl and J. H. M. M. Schmitt, X-raying the interstellar medium: ROSAT observations of dust scattering halos, A&A 293, 889–905 (1995).
- [18] R. A. Remillard and J. E. McClintock, X-ray properties of black-hole binaries, Annual Review of Astronomy and Astrophysics 44, 49–92 (2006).
- [19] Y. Uchiyama, Y. Maeda, M. Ebara, R. Fujimoto, Y. Ishisaki, M. Ishida, R. Iizuka, M. Ushio, H. Inoue, S. Okada, H. Mori, and M. Ozaki, Restoring the Suzaku source position accuracy and point-spread function, PASJ 60, 35–42 (2008).
- [20] P. Uttley, I. M. McHardy, and S. Vaughan, Non-linear X-ray variability in X-ray binaries and active galaxies, MNRAS 359, 345–362 (2005).
- [21] J. Wilms, A. Allen, and R. McCray, On the absorption of X-rays in the interstellar medium, ApJ 542, 914–924 (2000).
- [22] Jörn Wilms, Michael Nowak, Katja Pottschmidt, Guy G. Pooley, and Sonia Fritz, Long term variability of Cygnus X-1. IV. Spectral evolution 1999-2004, A&A 447, 245–261 (2006).
- [23] Andrzej A. Zdziarski, Piotr Lubiński, and David A. Smith, Correlation between Compton reflection and X-ray slope in Seyferts and X-ray binaries, MNRAS 303, L11–L15 (1999).