Probing the radio to X-ray connection of the Vela X PWN with Fermi LAT and H.E.S.S.
Abstract
Morphologically it appears as if the Vela X (catalog ) PWN consists of two emission regions: whereas X-ray ( keV) and very high energy (VHE) H.E.S.S. -ray observations appear to define a cocoon type shape south of the pulsar, radio observations reveal an extended area of size (including the cocoon area), also south of the Vela pulsar. Since no wide field of view (FoV) observations of the synchrotron emission between radio and X-rays are available, we do not know how the lepton () spectra of these two components connect and how the morphology changes with energy. Currently we find that two distinct lepton spectra describe the respective radio and X-ray/VHE -ray spectra, with a field strength of G self-consistently describing a radiation spectral break (or energy maximum) in the multi-TeV domain as observed by H.E.S.S. (if interpreted as IC radiation), while predicting the total hard X-ray flux above 20 keV (measured by the wide FoV INTEGRAL instrument) within a factor of two. If this same field strength is also representative of the radio structure (including filaments), the implied IC component corresponding to the highest radio frequencies should reveal a relatively bright high energy -ray structure and Fermi LAT should be able to resolve it. A higher field strength in the filaments would however imply fewer leptons in Vela X (catalog ) and hence a fainter Fermi LAT signal.
1 Introduction
The Vela-Puppis region was first identified as a bright radio region by McGee, Slee & Stanley (1955). Rishbeth (1958) compared Vela X (catalog ), Y and Z (the radio counterparts of the Vela SNR) and remarked that Vela X (catalog ) is the most prominent radio feature, with the specific distinction of having an almost flat radio spectrum. A total Vela X (catalog ) radio energy spectrum of the form was measured by Alvarez et al. (2001), which was based on flux measurements up to 8.4 GHz. However, between 8.4 and 30 GHz, Hales et al. (2004) resolved the filamentary and PWN structures and found that the spectra are overall harder: Whereas the PWN spectrum is , the filamentary spectrum is of the form .
Following EGRET observations of the Vela region, de Jager et al. (1996a) showed that the observation of inverse Compton (IC) scattered HE -rays from the electron component producing this radio component, should allow us to constrain the maximum radio frequency and associated field strength. This electron component should IC scatter three target photon components: the Cosmic Microwave Background Radiation (CMBR) field, the Galactic far infrared radiation (FIR) field as a result of reradiation of dust grains, and the local starlight field (Porter et al., 2007).
Further insight into the nature of Vela X (catalog ) was revealed by the detection of a cocoon of X-ray emission south of the Vela pulsar by ROSAT (Markwardt & Ögelman, 1995). The X-ray data (with limited energy extent up to 2.4 keV) was shown to be consistent with a thermal origin, but recently LaMassa, Slane & de Jager (2008) used XMM-Newton observations of the southern head of this cocoon to show that the addition of a non-thermal synchrotron component with photon index as steep as is favoured by the data. By rescaling the H.E.S.S. flux relative to the XMM-Newton FoV, a field strength of G was found. Milne (1995) also identified a bright radio filament running along this cocoon and models for such filaments require a strong thermal component, pulsar-generated magnetic flux and relativistic particles (Reynolds, 1988).
Conclusive proof for the existence of relativistic particles in the X-ray cocoon was revealed by H.E.S.S. observations of the Vela region (Aharonian et al., 2006). In fact, H.E.S.S. detected a spectral maximum from Vela X (catalog ), which allows us to probe the low energy spectral component, as well as the energy at which the spectral turnover occurs. An overlay of the H.E.S.S. image is shown in Fig. 8 of de Jager & Djannati-Ataï (2008), showing the overlap of the VHE -ray cocoon and the bright radio filament referred to by Milne (1995). Whereas a hadronic interpretation was suggested by Horns, Aharonian & Santangelo (2006), de Jager (2007) and de Jager & Djannati-Ataï (2008) reviewed evidence in favour of a leptonic IC origin. Recently LaMassa, Slane & de Jager (2008) also found that the thermal particle density at the head of the cocoon where bright VHE -ray emission was found, is only 0.1 cm-3 - a factor 6 lower than the lower limit employed by Horns, Aharonian & Santangelo (2006). This places more stringent constraints on the brightness of a hadronic signal from Vela X (catalog ).
Mangano et al. (2005) derived an X-ray photon index of within a distance of 0.5 arcmin from the pulsar. This index represents the uncooled (by synchrotron losses) electron spectral index injected into the PWN, since a steepening is observed for distances greater than 0.5 arcmin. The corresponding uncooled post shocked electron spectral index of 2.0 is also consistent with the pre-break spectral index detected by H.E.S.S., if the signal from the latter has an inverse Compton origin.
de Jager (2007) has shown that Vela X (catalog ) most likely consists of a 2-component non-thermal spectrum: From Fig. 2 of de Jager (2007) the lepton spectrum corresponding to the VHE -ray spectrum only connects to the radio lepton spectrum if the field strength of the radio structure is G, if we extrapolate the uncooled lepton index of 2.0 towards the radio domain. However, the field strength in the radio filaments is more likely to be in the range 10 to 50 G (Milne, 1995).
The observation of an X-ray photon index in the cocoon by LaMassa, Slane & de Jager (2008) may be due to synchrotron cooling inside the X-ray band (below 7 keV) and to test this we need hard X-ray observations with a FoV covering the full size of Vela X (catalog ). Only INTEGRAL (20 - 300 keV) has a large enough FoV to cover the extended Vela X (catalog ) (and by default cocoon) region. However, only point-like unpulsed emission centered on the pulsar (consistent with the 12 arcmin PSF) with a photon index of was detected by INTEGRAL (L. Kuiper, personal communication, 2007). Thus, synchrotron burnoff must have terminated most emission above 20 keV at distances arcmin from the pulsar to levels consistent with the sensitivity of INTEGRAL. This spectrum is consistent with the OSSE spectrum reported by de Jager et al. (1996b), covering at least the total cocoon region. The BeppoSAX PDS, with a FoV of (FWHM), also observed the Vela pulsar above 20 keV, covering most of the cocoon region (Mangano et al., 2005). Although the observed photon index of the nebula is slightly steeper (), the energy flux is comparable to that of INTEGRAL.
In this paper we construct a time dependent post shocked injection spectrum (with the lepton energy). This spectrum consists of two components (as motivated a above): as source for the extended radio emission and as source for the X-ray and VHE -ray emission, confined mostly to the cocoon region. In this paper Fermi LAT observations should be able to test the spectral connection between and .
These two distinct source spectra are normalised to the time averaged spindown power, giving conversion efficiencies and of spindown power to leptons. The time dependent transport equation with synchrotron losses is then solved to produce the present time electron spectra and . The field strength required for the synchrotron loss term is obtained from H.E.S.S. observations, if we assume that the VHE -ray signal is the result of IC scattering. Since H.E.S.S. measured the spectral energy maximum, we find the magnetic field strength which reproduces the observed multi-TeV spectral break, so that is uniquely determined in the energy range 5 to 100 TeV. We then show that this same (with derived from the VHE spectral break) also predicts the total hard X-ray flux from the PWN measured by INTEGRAL correctly within a factor two. For we also show that (with the abovementioned ) reproduces the total integrated radio flux, which in turn predicts a high energy -ray component, which can be tested with Fermi LAT.
2 The double source spectrum of Vela X
In the discussion below we will neglect (to a first order) the effect of adiabatic cooling on the spectrum (Pacini & Salvati, 1973) since the reverse shock (applicable to Vela X (catalog )) is expected to have adiabatically heated the particles during the PWN crushing phase. Energy losses due to adiabatic cooling during the pre-crushing phase is then partially cancelled during the crushing phase (Ferreira & de Jager 2008, in preparation).
Let and be the respective source spectra corresponding to the radio and X-ray synchrotron components, and be the time dependent spindown power, of which fractions and are converted to these two components. Based on the discussion in Section 1, we model these source spectra as
| (1) | |||
| (2) |
for and in the two respective equations. These upper and lower limits are currently weakly constrained by observations. The radio spectral index of 0.39 requires a particle index of , whereas an X-ray (VHE -ray) lepton spectral index of 2 would reproduce the uncooled photon spectral index of 1.5. By requiring the total energy in each respective component to be a fraction and (with ) of the spindown power, we can show that (with the minimum electron energy for the radio component much smaller than the corresponding maximum)
| (3) | |||
| (4) |
Neglecting adiabatic losses (as discussed above), but including radiation losses with timescale , where is the sum of the synchrotron and IC (Klein-Nishina effects included) energy loss rates, the transport equation can be solved to give the present day (age ) total particle spectrum for each component as (see e.g. Zhang, Chen & Fang (2008))
| (5) |
This expression effectively allows leptons to be accumulated over time in the nebula. The resulting spectrum is however modulated (steepened) at the high energy tail by radiation losses.
Since radiation losses are negligible for the radio component, the integral over the source term yields the change in rotational kinetic energy () since birth, as shown by de Jager (2008), so that (for )
| (6) |
The term is the time averaged conversion efficiency. van der Swaluw & Wu (2001) found that a pulsar birth period of to 50 ms is required to reproduce the observed ratio () between the PWN and SNR radius. The recently measured pulsar braking index (Dodson, Lewis & McCulloch, 2007) implies an age between and 15 kyr given the abovementioned range for . This range of values (or exact choice of braking index) do not change our conclusions significantly.
3 The particle, synchrotron and IC spectra of the cocoon
The lepton spectrum for the X-ray/VHE -ray emission region (mostly the cocoon region) derived from Eqn.(5) (parameters in Table 1) is constrained by the following information: an injection (uncooled) lepton spectral index of 2.0 as discussed in section 1, the IC normalisation of the VHE cocoon spectrum as provided by H.E.S.S. (Aharonian et al., 2006), the multi TeV break energy observed by H.E.S.S., spindown from ms to the current period of 89 ms within time ( to 15 kyr), an implied time averaged conversion efficiency of , and a field strength of G to reproduce the observed VHE break energy.
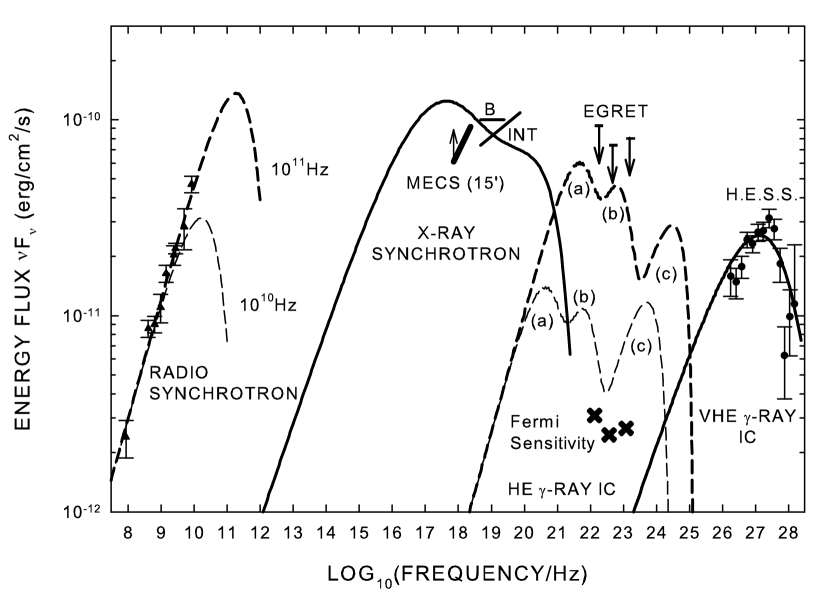
It is clear that this model IC spectrum agrees relatively well with H.E.S.S. measurements (Fig. 1 - thick solid line at very high -ray energies). The CMBR mostly contributes to this spectrum, whereas higher energy contributions from the galactic FIR and starlight photon fields are suppressed due to Klein Nishina effects. However, in the next section we will see that the latter two radiation fields contribute significantly to the high energy IC -ray counterpart of the radio spectrum, where the IC scattering is in the Thomson limit.
The lepton spectrum of the cocoon, if self-consistent, should be able to predict the total X-ray spectrum from Vela X (catalog ). From Fig. 1 it is clear that the model synchrotron spectrum shows a radiation break around 1 keV ( to Hz) and predicts the 20 - 300 keV INTEGRAL flux within a factor 2, although with a steeper spectrum. The latter is expected to harden if we allow the field strength to increase towards the pulsar in a more sophisticated model incorporating a spatial dependence as well.
4 The particle, synchrotron and IC spectra of the total Vela X PWN
To first order we assumed the same field strength (G) of the entire Vela X (catalog ) structure as found for the cocoon (LaMassa, Slane & de Jager, 2008). This may not be the case, but by comparing Fermi LAT with high frequency radio observations we should be able to measure the field strength in this extended structure if the high frequency (radio) cutoff or turnover can be independently determined. In this case synchrotron cooling is negligible and the steady state spectrum is given by Eqn (6). To reproduce the absolute radio flux (for a particle index of ) we had to assume efficiencies of and 0.45 corresponding to the assumed spectral cutoffs Hz and Hz respectively. The leptonic parameters corresponding to the latter cutoff is listed in Table 1 under “radio”. From Fig. 1 it is clear that the maximum frequency should be Hz.
While the lack of high-frequency radio measurements prohibits a clear constraint on the cutoff of this component, Fermi LAT observations can constrain the maximum of the spectral energy distribution of leptons in the radio nebula. As an example we employ cutoffs at the abovementioned two frequencies to calculate the corresponding expected high energy -ray spectra. These predictions are shown as dashed lines in Fig. 1 (marked “HE -ray IC”). The hard lepton spectrum followed by an assumed cutoff at an electron energy should produce broad -ray features at three energies: corresponding to the temperatures K (CMBR), 25K (FIR) and K to K (starlight).
Although these energy densities are comparable in the local neighbourhood (Porter et al., 2007), we investigate deviations at the location of Vela X: The IRAS-Vela shell (catalog ) (IVS) of dark clouds and cometary globules centered on (, ) with a radius of and annular RMS width of is located at a distance pc (Testori et al, 2006). With a m IRAS ring flux of MJy/sr we obtain a luminosity of erg/s, and assuming a distance of pc between the IVS center and Vela X, we obtain an additional FIR energy density of eV/cm3 at Vela X, which is well below our assumed local averaged energy density. Other potential target photon fields from the Vela molecular ridge and Gum Nebula are located directly behind the Vela pulsar (Sahu, 1992) so that the contribution from these local clouds would be severely suppressed by the head-on-tail effect of the IC process, since the term (with small) in the energy loss rate term is much less than unity.
Furthermore, fluctuations in the local distribution of stars can also produce deviations in the starlight energy density at Vela X. To investigate this we extracted the Hipparcos catalog of stars, of which have parallax measurements at the detection level. This subset was used to calculate the starlight energy density at any 3D field point within pc from Earth. Within pc from Earth we obtain a value of eV/cm3, consistent with Porter et al. (2007), whereas a value of eV/cm3 is obtained for the Vela PWN, with the error reflecting the uncertainty in the distance to the Vela pulsar (Dodson et al., 2003). This mean value (0.44 eV/cm3) was used in Fig. 1, but assuming a mean temperature of 7500 K to account for the stellar types contributing to this excess.
Whereas the Fermi LAT webpage 111 only lists sensitivities for point sources, we scale the actual EGRET upper limits for the Vela X extended source (extracted from the unpulsed skymaps) obtained by de Jager et al. (1996a) by a conservative factor of 30 downward to account for the improved Fermi LAT sensitivity in the same energy bands for an integration time of 1 year. The EGRET integral flux upper limits and GLAST/Fermi LAT sensitivities are shown in Fig. 1.
5 Discussion and Conclusion
In this paper we have shown that a pulsar birth period of ms (to reproduce the observed ratio of PWN to SNR radii), spinning down within 11 to 15 kyr to the present period of 89 ms while converting of its spindown power to leptons (e±) in the PWN with a spectral index of 2, would reproduce the observed H.E.S.S. flux in the Vela X (catalog ) cocoon via the IC process. A nebular averaged field strength of G would also reproduce the observed TeV spectral break, Furthermore, this same spectrum predicts the BeppoSAX PDS and INTEGRAL total fluxes within a factor of two.
Assuming the same 5G field strength in the much larger Vela X (catalog ) radio nebula, we need to invoke a second e± component with electron spectral index 1.78 and a much larger conversion efficiency to reproduce the observed total radio spectrum up to at least 8.9 MHz and possibly 30 MHz. This spectrum should cut off or steepen significantly to meet the less energetic cocoon spectrum.
The implication of this second (radio) component is the prediction of an IC component at HE -rays covering the same area south of the pulsar. The visibility of this component in the HE -ray domain for Fermi LAT is further improved due to the existence of the local FIR and starlight target photon fields, scattered by the highest energy leptons in this second component up to GeV -rays (in the Thomson limit) where Fermi LAT has good sensitivity.
If the electrons radiating the radio component are trapped in compressed regions (e.g. filaments) with field strength G, we would require fewer leptons and hence lower efficiency to reproduce the radio emission. A HE -ray flux measurement, or upper limit thereof, will provide constraints on this field and hence .
References
- Aharonian et al. (2006) Aharonian, F.A., et al. (H.E.S.S. Collaboration), 2006, A&A, 448, L43
- Alvarez et al. (2001) Alvarez, H., Aparici, J., May, J., & Reich, P. 2001, A&A, 372, 636
- de Jager et al. (1996a) de Jager, O.C., Harding, A.K., Sreekumar, P., & Strickman, M. 1996, A&AS., 120, 441
- de Jager et al. (1996b) de Jager, O.C., Harding, A.K., Strickman, M.S. 1996, ApJ, 460, 729
- de Jager (2007) de Jager, O.C. 2007, ApJ, 658, 1177
- de Jager (2008) de Jager, O.C. 2008, ApJ, 678, L113
- de Jager & Djannati-Ataï (2008) de Jager, O.C. & Djannati-Ataï, A. 2008, to appear in Springer Lecture Notes on Neutron Stars and Pulsars: 40 years after their discovery, eds. W. Becker, arXiv:0803.0116v1 (astro-ph)
- Dodson et al. (2003) Dodson, R., Legge, D., Reynolds, J. E. & McCulloch, P. M. 2003, ApJ, 596, 1137
- Dodson, Lewis & McCulloch (2007) Dodson, R, Lewis, D. & McCulloch, P. 2007, Ap&SS, 308, 585
- Hales et al. (2004) Hales, A.S., Casassus, S., Alvarez, H., May, J., Bronfman, L., Readhead, A.C., Pearson, T.J., Mason, B.S. & Dodson, R., ApJ, 613, 977
- Horns, Aharonian & Santangelo (2006) Horns, D., Aharonian, F.A., & Santangelo, A., et al. 2006, A&A, 451, L51
- LaMassa, Slane & de Jager (2008) LaMassa, S., Slane, P.O. & de Jager, O.C. 2008, submitted to ApJ
- Mangano et al. (2005) Mangano, V., Massaro, E., Bocchino, F., Mineo, T. & Cusumano, G. 2005, A&A, 436, 917
- Markwardt & Ögelman (1995) Markwardt, C.B. & Ögelman, H. 1995, Nature, 375, 40
- McGee, Slee & Stanley (1955) McGee, R.X., Slee, O.B., & Stanley, G.J. 1955, Aust. J. Phys., 8, 347
- Milne (1995) Milne, D.K. 1995, MNRAS, 277, 1435
- Pacini & Salvati (1973) Pacini, F. & Salvati, M. 1973, ApJ, 186, 249
- Porter et al. (2007) Porter, T.A., Digel, S.W., Grenier, I.A., Moskalenko, I.V., & Strong, A.W. 2007, in Proc. 30th ICRC, Merida, Mexico, arXiv:0706.0221 (astro-ph)
- Reynolds (1988) Reynolds, S.P 1988, ApJ, 327, 853
- Rishbeth (1958) Rishbeth, H. 1958, Aust. J. of Phys., 11, 550
- Sahu (1992) Sahu, M.S. 1992, Ph.D Thesis, Univ. of Groningen
- Testori et al (2006) Testori, J.C., Arnal, E.M., Morras, R., Bajaja, E., Pöppel, W.G.L., & Reich, P. 2006, A&A, 458, 163
- van der Swaluw & Wu (2001) van der Swaluw, E. & Wu, Y. 2001, ApJ, 555, L49
- Zhang, Chen & Fang (2008) Zhang, L., Chen, S.B., & Fang, J. 2008, ApJ, 676, 1210
| (eV) | (Hz) | (erg) | ||||
|---|---|---|---|---|---|---|
| radio | 0.35 | 1.78 | ||||
| radio | 0.45 | 1.78 | ||||
| X-ray | 0.003 | 2.0 |