Characterization of AGN and their hosts in the Extended Groth Strip: a multiwavelength analysis.
Abstract
We have employed a reliable technique of classification of Active Galactic Nuclei (AGN) based on the fit of well-sampled spectral energy distributions (SEDs) with a complete set of AGN and starburst galaxy templates. We have compiled ultraviolet, optical, and infrared data for a sample of 116 AGN originally selected for their X-ray and mid-infrared emissions (96 with single detections and 20 with double optical counterparts). This is the most complete compilation of multiwavelength data for such a big sample of AGN in the Extended Groth Strip (EGS). Through these SEDs, we are able to obtain highly reliable photometric redshifts and to distinguish between pure and host-dominated AGN. For the objects with unique detection we find that they can be separated into five main groups, namely: Starburst-dominated AGN (24 % of the sample), Starburst-contaminated AGN (7 %), Type-1 AGN (21 %), Type-2 AGN (24 %), and Normal galaxy hosting AGN (24 %). We find these groups concentrated at different redshifts: Type-2 AGN and Normal galaxy hosting AGN are concentrated at low redshifts, whereas Starburst-dominated AGN and Type-1 AGN show a larger span. Correlations between hard/soft X-ray and ultraviolet, optical and infrared luminosities, respectively, are reported for the first time for such a sample of AGN spanning a wide range of redshifts. For the 20 objects with double detection the percentage of Starburst-dominated AGN increases up to 48%.
1 Introduction
The role of AGN in the formation and evolution of galaxies is still not well established. It is not clear whether AGN represent episodic phenomena in the life of galaxies, are random processes (given that the Supermassive Black Hole is already there), or are more fundamental. Some authors claim that AGN are key in quenching the star formation bursts in their host galaxies (Granato et al., 2004; Springel et al., 2005). It has also been shown that the mass dependence of the peak star-formation epoch appears to mirror the mass dependence of Black Hole (BH) activity, as recently seen in redshift surveys of both radio-and X-ray-selected active galactic nuclei (Waddington et al., 2001; Hasinger, 2003b). For these reasons, searching for signatures of AGN feedback in the properties of AGN host galaxies is one of the most promising ways of testing the role of AGN in galaxy evolution.
One way of finding variations in the AGN population with redshift is to compare their SEDs defined over a broad wavelength range. The SED of an AGN can reveal the presence of the underlying central engine, together with the luminosity of the host galaxy, the reddening, and the role of the star formation in the various frequency regimes. SED determination in samples of AGN at different redshifts is an efficient method to search for evolutionary trends. Accuracy in the photometry and a filterset spanning a broad wavelength range are required to characterize correctly different types of AGN.
Multiwavelength surveys are fundamental in the study of active galactic nuclei, since these appear considerably different depending on the wavelength range of consideration. The hard X-ray selection of AGN using deep observations is one of the most reliable methods of finding AGN (Mushotzky, 2004), although a percentage of them remains undetected using this technique (Peterson et al., 2006), specially the most highly obscured objects. For this reason, it is important to characterize AGN at different wavelength ranges, in order to be capable of identifying them by more than one selection technique, and to distinguish between the different groups of active nuclei, including those that could be contaminated, or even hidden, by starbursts. Mid-infrared surveys have been very successful in finding X-ray undetected AGN in large numbers, but in this case it is crucial to distinguish the AGN from the non-active star-forming galaxies. This can be achieved using typical mid-infrared colors of AGN (Lacy et al., 2004; Stern et al., 2005; Alonso-Herrero et al., 2006; Donley et al., 2008) or by combining mid-infrared and radio detections (Donley et al., 2005; Alonso-Herrero et al., 2006; Martínez-Sansigre et al., 2005, 2007; Lacy et al., 2007; Park et al., 2008).
The Extended Groth Strip ( = 14h 17m, = 52o 30’) enlarges the Hubble Space Telescope Groth-Westphal strip (Groth et al., 1994) up to 2ox15’, having the advantage of being a low extinction area in the northern sky, with low galactic and zodiacal infrared emission, and good schedulability by space observatories. For these reasons, there is a huge amount of public data at different wavelength ranges that only require to be compiled and cross-correlated in a consistent way. The overall majority of the observational work in the EGS have been coordinated by the AEGIS proyect111The AEGIS project is a collaborative effort to obtain both deep imaging covering all major wavebands from X-ray to radio and optical spectroscopy over a large area of sky. http://aegis.ucolick.org/index.html (Davis et al., 2007).
With the huge amount of data available for this region of the sky, we have constructed a robust AGN sample, detected in the X-rays and in the mid-infrared, intermediate in depth and area in comparison with other surveys (Jannuzi & Dey, 1999; Dickinson et al., 2001; Lonsdale et al., 2003; Eisenhardt et al., 2004; Franceschini et al., 2005). The photometry has been performed over the publicy available images, in several bands, in order to compile as best-sampled SEDs as possible. The biggest advantage of our AGN sample, compared with other works, is the robustness of the photometry, performed in a consistent way among the different bands, and its multiwavelength nature: it is the most complete compilation of data for such a big sample of AGN in the EGS. This allows us to determine accurate photometric redshifts, and to distinguish clearly between the different groups of AGN. We have used a comprenhensive set of AGN plus starburst templates from Polletta et al. (2007), to fit the SEDs of the galaxies in the sample, and to separate them in five different main groups. Through this classification, we can study the properties of the different types of AGN in this sample. Section 2 describes the sample and the cross-matching of the multiwavelength data, Section 3 explains the technique of classification of AGN based on the fit of their spectral energy distributions, in Section 4 the results of this paper are discussed, and finally in Section 5 the main conclusions are summarized. Throughout this paper we assume an H0=75 km s-1 Mpc-1 and a CDM cosmology with =0.3 and =0.7.
2 Sample and multi-wavelength data
The sample studied in this work, that comprises 116 AGN candidates, was built from the previously published X-ray catalogs found in Waskett et al. (2003), Nandra et al. (2005), and Barmby et al. (2006). These objects were originally selected by Barmby et al. (2006), both in the X-ray (Chandra and XMM-Newton) and in the mid-infrared (Spitzer). The X-ray and mid-infrared observations in the EGS are intermediate in depth and area between GOODS (Dickinson et al., 2001), the shallower NOAO Deep-Wide Field (Jannuzi & Dey, 1999; Eisenhardt et al., 2004), and SWIRE (Lonsdale et al., 2003) surveys. Therefore, this region provides a valuable test of AGN properties at intermediate fluxes. In addition to this, we have compiled ultraviolet, optical, and near-infrared archival data for these AGN, in order to increase the definition of their SEDs. These well-sampled SEDs allow us, first, to classify the objects in different galaxy population groups and calculate their photometric redshifts, and secondly, to study the physical properties of this representative sample of AGN.
The Chandra data were taken with ACIS-I in 2002 August (Nandra et al., 2005), consisting of a 200 ks exposure with a limiting full-band flux (0.5-10 keV) of 3.5x10⁻¹⁶ erg cm-2 s-1. The XMM-Newton data were obtained in 2000 July with a 56 ks exposure and with a limiting 0.5-10 keV flux of 2x10-15 erg cm-2 s-1 (Waskett et al., 2003). Barmby et al. (2006) combined both catalogues producing a list of 152 sources within the limits of the Spitzer mid-infrared observations.
The Spitzer data (IRAC and MIPS) are part of the Infrared Array Camera Deep Survey, taken during 2003 December and 2004 June-July with 2.7 hr exposure per pointing. In the case of the MIPS data, the observations were done in 2004 January and June with a depth of 1200 s per pointing. The 5 limiting AB magnitudes are 24.0, 24.0, 21.9, and 22.0 for the IRAC bands, and 19.1 in the case of MIPS. Barmby et al. (2006) finally selected 138 objects with secure detections in all four IRAC bands, out of the 152 X-ray emitters. The detection of these objects in both the X-rays and the mid-infrared gives confidence in their classification as AGN. Besides, we have also checked that the values of the hard X-ray and 24 µm fluxes lie inside the AGN-characteristic region (see Figure 1 of Alonso-Herrero et al. (2004)).
In addition to the previous, we have compiled near and far-ultraviolet images from the GALEX GR2/GR3 data release (3 limiting AB magnitudes = 25 in both Far- and Near-UV filters); optical images from the CFHT Legacy Survey, T0003 worldwide release (Gwyn et al., in preparation), taken with the MegaCam imager on the 4 m Canada-France Hawaii Telescope (Boulade et al., 2003) (5 limiting AB magnitudes = 26.3, 27.0, 26.5, 26.0, and 25.0 in u,g,r,i, and z bands); and J and KS data from the version 3.3 of the Palomar-WIRC K-selected catalog of Bundy et al. (2006), (5 limiting Vega magnitudes = 23 and 20.6 in the J and KS bands).
The fluxes employed in this work have been measured in a compilation of publicly available imaging data, which is outlined briefly in Villar et al. (2008) and will be described in detail in Barro et al., in preparation (see also Pérez-González et al. (2008b)). Photometry in consistent apertures was measured in all bands with available imaging data following the procedure described in Pérez-González et al. (2005, 2008a). In the near-infrared, no deep J- and KS-band imaging data were available and we have used the photometric catalogs published by Bundy et al. (2006). The same happens with the X-ray data, that have been drawn from the catalogs (Waskett et al., 2003; Nandra et al., 2005; Barmby et al., 2006).
We have performed the cross-matching of the 138 sources between the X-ray and Spitzer data, adding ultraviolet, optical, and near-infrared data points, avoiding the false matches that Barmby et al. (2006) expected in their sample. We identify these objects through their IRAC positions in our merged photometric catalog (Pérez-González et al., 2005, 2008a). The source coordinates on the IRAC 3.6 µm images are then cross-correlated with each one of the ultraviolet, optical and near-infrared catalogs using a search radius of 2.5″ , starting with the deepest images. When a source is identified in one of these images, the Kron (1980) elliptical aperture from this reference image is taken and overlaid onto each of the other bands. The aperture employed is large enough to enclose the PSF in all the ultraviolet, optical and near-infrared images (the seeing being less than 1.5″). For IRAC and MIPS, because of their large PSFs, integrated magnitudes measured in small apertures (applying aperture corrections) are employed. The hard and soft X-ray fluxes are obtained by cross-correlating the IRAC positions with the X-ray catalogs, using a search radius of 2″ in this case. Uncertainties of each measured flux are obtained from the sky pixel-to-pixel variations, detector readout noise, Poisson noise in the measured fluxes, errors in the World Coordinate System, and errors in the absolute photometric calibration.
In some cases, for a single IRAC source, there are several counterparts in the ground-based images within the 2.5″ search radius. For these objects, the ground-based optical/near-infrared reference image is used to determine the positions of each source separately. The IRAC images are then deconvolved using the IRAC PSFs. Although the IRAC PSFs have FWHMs of aproximately 2″, determination of the central position of each IRAC source can be performed more accurately, and sources can be resolved for separations 1″ from each other. IRAC fluxes are then remeasured by fixing the positions of the objects in each pair, and by scaling the flux of each object in an aperture of 0.9″. For a more detailed description of the cross-matching and aperture photometry see Pérez-González et al. (2005, 2008a).
Out of the 138 sources that comprise the final sample chosen by Barmby et al. (2006), we find 96 sources that have unique detections in all bands, plus other 20 objects with double detection in the ground-based images. We discard the remaining 22 objects because 21 of them show multiple (more than two) detections in the optical/near-infrared images, leading to possible source confusion, plus another object that shows a star-like SED. The analysis of the data will be done first for the 96 objects that are definitely free from contamination from other sources. Nevertheless, in Section 4.5, we analyse the images and photometric redshifts of those additional 20 objects with double detection.
3 Spectral energy distributions and photometric redshifts of objects with unique detection.
In order to classify the 96 spectral energy distributions and to estimate their photometric redshifts, we combine optical (u,g,r,i,z), near-infrared (J,K), and mid-infrared data (IRAC 3.6, 4.5, 5.8, 8 µm and MIPS 24 µm) to build well-sampled SEDs that we then fit with the library of starburst, AGN and galaxy templates taken from Polletta et al. (2007). We make use of the photometric redshift code HyperZ (Bolzonella et al., 2000) to perform the fits. This code determines the best photometric redshifts (zphot) by minimization of the derived from a comparison between the photometric SEDs and the set of template spectra, leaving the redshift as a variable. The code also takes into account the effects of dust extinction according to the selected reddening law (Calzetti et al., 2000). Choosing a wide range of reddening values seems to be essential to reproduce the SEDs of high redshift galaxies (Bolzonella et al., 2000). According to Steidel et al. (1999), the typical E(B-V) for galaxies up to z 4 is 0.15 mag, thus AV 0.6 mag when using the Calzetti’s law. The maximum AV allowed in our calculations is about 2 times this value, thus AV ranges from 0.0 to 1.2, with a step between them of 0.3. Similar values of AV are typically chosen in the literature (Bolzonella et al., 2000; Babbedge et al., 2004).
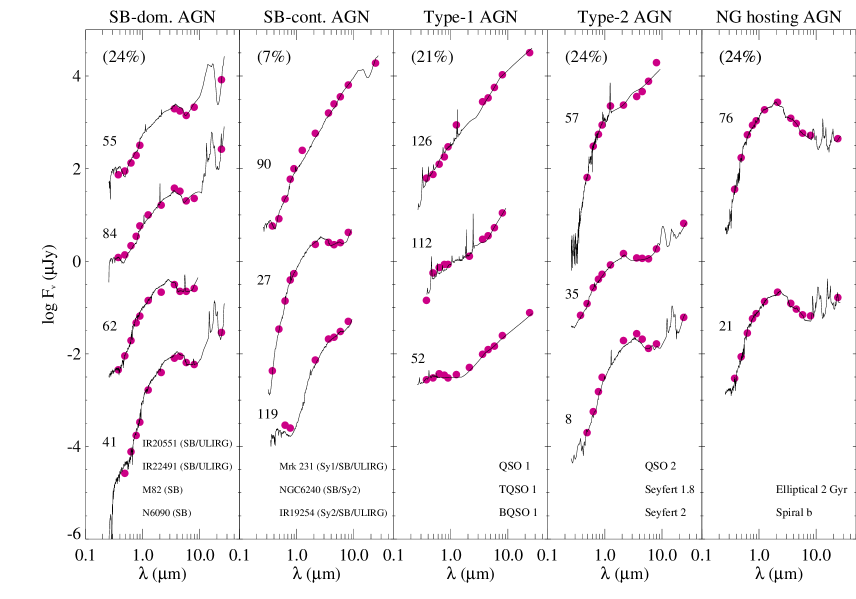
The chosen set of templates contains 23 SED-types, that we have arranged into the following five main groups: Starburst-dominated AGN (which includes four Starbursts and Starburst/ULIRGs templates), Starburst-contaminated AGN (three templates, namely: Starburst/ULIRG/Seyfert 1, Starburst/Seyfert 2, and Starburst/ULIRG/Seyfert 2), Type-1 AGN (three Type-1 QSO templates), Type-2 AGN (Type-2 QSO, Torus-QSO, Seyfert 1.8, and Seyfert 2 templates), and finally, Normal galaxy hosting AGN (nine templates including 2, 5, and 13 Gyr ellipticals plus S0, Sa, Sb, Sc, Sd, Sdm type spirals). These templates span the range in wavelength between 0.1 and 1000 µm. For a detailed explanation of their synthesis see Polletta et al. (2007). Our main interest is to classify all of our sources into these five main groups and to determine the distribution of the sources into each of these groups. Notice that although all of the sources are AGN, the Starburst-dominated AGN have their SEDs dominated by the starburst emission from the optical to the mid-infrared; the Normal galaxy hosting AGN would be low-luminosity AGN embeded in an otherwise normal galaxy emission; and in the case of the Starburst-contaminated AGN, the emission of both the starburst or the AGN dominate depending on the wavelength we are looking at. Indeed, some of these objects show noticeably the AGN power-law beyond the near-infrared.
We fit data from the optical band up to the MIPS 24 µm band. We avoid the use of GALEX data because few galaxies have these, and because their use introduce big errors in the fits. As explained in Polletta et al. (2007), including mid-infrared data improves considerably the photometric redshift calculations, since some spectral types suffer degeneration that is broken by the non-extinguished longer wavelengths, even if the errors in the magnitudes are larger in the mid-infrared than in the optical and near-infrared bands.
Examples of HyperZ fits for each of the employed templates are shown in Figure 1. In the Type-2 AGN pannel, only three templates are shown because none of the 96 galaxies were fitted with the Torus-QSO template. The Normal galaxy hosting AGN pannel contains only one example of elliptical template (the 2 Gyr elliptical) and one example of spiral (Sb). See Table 1 to check the SED types and their corresponding group. Photometric redshifts derived from the fits are reported in Table 1, together with the and probabilities given by HyperZ, the AV, and the template used for the fit of each galaxy. In the cases where spectroscopic redshifts are available, these are also given in Table 1.
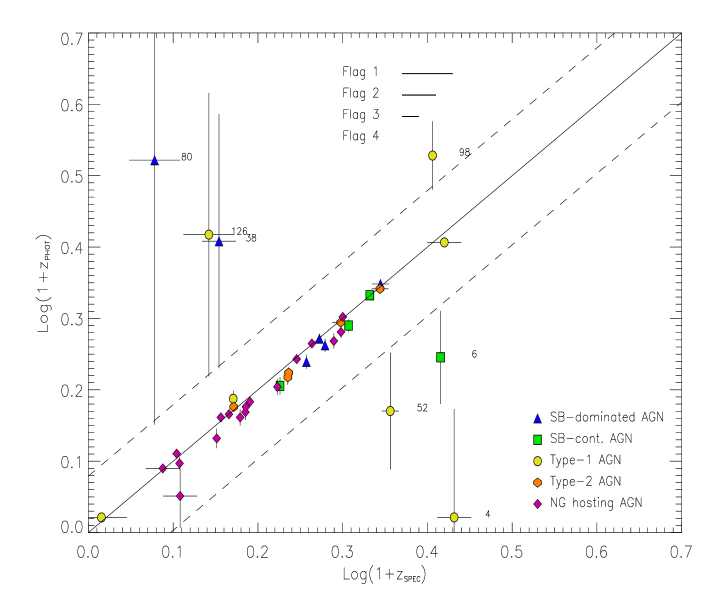
A comparison between the photometric and spectroscopic redshifts for the 39 sources with publicly available from the DEEP data archive (Weiner et al., 2005) is shown in Figure 2. Notice that only 31 out of these 39 galaxies have reliable spectroscopic redshifts (flag = 3 or 4 in the DEEP data archive). Horizontal error bars indicating the reliability of the are represented in Figure 2, together with vertical error bars that indicate the discrepancies between the and . The dashed lines represent 20% agreement in (1+). The fractional error z= quantifies the number of catastrophic outliers, which are those with 0.2. Our measured mean z for the 39 sources with spectroscopic redshifts is 0.05, with a = 0.37, and an outlier fraction of 18%, corresponding to seven discordant objects, labelled in Figure 2. However, if we consider only the 31 objects with reliable (flags = 3 or 4), z = -0.03, and = 0.11, with three outliers (8%). These results point to the goodness of our fits, and thus we rather trust our photometric redshifts better than the spectroscopic ones for the outliers indicated (all of them with with flags = 1 or 2 in the DEEP database). We nevertheless note a slight underestimation of our photometric redshifts (see Figure 2) in comparison with the spectroscopic ones (z = -0.03). Although this effect is negligible, we are aware of it, and we assume that all the calculated zphot’s might be affected by this slight underestimation.
Based on the good agreement between spectroscopic and photometric redshifts in this fairly large subsample of sources (the results shown are better than those typically obtained for AGN samples (Babbedge et al., 2004; Kitsionas et al., 2005; Bundy et al., 2008) and with practically the same and outlier fraction than those reported by Polletta et al. (2007)), we can confidently extrapolate the results to the rest of the sample. This, together with the SED classification into the five groups described above, allows us to perform a reliable statistical analysis of the different AGN populations.
It is worth to mention that the distribution of object type in the subsample with spectroscopic redshifts is completely different from the total sample. Considering only the 31 objects with highly reliable zspec, there are 4 Starburst-dominated AGN, 4 Starburst-contaminated AGN, 3 Type-1 AGN, 5 Type-2 AGN, and 15 Normal galaxy hosting AGN. Thus, it is very difficult to check the redshift failure rate for the different groups. Only for the Normal galaxy hosting AGN we can confirm the success in the redshift determination with this set of templates, since 50% of the total number of objects fitted with elliptical or spiral templates have zspec to compare with. Due to the flat and featureless SED typical of Type-1 QSOs, the Type-1 AGN group of templates could produce the less reliable photometric redshifts of the sample (Franceschini et al., 2005). We can not discard then that any subset of templates produces higher redshift failure rates than others, but looking at the distribution of the objects belonging to the different groups of AGN in the various diagnostic diagrams in the following sections, and at the correlations displayed by them, we are confident that our SED classification and redshift determination are as good as for the Normal galaxy hosting AGN for the rest of the groups.
4 Discussion
4.1 Classification by SEDs and photometric redshift distribution of the sample.
Together with the photometric redshift calculations reported in the previous section, we obtain spectral energy distribution fits, that allow us to distinguish between different types of AGN populations, i.e., whether they are pure AGN, AGN hosted by starburst-dominated galaxies, or AGN in otherwise normal galaxies.
For the five main groups described before we obtain the following distribution: Starburst-dominated AGN (24 % of the sample), Starburst-contaminated AGN (7 %), Type-1 AGN (21 %), Type-2 AGN (24 %), and Normal galaxy hosting AGN (24 %).
We consider the Type-1 AGN, Type-2 AGN and Starburst-contaminated AGN as representative groups of AGN-dominated galaxies (since their SEDs are AGN-like at all or almost all wavelength ranges). The Starburst-dominated AGN and Normal galaxy hosting AGN are likewise considered AGN somehow masked by their host emission. With this simple classification, we find that 52% of the sample is AGN-dominated while 48% is host galaxy-dominated; i.e., half of the objects in the EGS sample of AGN show AGN-like SEDs while the other half show host-dominated SEDs. This is consistent with the finding that between 40% and 60% of the Chandra-selected galaxies in the Hawaii Deep Survey Field SSA13 and in the Chandra Deep Field North (Barger et al. (2001) and Hornschemeier et al. (2001), respectively) have optical spectra with no-signs of nuclear activity.
Also Barmby et al. (2006), based on the IRAC slopes ( 0 for the red power-law IRAC SEDs, and 0 for the blue ones) divided their sample in sources where the central engine dominates the IRAC SEDs and stellar-dominated galaxies. They found that 40% of the sources have red power-law SEDs, another 40% have blue host-dominated mid-infrared SEDs, and the remaining 20% could not be fitted with a power-law.
The method employed in this paper constitutes a powerful technique of classification of high redshift AGN provided we are able to procure well-sampled SEDs. This is important, for instance, for multi-band deep surveys of galaxies for which spectroscopic data will be necessarily scarce. Having SEDs over the largest wavelength range as possible is mandatory to identify the entire AGN population (Dye, 2008). Otherwise, depending on the observed wavelength, the galaxies could be missclasified. This is crucial, for example, for our Starburst-contaminated AGN, that in the optical range look like starburst galaxies, and towards redder wavelengths appear as Type-1 or Type-2 AGN. Dye (2008) finds also that the results of the SED fitting show little difference between two filtersets that span the same wavelength range, despite the number of filters used. Nevertheless, from our work, we find that including a large number of filters can reveal details in the SED shape that help the code choosing between different templates. This is crucial to distinguish among the different templates of a given group, for which little differences in the SED determine the type of object, or its age (Polletta et al., 2007).
We use now the classification of the galaxies obtained to investigate the properties of the different AGN groups. The distribution of redshifts for all the 96 objects with unique detection in our sample is shown in the top-left pannel of Figure 3. 58% of the sample have z1, with the rest of the sources distributed in a decreasing tail up to z=3. This is expected for X-ray selected samples with similar or even deeper flux limits (Hasinger, 2003a; Barger et al., 2005). Figure 3 also shows histograms for the photometric redshift distributions of the Starburst-dominated AGN, Starburst-contaminated AGN, Type-1 AGN, Type-2 AGN , and the Normal galaxy hosting AGN groups.
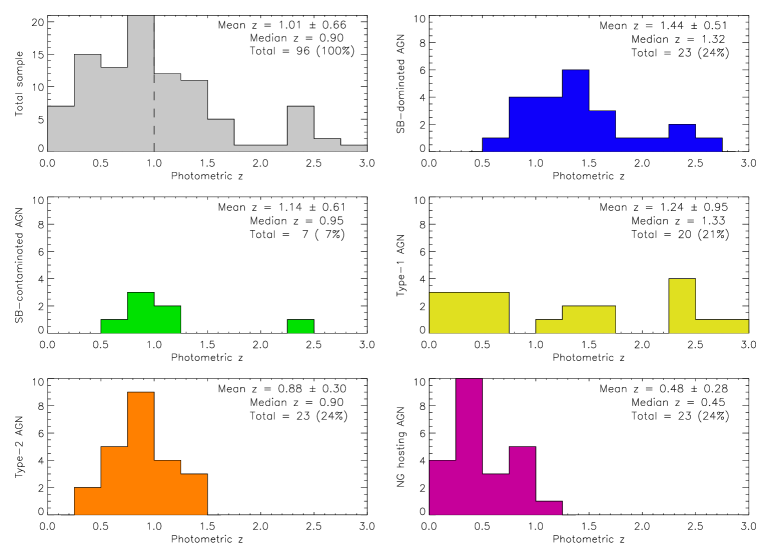
Type-2 AGN and Normal galaxy hosting AGN are concentrated at lower redshifts, whereas the Starburst-dominated AGN show a high concentration around zphot=1.3. The Type-1 AGN group has the largest spread in redshift, its mean value being zphot=1.240.95. The Starburst-contaminated AGN group contains only seven objects, six of them within the redshift range [0.6,1.2], the other having a zphot=2.45
This indicates that the Starburst-dominated AGN constitute the high-redshift population of AGN masked by powerful host emission, whilst the Normal galaxy hosting AGN group represents the low-redshift population of low-luminosity AGN also masked by their host galaxies. Previous studies suggest that most low luminosity AGN are found in massive, mostly spheroidal galaxies (Dunlop et al., 2003; Kauffmann et al., 2003; Grogin et al., 2005; Pierce et al., 2007). Something similar happens with the AGN-dominated group: the Type-1 AGN span a large redshift distribution, the Starburst-contaminated AGN are located at intermediate values of redshift, and finally, the Type-2 AGN are the low-z objects in this subsample.
Alonso-Herrero et al. (2004) found that 25% of their X-ray and 24 µm selected sources in both the EGS and the Lockman Hole (45 in total) show pure type-1 AGN SEDs, while more than half of the sample have stellar emission-dominated or obscured SEDs. Franceschini et al. (2005) detected 99 AGN in the X-rays and mid-infrared with Spitzer in the SWIRE survey (Lonsdale et al., 2003), sorting them in three main groups: Type-1 AGN (39%), Type-2 AGN (23%), and normal and starburst galaxies (38%). By adding Piccinotti et al. (1982) and Kuraszkiewicz et al. (2003) samples, there are 32 AGN with z0.12, also selected both in the hard X-rays and mid-infrared, with more than half of these sources being type-1 AGN according to their SEDs. Ours and other works (e.g., Alonso-Herrero et al. (2004); Franceschini et al. (2005)) performed with SED classification of X-ray and mid-infrared selected AGN in a wide range of redshift (up to z 2-3), when compared with the results obtained for local samples of AGN selected in the same bands, seem to indicate that the percentage of type-1 objects decreases with redshift, while the number of obscured AGN at high redshift increases.
Although the data used in this paper do not allow a deep study of the AGN feedback phenomenon, it is worth noticing that a redshift sequence can be readily seen in Figure 3. Indeed, the Starburst-dominated AGN would have the highest redshifts in a decreasing sequence that goes through the Type-1 AGN, Starburst-contaminated AGN, and Type-2 AGN, ending with the Normal galaxy hosting AGN group, that shows the lowest redshifts. This evolutionary sequence has been noticed for early-type galaxies by Schawinski et al. (2007). According to this recent work, the starbursts would start and be the dominant player after its onset. Subsequently, as the BH accretes enough mass, the AGN feedback reveals itself as the BH competes for the gas reservoir with the starbursts eventually quenching the star formation. The starburst phase thus declines, the AGN becoming dominant. The Starburst-contaminated AGN phase would be the transition phase mentioned by Schawinski et al. (2007). This process continue through lower ionization phases and it will end with the more quiescent Normal galaxy hosting AGN phases at lower redshifts.
4.2 Correlations
4.2.1 Correlations for the whole sample
One of the main advantages of the sample we are discussing is the multiwavelength coverage of the data, which allows us to study for the first time various correlations between ultraviolet/optical/infrared luminosities and X-ray luminosities for such a big AGN sample and within this range of redshift. The aim is to understand the behaviour of these sources in the different wavelength ranges.
Absolute magnitudes (MABS) computed by HyperZ in each filter using the photometric redshifts and the chosen cosmological parameters, are used here to derive luminosities for the 96 objects with unique detection. The HyperZ code provides the MABS (including the K correction) in the ultraviolet, optical, near- and mid-infrared filters considered. Regarding the X-ray data, the observed rest-frame hard and soft X-ray luminosities are obtained from the equation , where is the luminosity distance (cm), fX is the X-ray flux (ergs cm-2 s-1), and is the photon index. In this case, the K correction vanishes since we assume a photon index = 2 (Krumpe et al., 2007; Alexander et al., 2003; Mainieri et al., 2002), which is the canonical value for unobscured AGN (George et al., 2000). Obscured active nuclei have considerably flatter effective X-ray spectral slopes, due to the energy-dependent photoelectric absorption of the X-ray emission (Risaliti, Maiolino & Salvati, 1999). However, Mainieri et al. (2002) find the same intrinsic slope of the X-ray spectrum for both type-1 and type-2 AGN whatever their absorption levels, with 2 for an X-ray selected sample in the Lockman Hole. We therefore assume a photon index = 2 for either obscured and unobscured AGN, and consequently no K correction is needed for the X-ray luminosities.
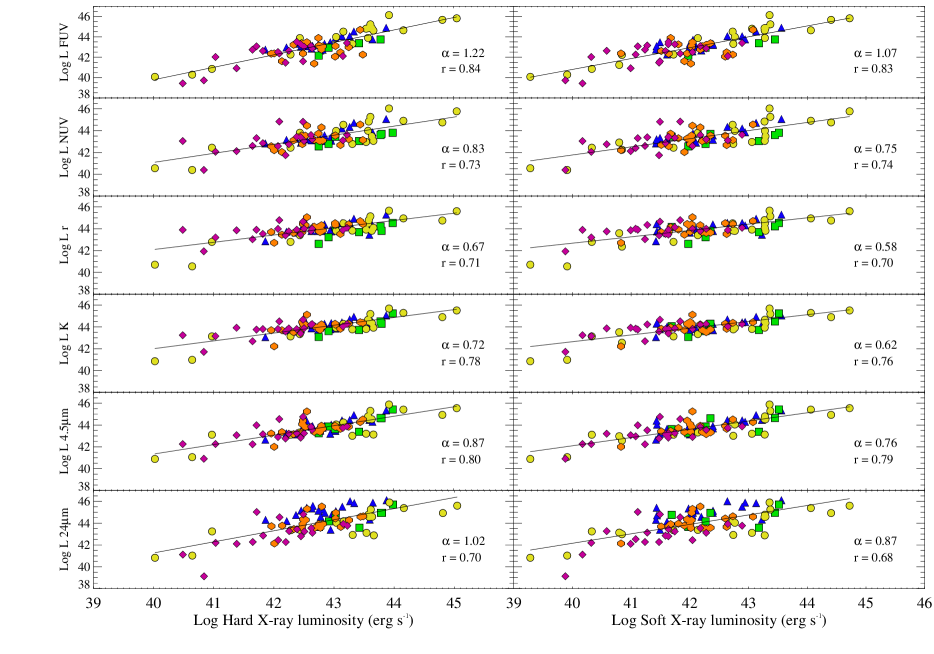
The first row of Table 2 shows the fitting slopes and correlation coefficients () of each scatter diagram between the far-UV/near-UV/ugriz/JK/IRAC/MIPS luminosities and the hard/soft X-ray luminosities for the fits including all the objects with unique detection. In all cases the Spearman’s rank correlation test has been performed, confirming that all the correlations are significant (p0.01). Examples of these correlations for the far-UV/near-UV/r/K/IRAC 4.5 µm /MIPS 24 µm luminosities and the hard/soft X-ray luminosities are shown in Figure 4.
The expected slopes for AGN-dominated objects should be close to unity, since if the active nucleus is the dominant emitting source at all wavelengths, tight linear correlations should be drawn. Reality is different, and AGN are actually hosted by different types of galaxies. As it has been seen in previous sections, these host galaxies contaminate or even mask the AGN emission, thus deviating correlations from linear and worsening them. Both the X-ray and mid-infrared emissions are mostly dominated by the active nuclei, whereas the optical and, to a lesser extent, the near-infrared bands are more affected by extinction, by stellar emission from the host galaxy, or by both. This is clearly reflected in the slopes and correlation coefficients (hereafter and ) of the global fits (see first row of Table 2). Although correlations are all significant, with both the slopes and correlation coefficients close to unity, they begin getting slightly blurred as wavelength increases from the bluest optical bands up to the K band, improving again in the mid-infrared. The blurring is more noticeable when soft instead of hard X-rays are considered, due to the higher obscuration that affects the lower energies.
Correlations between ultraviolet and X-ray luminosities are also good. The slopes are 1.2 and 1.1 for the far-UV versus both the hard and soft X-rays luminosities, respectively, in good agreement with early X-ray studies of AGN that find correlations between X-ray and ultraviolet monocromatic luminosities with similar slopes: LX L, with , thus 1.4-1.2 (Wilkes et al., 1994; Vignali et al., 2003; Strateva et al., 2005; Steffen et al., 2006). Nevertheless, this range of was determined by using 2 keV and 2500 Å luminosities, which correspond to soft X-rays and Near-UV, respectively. The slopes measured by us for the near-UV versus both the hard and soft X-rays luminosities are 0.8 and 0.7, that are lower than expected. Nevertheless, LaFranca et al. (1995) found a correlation consistent with = 1 using a generalized orthogonal regression that is in better agreement with our values.
4.2.2 Correlations for the main AGN groups
We also report slopes and correlation coefficients for the five main groups considered in the last sections separately in Table 2. Spearman’s rank correlation tests have been performed for all scatter diagrams. Thus, the values reported in Table 2 correspond only to objects showing significant correlations (p0.01).
Looking at the Type-1 AGN in Table 2 we conclude that they are the less contaminated active nuclei of the sample. Since we are seeing a direct view of the central engine, the emission is dominated by the AGN at all wavelengths. Therefore, these objects draw the most tight correlations between each photometric band and either the hard or the soft X-ray luminosities222Note that in order to check that the good correlation displayed by Type-1 AGN luminosities is not due to a distance effect (this group of galaxies presents the largest spread in redshift, as shown in Figure 3), we have also analysed the corresponding fluxes, instead of luminosities, for all the groups considered in this section. This way, the distance effect is eliminated from the fits. We find the same linear and significant correlations for Type-1 AGN fluxes, confirming that the correlations displayed for this group of AGN are only due to their intrinsic properties. .
If we look at the Starburst-contaminated AGN, we find significant correlations between the hard X-rays and the ultraviolet and infrared bands, dissapearing for the soft X-rays, due to the higher obscuration in this wavelength range.
For the Starburst-dominated AGN, correlations including the hard X-ray data are better and more robust than those with the soft X-ray ones, for which both the slope and values are far from unity. This is certainly due to the higher obscuration affecting the soft X-ray emission in these objects. The host galaxy emission and the dust are indeed masking the AGN. The same, but more dramatically, happens with the Type-2 AGN group, for which all the correlations involving the soft X-ray emission are not significant.
It is worth to mention the worsening of the fits for the Starburst-dominated AGN when the hard X-ray and either the IRAC 8 µm or MIPS 24 µm emission are considered. The slopes and correlation coefficients of both fits move away from unity, something that is interpreted as due to the increasing importance of the starburst emission at these longer wavelengths. If we look at the MIPS 24 µm luminosity-luminosity scatter diagrams (bottom of Figure 4), the overall majority of the Starburst-dominated AGN are located above the fit line. This indicates that there is an excess of mid-infrared emission, as compared with the X-ray luminosity coming principally from the AGN. This mid-infrared excess comes from warm dust heated by the intense star formation bursts taking place in the galaxy (in addition to the dust heated by the AGN), hence deviating the Starburst-dominated AGN group from the linear fit, and making the correlation non-significant when the MIPS 24 µm luminosity is considered.
The behaviour of Normal galaxy hosting AGN is completely different: correlations when either the soft or hard X-rays are considered are quite similar, improving towards longer wavelengths, where the AGN resurfaces. This group of galaxies include low-luminosity AGN hosted in normal galaxies that dominates the optical and near-infrared bands, but not the mid-infrared emission. This explain why in some fits performed with this subset of templates, the IRAC 8 and MIPS 24 µm are not completely well reproduced by the fit.
4.3 X-ray properties
Looking at the hard and soft luminosity ranges (see Table 3) for each of the five main groups described above, we find that Type-1 AGN present the largest spread in luminosity, together with the highest luminosity values in both bands (L and L, not corrected for absorption). Alonso-Herrero et al. (2006) found that the majority of galaxies in their sample of X-ray detected sources in the CDF-S fitted with Broad-line AGN (BLAGN) QSO templates showed hard X-ray luminosities in the range 10 (also not corrected for absorption). The same has been found when a spectroscopic classification of the objects has been possible (Zheng et al., 2004; Szokoly et al., 2004; Barger et al., 2005). Our hard X-ray luminosity range for Type-1 AGN agrees with the literature in the sense that the most luminous X-ray sources are enclosed in that range, whilst five sources show L, and only three have L, namely irac068644, irac027980, and irac018192, all of them with z. The most X-ray luminous AGN in our sample is irac040934, with a L and zphot = 2.42.
The behaviour of the Starburst-contaminated AGN is very similar to that of the majority of the Type-1 AGN and exactly coincides with the hard X-ray luminosity range found by Alonso-Herrero et al. (2006) for BLAGN-fitted objects. This indicate that, despite the starburst appearance of the SEDs of these objects at longer wavelengths, in regard to their X-ray emission their AGN nature dominates.
The Starburst-dominated AGN are contained in a narrower interval of X-ray luminosities (L and L), although reaching high values, indicating that these galaxies are not only starbursts, but also masked-AGN that show strong in their X-ray emission. Indeed, very few bona fide starburst galaxies have L erg s-1, even including luminous sources at moderate redshifts (Zezas, Alonso-Herrero & Ward, 2001). Only for warm ultraluminous infrared galaxies (ULIRGs) luminosities of up to 1042 erg s-1 are expected (Franceschini et al., 2003). Type-2 AGN display hard X-ray luminosities ranging from 1042 to 1043 erg s-1, staying in a much narrower range and with lower values than those of Type-1 AGN. The values of hard X-ray luminosities that we find for Starburst-dominated AGN and Type-2 AGN coincide with those found by Alonso-Herrero et al. (2006) for their galaxies fitted with Narrow-line AGN (NLAGN)+ULIRG templates.
Finally, the Normal galaxy hosting AGN group shows the lowest luminosity range of any of the groups (L), which is consistent with the fact that they are hosting low-luminosity AGN (Dunlop et al., 2003; Kauffmann et al., 2003; Grogin et al., 2005; Pierce et al., 2007). The hard X-ray luminosity range of this group of objects coincides with typical luminosities (L 2 x 10) of the local cool ULIRGs population, except for four sources, namely irac045337, irac019616, irac016716, and irac049420.
These results, together with the mean redshift of each group reported in Section 4.1., point out that the evolution of AGN is luminosity-dependent, with low-luminosity AGN peaking at lower redshifts than luminous active nuclei (Hasinger, 2003a; Hasinger et al., 2005; Fiore et al., 2003; Ueda et al., 2003; LaFranca et al., 2005; Brandt & Hasinger, 2005; Bongiorno et al., 2007).
4.4 Infrared and optical properties
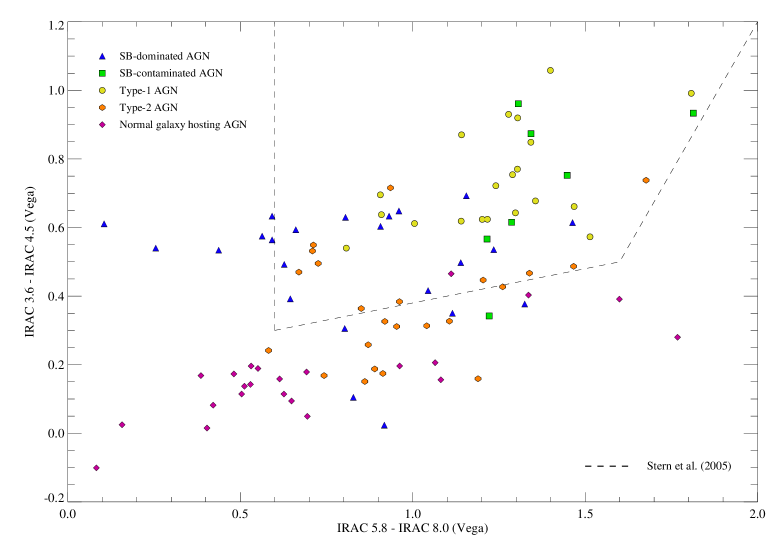
The IRAC mid-infrared colors have been used as a diagnostic tool to separate AGN from non-active galaxies and stars in different samples (Lacy et al., 2004; Hatziminaoglou et al., 2005; Stern et al., 2005; Alonso-Herrero et al., 2006; Barmby et al., 2006; Donley et al., 2007). Particularly, Stern et al. (2005) show an IRAC color-color diagram for the AGES sample, with all their objects spectroscopically classified. They found that BLAGN are clearly separated from Galactic stars and ordinary galaxies in their diagram, with the NLAGN located both inside and outside of the active galaxies area.
An IRAC colour-colour diagram for our sample is represented in Figure 5. The different symbols indicate the template fitting classification. The dashed line in Figure 5 corresponds to the Stern et al. (2005) empirical separation of AGN in their sample. In our case, this region includes all the Type-1 AGN, and all but one of the Starburst-contaminated AGN. This is expected, since five of the seven galaxies belonging to that group were fitted with the Sy1/SB/ULIRG template (SED type = 4, see Table 1), while the one located outside the AGN region was fitted with the Sy2/SB template (SED type = 6).
The only-galaxy classified as Starburst-contaminated AGN fitted with a Sy2/SB/ULIRG template (SED type = 13) that is contained in the Stern et al. (2005) AGN region is irac046309, its photometric redshift being =2.45. The redshift of this source is mentioned here because, as Barmby et al. (2006) discuss and ilustrate in their Figure 6, the AGN-dominated templates have red mid-infrared colors and thus, lie inside the Stern et al. (2005) region at all redshifts, whereas the star-forming galaxy templates begin to move into this area as the redshift increases. This explains why all Type-1 AGN are located inside the AGN region marked by the dashed line, as well as the six Starburst-contaminated AGN: five are fitted with the Sy1/SB/ULIRG template, and the galaxy irac046309 is a high redshift Sy2/SB/ULIRG. The Normal galaxy hosting AGN-fitted objects (that have the bluest IRAC colors of the sample) are excluded of this region (except for one of them).
As shown in Stern et al. (2005), the active galaxy region is contaminated with Galactic stars and normal galaxies, with the NLAGN located both inside and outside of this area. The same happens in our Figure 5: Starburst-dominated AGN and Type-2 AGN are partly contained in this area, and partly not. We have estimated the mean redshifts of both groups of galaxies for the in- and out-objects, finding that the Starburst-dominated AGN lying outside the pure-AGN region have a mean = 1.350.54, while those inside have a mean = 1.520.50. Following the same trend, the Type-2 AGN mean redshift is = 0.790.26 for the outside objects, and = 0.970.32 for the galaxies included in the Stern et al. (2005) region. This is again consistent with the evolution of mid-infrared colors with redshift for star-forming galaxies (Barmby et al., 2006; Donley et al., 2008). However, these mean redshifts for Starburst-dominated AGN and Type-2 AGN lying inside and outside the Stern et al. (2005) region are only orientative, since the differences between them are not statistically significant.
The reliability of these type of diagram (mid-infrared color selection) in selectioning AGN have been questioned in the literature (Cardamone et al., 2008; Donley et al., 2008). It seems that they fail to identify a large number of X-ray selected AGN, finding only the most luminous. In our work, the Stern et al. (2005) region wraps all the Type-1 objects, all but one of the Starburst-contaminated AGN, and half of the Starburst-dominated AGN and Type-2 AGN. 52% of our sample is included in this area, but the low-luminosity AGN (most of them Normal galaxy hosting AGN and several Starburst-dominated AGN and Type-2 AGN) are excluded. Cardamone et al. (2008) find that 76% of their spectroscopically-selected BLAGNs fall inside this region, but only 40% of the X-ray selected objects are included. Summarizing, although the diagram in Figure 5 only includes half of our sample in the Stern et al. (2005) region, it seems very effective segregating the different AGN groups.
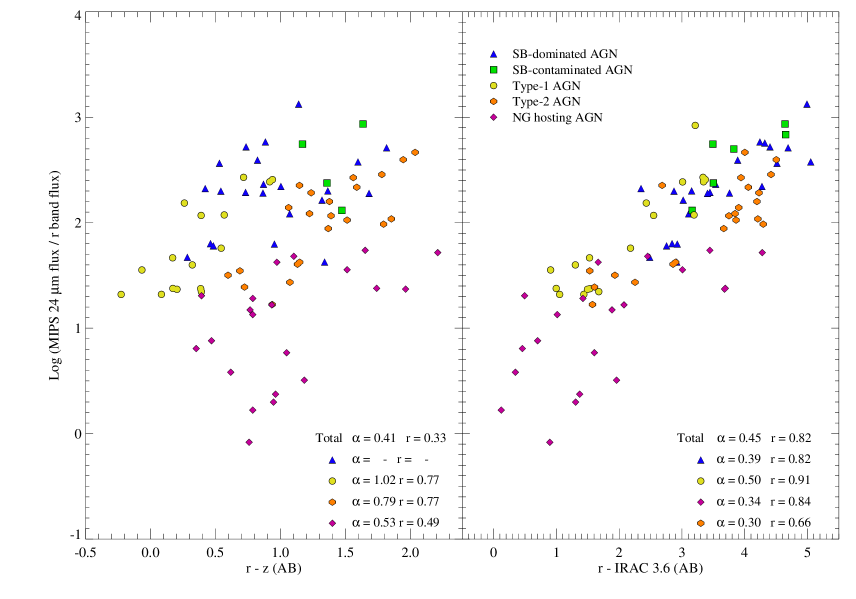
The left pannel of Figure 6 shows the mid-infrared 24 µm to optical (r band) flux ratio versus the (r-z)AB color for galaxies with unique detection. The 24 µm to optical flux ratio is a rough estimator of obscured activity in galaxies, since the 24 µm sources with with faint optical counterparts should be luminous AGN obscured by dust and/or gas in the optical range (Fiore et al., 2008). The (r-z)AB color depends on the obscuration present in the galaxy.
As expected for pure AGN, we find a significant correlation between the 24 µm to flux ratio and (r-z)AB for the Type-1 AGN and Type-2 AGN, because the nuclear emission dominates both in the optical and mid-infrared wavelengths (Fiore et al., 2008). However, the correlation is not significant for the Starburst-dominated AGN group, since they have an excess in their mid-infrared emission, coming from the dust heated by the starbursts, in addition to the dust heated by the AGN. Normal galaxy hosting AGN display also a correlation between the two quantities, but with a different slope and lower correlation coefficient than the pure AGN objects. The corresponding slopes and correlation coefficients are indicated in Figure 6, except for the Starburst-contaminated AGN group, due to the low number of objects fitted with this set of templates.
A segregation between the different groups is noticeable in the plot: the Starburst-dominated AGN and Starburst-contaminated AGN are shifted towards the highest values of the mid-infrared to optical ratio Log (24 µm/ r band flux) 1.6 , Type-1 AGN and Type-2 AGN are located at intermediate values, and the Normal galaxy hosting AGN have the lowest values of this ratio (Log [24 µm/ r band flux] 1.8). Obscured AGN should be located towards the top right of Figure 6 (left pannel), since they have the reddest optical colors and the highest 24 µm/r band flux ratios. Starburst-dominated AGN, Starburst-contaminated AGN, and Type-2 AGN-fitted objects are the most obscured galaxies in our sample, according to this diagram, although they are not as obscured as those in Fiore et al. (2008). We have chosen the (r-z)AB color instead of the most common (r-K)AB due to the lower number of objects that have available K magnitudes.
In the right pannel of Figure 6 the same mid-infrared 24 µm / r band flux ratio is shown against the (r-IRAC 3.6 µm)AB color for galaxies with unique detection. As much as the (r-z)AB color is contaminated by the host galaxy contribution, the (r-IRAC 3.6 µm)AB color is dominated by the hot dust emission heated by the AGN and/or intense star formation (Brusa et al., 2005). In this case, all the individual groups of objects as well as the whole sample show significant and tight correlations. The segregation between the different groups mentioned before is clear again in this graph. The Starburst-dominated AGN and Starburst-contaminated AGN clearly show the reddest colors of the sample (r-IRAC 3.6 µm 2.3), while the Normal galaxy hosting AGN display the bluest, concentrated around r-IRAC 3.6 µm 1.6. These objects occupy the left bottom corner of the right pannel of Figure 6 because the host galaxy outshines the AGN emission at all wavelengths (except in the X-rays).
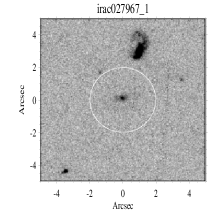
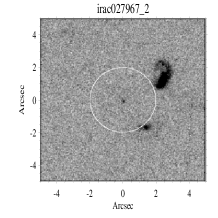
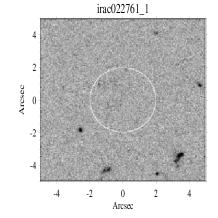
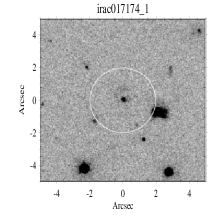
4.5 Objects with double detection in the optical bands.
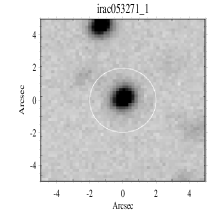
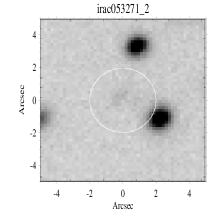
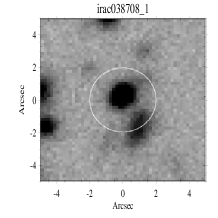
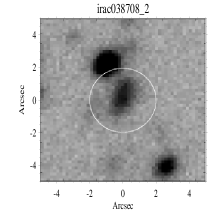
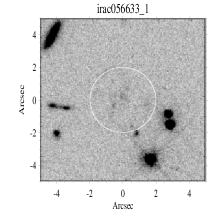
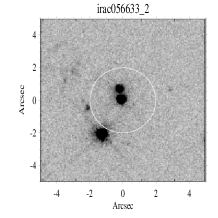
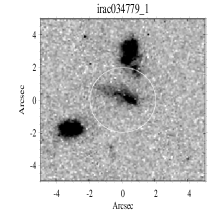
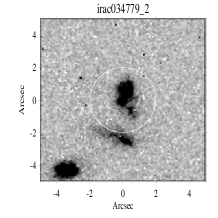
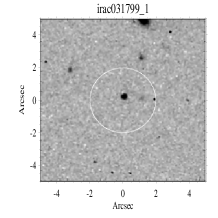
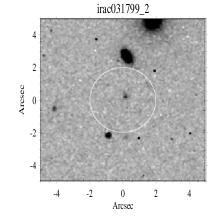
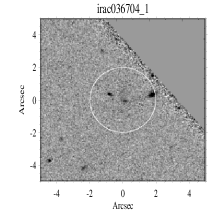
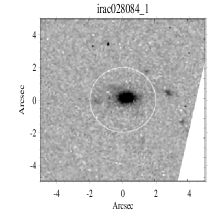
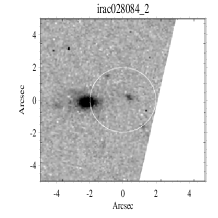
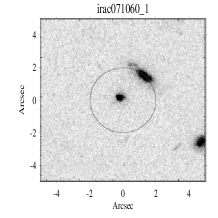
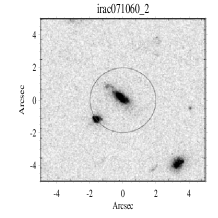
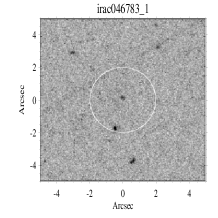
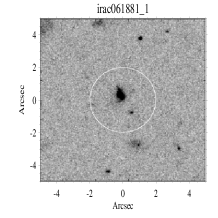
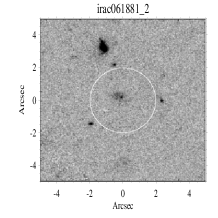
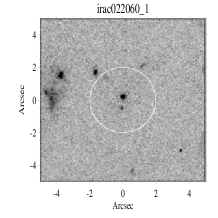
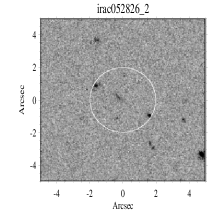
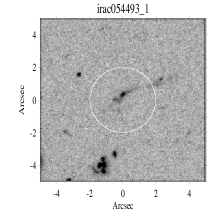
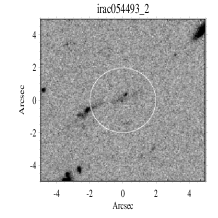
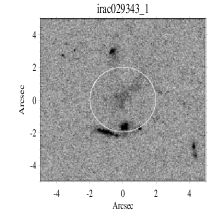
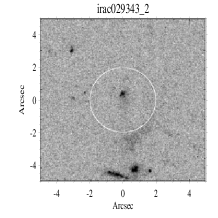
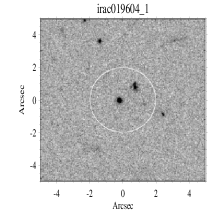
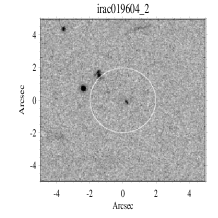
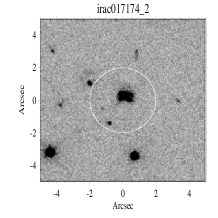
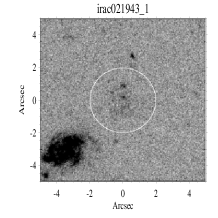
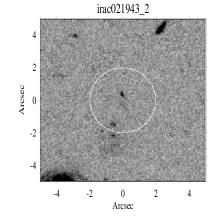
Twenty out of the 116 objects that comprise our full sample show double detection in the ground-based images, thanks to their better spatial resolution. Figs. 7 and 8 show ACS V-band/HST images of both detections (indicated with circles) for each pair of galaxies, except for objects irac053271 and irac038708, which do not have HST imaging, and for which optical CFHTLS r-band images are shown instead. The CFHTLS magnitudes have been employed for the calculations with the HyperZ code, although we have chosen the HST images for display purposes, because of their better resolution. These images help us classifying morphologically these 20 objects with double detections as either interacting systems, different star forming regions of the same galaxy, or simple source confusion, as described in Table 4.
In the case of these objects with double detection, for a single IRAC source, there are two counterparts in the ground-based images within the 2.5″ search radius. As described in Section 2, the optical/near-infrared reference image is used to determine the positions of each source. The IRAC images are then deconvolved using the IRAC PSFs. The sources can be resolved for separations 1″ from each other, and IRAC fluxes are then remeasured by fixing the positions of the objects in each pair, and by scaling the flux of each object in an aperture of 0.9″ (Pérez-González et al., 2005, 2008a). The integrated magnitude is derived applying an aperture correction based on empirical IRAC PSFs (for the 0.9″ aperture the factors are 1.010.07, 1.020.08, 1.20.10, and 1.440.14 for the channels 3.6, 4.5, 5.8, and 8.0 µm, respectively). See Pérez-González et al. (2008a) appendix for more details. The flux contamination is found to be smaller than the 10% in most cases, an even smaller for the non-infrared-bright sources.
Once we know the positions of each galaxy in a pair, we can check whether the mid-infrared emission comes from both, or just from one of the objects in the IRAC and MIPS images. In the majority of the cases, all the mid-infrared flux in a pair of galaxies comes from only one of the objects (see Table 4), the other probably being a non-active object. Then, we assume that the X-ray emission comes from the same mid-infrared emitter, and we calculate photometric redshifts for the active objects only.
In those cases where the mid-infrared emission can not be allocated clearly to one of the objects (irac038708, irac056633, and irac046783), photometric redshifts calculated by HyperZ for both sources in each pair have been obtained and they are reported in Table 5 together with their , probabilities, SED type and AV. For the other 17 pairs of galaxies, for which the mid-infrared emission comes clearly from only one of the objects, we calculate photometric redshifts only for the mid-infrared emitter. Spectroscopic redshifts from the DEEP database are also given, when available, together with their corresponding reliability flags. Unfortunately, this is the case for only four objects, and all of them with low reliability flags (1 or 2, see Table 5). Nevertheless, we can assume that the photometric redshifts, obtained as described in Section 3, are reasonably good, since we have followed the same methodology as for the 96 sources with single detections.
As reported in Table 4, irac056633-2, irac036704-1, irac022060-1, irac029343-1, and irac019604-1 are interacting systems themselves, as can be seen in the HST images (Figs. 7 and 8). These sources must be treated with caution, since their fluxes could be contaminated with extra-emission coming from their companions. This fact explains the low probabilities of the HyperZ fits for objects irac056633-2, irac029343-1, and irac019604-1, reported in Table 5.
In the same way as we have done for the objects with unique detection in previous sections, we distribute here the 23 template fitted-objects with double detection in the same five main categories described before. The percentages for each group are: Starburst-dominated AGN (48 % of the mid-infrared emitters), Starburst-contaminated AGN (0 %), Type-1 AGN (17 %), Type-2 AGN (22 %), and Normal galaxy hosting AGN (13 %). Note that for this subsample of objects with double detection, almost half of the objects are described by starburst-type SEDs. If, as in Section 4.1., we split the objects into AGN-dominated and host-dominated galaxies, we find that 39% show AGN-like SEDs while 61% are host-dominated, a clear overrepresentation. This is expected since if the pairs of galaxies are interacting objects, the number of starbursts in this subsample of galaxies should consequently increase.


5 Conclusions
We present a reliable method of classification of hard X-ray and mid-infrared selected AGN, based on the fit of well-sampled multiwavelength spectral energy distributions with a complete set of AGN and starburst galaxy templates. The sample studied in this paper consists of 96 AGN with unique detection, and 20 AGN with double detection in the EGS. The following results were found:
-
•
Photometric redshifts have been calculated by using the HyperZ code. The measured mean discrepancy between our zphot’s and a subsample of higly reliable DEEP spectroscopic redshifts (flag = 3 or 4) is z = -0.03, with = 0.11, and 3 outliers (8%). We provide more accurate photometric redshifts than the spectroscopic ones for objects with DEEP flag = 1 or 2.
-
•
Five main population groups have been considered according to the set of templates employed. For the 96 objects in our sample with unique detection, the following percentages have been found: Starburst-dominated AGN (24 % of the sample), Starburst-contaminated AGN (7 %), Type-1 AGN (21 %), Type-2 AGN (24 %), and Normal galaxy hosting AGN (24 %). We find that 52% of the sample has AGN-dominated SEDs and the remaining 48% host-dominated SEDs.
-
•
58% of the 96 objects with unique detection in our sample have zphot1, with the rest of the zphot of the sources distributed in a decreasing tail up to zphot=3. The Starburst-dominated AGN constitute the high-redshift population of the host-dominated AGN, whilst the Normal galaxy hosting AGN are concentrated at low redshifts. In the AGN-dominated group, Type-1 AGN are randomly distributed in distance, the Starburst-contaminated AGN are located at intermediate values of redshift, and the Type-2 AGN are the lowest-z objects.
-
•
An evolutionary trend is noticed, in which the Starburst-dominated AGN would be the progenitors of the Type-1 AGN and Type-2 AGN, via quenching of the starburst through the AGN feedback.
-
•
Correlations between hard/soft X-ray luminosities and ultraviolet/optical/infrared data are reported for such a sample of AGN spanning a wide range of redshift, being in this way represented the behaviour of the different AGN types in the various wavelengths considered.
-
•
Type-1 AGN show the highest values of hard and soft X-ray luminosities of the sample, together with the Starburst-contaminated AGN, whilst the Normal galaxy hosting AGN majority are concentrated at the lowest values, coinciding with the local cool ULIRGs typical hard X-ray luminosities. Starburst-dominated AGN and Type-2 AGN present intermediate values of X-ray emission, very similar to those of warm ULIRGs. This is consistent with a luminosity-dependent evolution of AGN, with low-luminosity AGN peaking at lower redshifts than luminous active nuclei.
-
•
Type-1 AGN are all contained in the IRAC color-color diagram region empirically determined by Stern et al. (2005) for spectroscopically selected AGN. There are many Type-2 AGN and Starburst-dominated AGN inside this AGN region. These objects have higher mean redshifts than those in the same group but outside the pure-AGN area, according with the evolution of the mid-infrared colors with redshift for star-forming galaxies described in Barmby et al. (2006).
-
•
Mid-infrared 24 µm to optical r band flux ratio versus the (r-z)AB or the (r-IRAC 3.6 µm)AB colors show a clear segregation of the different groups in both diagrams. Starburst-dominated AGN and Starburst-contaminated AGN are displaced towards the highest values of the mid-infrared to optical ratio and display the reddest colors. Type-1 AGN and Type-2 AGN are located at intermediate values, and the Normal galaxy hosting AGN have the lowest values of the 24 µm/r flux ratio and the bluest colors.
-
•
A tentative classification of objects with double detection into the five main population groups considered through this paper shows an increase of the Starburst-dominated AGN of up to 48%, while the others decrease. 61% of the fitted objects show AGN-like SEDs, while 39% is host-dominated.
References
- Alexander et al. (2003) Alexander, D. M., et al. 2003, AJ, 125, 383
- Alonso-Herrero et al. (2004) Alonso-Herrero, A., et al. 2004, ApJS, 154, 155
- Alonso-Herrero et al. (2006) Alonso-Herrero, A., et al. 2006, ApJ, 640, 167
- Babbedge et al. (2004) Babbedge, T. S. R., et al. 2004, MNRAS, 353, 654
- Barger et al. (2001) Barger, A. J., Cowie, L. L., Mushotzky, R. F., & Richards, E. A. 2001, AJ, 121, 662
- Barger et al. (2005) Barger, A. J., Cowie, L. L., Mushotzky, R. F., Yang, Y., Wang, W.-H., Steffen, A. T., & Capak, P. 2005, AJ, 129, 578
- Barmby et al. (2006) Barmby, P., et al. 2006, ApJ, 642, 126
- Bolzonella et al. (2000) Bolzonella, M., Miralles, J.-M., & Pelló, R. 2000, A&A, 363, 476
- Bongiorno et al. (2007) Bongiorno, A., et al. 2007, A&A, 472, 443
- Boulade et al. (2003) Boulade, O., et al. 2003, Proc. SPIE, 4841, 72
- Brusa et al. (2005) Brusa, M., et al. 2005, A&A, 432, 69
- Brandt & Hasinger (2005) Brandt, W. N. & Hasinger, G. 2005, ARA&A, 43, 827
- Bundy et al. (2006) Bundy, K., et al. 2006, ApJ, 651, 120
- Bundy et al. (2008) Bundy, K., et al. 2008, ApJ, 681, 931
- Calzetti et al. (2000) Calzetti, D. et al. 2000, ApJ, 533, 682
- Cardamone et al. (2008) Cardamone, C. N., et al. 2008, ApJ, 680, 130
- Cocchia et al. (2007) Cocchia, F., et al. 2007, A&A, 466, 31
- Davis et al. (2007) Davis, M., et al. 2007, ApJ, 660, 1
- Dickinson et al. (2001) Dickinson, M., et al. 2001, BAAS, 33, 820
- Donley et al. (2005) Donley, J. L., Rieke, G. H., Rigby, J. R., & Pérez-González, P. G. 2005, ApJ, 634, 169
- Donley et al. (2007) Donley, J. L., Rieke, G. H., Pérez-González, P. G., Rigby, J. R., & Alonso-Herrero, A. 2007, ApJ, 660, 167
- Donley et al. (2008) Donley, J. L., Rieke, G. H., Pérez-González, P. G., & Barro, G. 2008, ApJin press, arXiv:0806.4610
- Dunlop et al. (2003) Dunlop, J. S., McLure, R. J., Kukula, M. J., Baum, S. A., O’Dea, C. P., Hughes, D. H. 2003, MNRAS, 340, 1095
- Dye (2008) Dye, S. 2008, MNRASin press, arXiv:0806.1222
- Eckart et al. (2006) Eckart, M. E., et al. 2006, ApJS, 156, 35
- Eisenhardt et al. (2004) Eisenhardt, P., et al. 2004, ApJS, 154, 48
- Fiore et al. (2003) Fiore, F., et al. 2003, A&A, 409, 79
- Fiore et al. (2008) Fiore, F., et al. 2008, ApJ, 672, 94
- Franceschini et al. (2003) Franceschini, A. et al. 2003, MNRAS, 343, 1181
- Franceschini et al. (2005) Franceschini, A. et al. 2005, AJ, 129, 2074
- George et al. (2000) George, I. M., Turner, T. J., Yaqoob, T., Netzer, H., Laor, A., Mushotzky, R. F., Nandra, K., & Takahashi, T. 2000, ApJ, 531, 52
- Granato et al. (2004) Granato, G. L., De Zotti, G., Silva, L., Bressan, A. & Danese, L. 2004, ApJ, 600, 580
- Grogin et al. (2005) Grogin, N. A., et al. 2005, ApJ, 627, 97
- Groth et al. (1994) Groth, E. J., et al. 1994, BAAS, 26, 1403
- Hasinger (2003a) Hasinger, G. 2003a, in ”The Emergence of Cosmic Structure”, ed. S. S.Holt, & C. S. Reynolds, AIP Conf. Proc., 666, 227
- Hasinger (2003b) Hasinger, G. 2003b, in ”The restless high energy universe”, ed. E. P. J. van den Heuvel, J. J. M. in ’t Zand, and R. A. M. J. Wijers, Nucl. Physics B. Suppl. Ser. (astro-ph/0310804)
- Hasinger et al. (2005) , Hasinger, G., Miyaji, T., & Schmidt, M. 2005, A&A, 441, 417
- Hatziminaoglou et al. (2005) Hatziminaoglou, E., et al. 2005, AJ, 129, 1198
- Hornschemeier et al. (2001) Hornschemeier, A. E., et al. 2001, ApJ, 554, 742
- Jannuzi & Dey (1999) Jannuzi, B. T., & Dey, A. 1999, in ASP Conf. Ser. 191, Photometric Redshifts and the Detection of High Redshift Galaxies, ed. R. Weymann et al. (San Francisco: ASP), 11
- Kauffmann et al. (2003) Kauffmann, G., et al. 2003, MNRAS, 346, 1055
- Kitsionas et al. (2005) Kitsionas, S., Hatziminaoglou, E., Georgakakis, A., & Georgantopoulos, I. 2005, A&A, 434, 475
- Kron (1980) Kron, R. G. 1980, ApJS, 43, 305
- Krumpe et al. (2007) Krumpe, M., et al. 2007, A&A, 466, 41
- Kuraszkiewicz et al. (2003) Kuraszkiewicz, J. K., et al. 2003, ApJ, 590, 128
- Lacy et al. (2004) Lacy, M., et al. 2004, ApJS, 154, 166
- Lacy et al. (2007) Lacy, M., Petric, A. O., Sajina, A., Canalizo, G., Storrie-Lombardi, L. J., Armus, L., Fadda, D., & Marleau, F. R. 2007, AJ, 133, 186
- LaFranca et al. (1995) LaFranca, F., Franceschini, A., Cristiani, S., & Vio, R. 1995, A&A, 299, 19
- LaFranca et al. (2005) LaFranca, F., et al. 2005, ApJ, 635, 864
- Lonsdale et al. (2003) Lonsdale, C. J., et al. 2003, PASP, 115, 897
- Mainieri et al. (2002) Mainieri, V., et al. 2002, A&A, 393, 425
- Martínez-Sansigre et al. (2005) Martínez-Sansigre, A., Rawlings, S., Lacy, M., Fadda, D., Marleau, F. R., Simpson, C., Willott, C. J., & Jarvis, M. J. 2005, Nature, 436, 666
- Martínez-Sansigre et al. (2007) Martínez-Sansigre, A., et al. 2007, MNRAS, 379, L6
- Mushotzky (2004) Mushotzky, R. 2004, in Suppermassive Black Holes in the Distant Universe, ed. A. J. Barger (Dordrecht: Kluwer), 53
- Nandra et al. (2005) Nandra, K., et al. 2005, MNRAS, 356, 568
- Park et al. (2008) Park, S. Q., et al. 2008, ApJ, 678, 744
- Pérez-González et al. (2008a) Pérez-González, P. G., et al. 2008, ApJ, 675, 234
- Pérez-González et al. (2008b) Pérez-González, P. G., Trujillo, I., Barro, G., Gallego, J., Zamorano, J., & Conselice, C. J. 2008, ApJ, in press, arXiv:0807.1069
- Pérez-González et al. (2005) Pérez-González, P. G., et al. 2005, ApJ, 630, 82
- Peterson et al. (2006) Peterson, K. C., Gallagher, S. C., Hornschemeier, A. E., Muno, M. P., & Bullard, E. C. 2006, AJ, 131, 133
- Piccinotti et al. (1982) Piccinotti, G., Mushotzky, R. F., Boldt, E. A., Holt, S. S., Marshall, F. E., Serlemitsos, P. J., & Shafer, R. A. 1982, ApJ, 253, 485
- Pierce et al. (2007) Pierce, C. M., et al. 2007, ApJ, 660, 19
- Polletta et al. (2007) Polletta, M. et al. 2007, ApJ, 663, 81
- Risaliti, Maiolino & Salvati (1999) Risaliti, G., Maiolino, R., & Salvati, M. 1999, ApJ, 522, 157
- Schawinski et al. (2007) Schawinski, K., et al. 2007, MNRAS, 382, 1415
- Springel et al. (2005) Springel, V., Di Matteo, T., & Hernquist, L. 2005, MNRAS, 361,776
- Steffen et al. (2006) Steffen, A. T., et al. 2006, AJ, 131, 2826
- Steidel et al. (1999) Steidel, C. C., Adelberger, K. L., Giavalisco, M., Dickinson, M., & Pettini, M. 1999, ApJ, 519, 1
- Stern et al. (2005) Stern, D., et al. 2005, ApJ, 631, 163
- Strateva et al. (2005) Strateva, I. V., Brandt, W. N., Schneider, D. P., Vanden Berk, D. G., & Vignali, C. 2005, AJ, 130, 387
- Szokoly et al. (2004) Szokoly, G. P., et al. 2004, ApJS, 155, 271
- Ueda et al. (2003) Ueda, Y., Akiyama, M., Ohta, K., & Miyaji, T. 2003, ApJ, 598, 886
- Vignali et al. (2003) Vignali, C., Brandt, W. N., & Schneider, D. P. 2003, AJ, 125, 433
- Villar et al. (2008) Villar, V., et al. 2008, ApJ, 677, 169
- Waddington et al. (2001) Waddington, I., Dunlop, J. S., Peacock, J. A., Windhorst, R. A. 2001, MNRAS, 328, 882
- Waskett et al. (2003) Waskett, T. J., et al. 2003, MNRAS, 341, 1217
- Weiner et al. (2005) Weiner, B. J., et al. 2005, ApJ, 620, 595
- Wilkes et al. (1994) Wilkes, B. J., Tananbaum, H., Worrall, D. M., Avni, Y., Oey, M. S., & Flanagan, J. 1994, ApJS, 92, 53
- Zezas, Alonso-Herrero & Ward (2001) Zezas, A., Alonso-Herrero, A., & Ward, M. J. 2001, Ap&SS, 276, 601
- Zheng et al. (2004) Zheng, W., et al. 2004, ApJS, 155, 73
| ID | ID IRAC | RA (o) | Dec (o) | zspec | zphot | Prob (%) | AV | Lr | Template | Group | |
|---|---|---|---|---|---|---|---|---|---|---|---|
| 1 | 054396 | 213.9870 | 52.2687 | - | 0.66 | 0.10 | 100 | 0.3 | 43.80 | 7 | Type-1 AGN |
| 2 | 067129 | 214.0352 | 52.3547 | - | 0.06 | 0.06 | 99 | 0.0 | 41.93 | 15 | NG hosting AGN |
| 3 | 045621 | 214.0441 | 52.2727 | - | 0.25 | 0.27 | 98 | 0.9 | 43.39 | 19 | NG hosting AGN |
| 4 | 068644 | 214.0572 | 52.3766 | 1.701 (2) | 0.05 | 1.15 | 32 | 0.9 | 40.55 | 7 | Type-1 AGN |
| 5 | 056094 | 214.0591 | 52.3276 | 0.534 (4) | 0.50 | 2.51 | 1 | 0.0 | 43.46 | 22 | NG hosting AGN |
| 6 | 048319 | 214.0948 | 52.3212 | 1.603 (4) | 0.76 | 1.41 | 18 | 0.0 | 44.21 | 4 | SB-cont. AGN |
| 7 | 019994 | 214.0956 | 52.2034 | - | 1.37 | 0.48 | 92 | 1.2 | 44.95 | 14 | Type-1 AGN |
| 8 | 060727 | 214.1236 | 52.3925 | - | 0.96 | 0.59 | 81 | 0.3 | 44.40 | 10 | Type-2 AGN |
| 9 | 053898 | 214.1298 | 52.3695 | - | 0.26 | 2.93 | 0 | 0.0 | 42.71 | 9 | Type-2 AGN |
| 10 | 040342 | 214.1367 | 52.3171 | 1.028 (4) | 0.95 | 0.83 | 60 | 0.0 | 43.81 | 4 | SB-cont. AGN |
| 14 | 052726 | 214.1587 | 52.3857 | 0.417 (4) | 0.35 | 0.40 | 95 | 0.0 | 43.98 | 19 | NG hosting AGN |
| 16 | 059064 | 214.1765 | 52.4241 | - | 0.05 | 2.26 | 1 | 0.3 | 43.89 | 15 | NG hosting AGN |
| 17 | 029938 | 214.1768 | 52.3034 | - | 1.06 | 0.98 | 45 | 0.0 | 45.65 | 7 | Type-1 AGN |
| 20 | 040860 | 214.1815 | 52.3506 | 0.283 (2) | 0.12 | 0.91 | 53 | 0.0 | 43.20 | 20 | NG hosting AGN |
| 21 | 045337 | 214.1832 | 52.3720 | 0.510 (4) | 0.45 | 0.38 | 96 | 0.0 | 43.99 | 20 | NG hosting AGN |
| 22 | 071927 | 214.1891 | 52.4850 | 1.630 (2) | 1.55 | 0.24 | 99 | 0.9 | 44.08 | 14 | Type-1 AGN |
| 24 | 054089 | 214.2060 | 52.4252 | - | 2.35 | 0.49 | 90 | 0.6 | 44.75 | 14 | Type-1 AGN |
| 25 | 019616 | 214.2065 | 52.2815 | 0.761 (4) | 0.75 | 0.62 | 78 | 0.3 | 43.78 | 22 | NG hosting AGN |
| 26 | 024423 | 214.2079 | 52.3025 | 0.808 (4) | 0.73 | 0.23 | 99 | 0.0 | 43.87 | 3 | SB-dom. AGN |
| 27 | 017652 | 214.2104 | 52.2763 | 0.683 (4) | 0.60 | 0.29 | 98 | 0.9 | 44.16 | 6 | SB-cont. AGN |
| 29 | 033772 | 214.2136 | 52.3461 | - | 0.85 | 1.67 | 7 | 0.0 | 44.70 | 9 | Type-2 AGN |
| 30 | 058423 | 214.2163 | 52.4501 | - | 0.90 | 0.27 | 98 | 0.3 | 44.32 | 10 | Type-2 AGN |
| 33 | 042611 | 214.2433 | 52.4036 | - | 0.90 | 0.87 | 53 | 0.0 | 42.61 | 4 | SB-cont. AGN |
| 35 | 021276 | 214.2529 | 52.3218 | - | 0.32 | 0.15 | 100 | 0.3 | 43.61 | 9 | Type-2 AGN |
| 36 | 041222 | 214.2675 | 52.4149 | 0.281 (4) | 0.25 | 1.13 | 33 | 0.6 | 43.75 | 23 | NG hosting AGN |
| 38 | 068074 | 214.2737 | 52.5297 | 0.426 (2) | 1.56 | 1.59 | 9 | 0.0 | 44.13 | 2 | SB-dom. AGN |
| 41 | 068708 | 214.2850 | 52.5403 | - | 1.36 | 0.62 | 80 | 0.3 | 44.16 | 5 | SB-dom. AGN |
| 42 | 056274 | 214.2862 | 52.4917 | - | 1.26 | 1.17 | 30 | 0.6 | 43.79 | 2 | SB-dom. AGN |
| 43 | 046787 | 214.2870 | 52.4525 | 0.532 (4) | 0.47 | 0.13 | 100 | 0.0 | 43.90 | 20 | NG hosting AGN |
| 45 | 050845 | 214.2940 | 52.4747 | - | 1.25 | 0.99 | 45 | 0.3 | 44.53 | 1 | SB-dom. AGN |
| 47 | 039386 | 214.2961 | 52.4280 | - | 0.34 | 0.93 | 51 | 0.3 | 44.00 | 19 | NG hosting AGN |
| 48 | 062600 | 214.2984 | 52.5257 | 0.835 (4) | 0.84 | 0.87 | 57 | 0.0 | 44.13 | 21 | NG hosting AGN |
| 49 | 016716 | 214.2994 | 52.3366 | 0.433 (4) | 0.45 | 1.37 | 18 | 0.6 | 44.08 | 22 | NG hosting AGN |
| 50 | 036500 | 214.3096 | 52.4259 | - | 0.32 | 0.73 | 60 | 1.2 | 43.59 | 12 | Type-1 AGN |
| 51 | 071816 | 214.3118 | 52.5720 | - | 1.20 | 1.38 | 18 | 1.2 | 44.17 | 2 | SB-dom. AGN |
| 52 | 026610 | 214.3127 | 52.3869 | 1.271 (3) | 0.48 | 0.27 | 99 | 0.0 | 43.41 | 14 | Type-1 AGN |
| 53 | 041138 | 214.3134 | 52.4474 | 0.723 (4) | 0.67 | 1.08 | 38 | 0.0 | 44.14 | 9 | Type-2 AGN |
| 55 | 041987 | 214.3290 | 52.4623 | 1.211 (3) | 1.23 | 0.27 | 98 | 0.0 | 44.10 | 1 | SB-dom. AGN |
| 56 | 042538 | 214.3303 | 52.4655 | 1.208 (3) | 1.19 | 1.35 | 19 | 0.0 | 43.71 | 10 | Type-2 AGN |
| 57 | 030161 | 214.3335 | 52.4168 | - | 0.88 | 1.03 | 42 | 0.3 | 44.19 | 8 | Type-2 AGN |
| 59 | 055009 | 214.3456 | 52.5288 | 0.465 (4) | 0.46 | 0.42 | 94 | 0.0 | 43.52 | 21 | NG hosting AGN |
| 60 | 055370 | 214.3475 | 52.5316 | 0.484 (4) | 0.50 | 0.29 | 98 | 0.0 | 43.64 | 9 | Type-2 AGN |
| 61 | 031265 | 214.3483 | 52.4320 | - | 1.19 | 1.01 | 43 | 1.2 | 44.42 | 1 | SB-dom. AGN |
| 62 | 057218 | 214.3510 | 52.5416 | 0.902 (4) | 0.83 | 1.39 | 17 | 0.0 | 43.59 | 3 | SB-dom. AGN |
| 63 | 048619 | 214.3525 | 52.5069 | 0.482 (4) | 0.54 | 1.50 | 12 | 0.3 | 44.49 | 14 | Type-1 AGN |
| 64 | 069965 | 214.3553 | 52.5956 | - | 1.16 | 0.18 | 97 | 0.0 | 43.22 | 4 | SB-cont. AGN |
| 66 | 051055 | 214.3637 | 52.5254 | - | 1.57 | 1.38 | 18 | 1.2 | 43.79 | 2 | SB-dom. AGN |
| 67 | 068063 | 214.3704 | 52.5984 | - | 1.43 | 0.85 | 58 | 0.3 | 44.40 | 3 | SB-dom. AGN |
| 69 | 034221 | 214.3748 | 52.4633 | - | 0.91 | 0.38 | 92 | 0.6 | 44.50 | 10 | Type-2 AGN |
| 72 | 035715 | 214.3784 | 52.4718 | - | 1.42 | 1.19 | 29 | 1.2 | 43.79 | 2 | SB-dom. AGN |
| 73 | 049420 | 214.3859 | 52.5342 | 0.986 (4) | 0.91 | 0.38 | 96 | 0.6 | 43.87 | 16 | NG hosting AGN |
| 74 | 055653 | 214.3909 | 52.5637 | 0.551 (4) | 0.52 | 0.39 | 95 | 0.3 | 43.90 | 22 | NG hosting AGN |
| 75 | 019988 | 214.3911 | 52.4155 | - | 0.92 | 1.14 | 33 | 0.0 | 43.72 | 3 | SB-dom. AGN |
| 76 | 044463 | 214.3932 | 52.5186 | 0.271 (4) | 0.29 | 0.42 | 95 | 0.6 | 43.86 | 16 | NG hosting AGN |
| 77 | 032243 | 214.3952 | 52.4696 | - | 1.73 | 1.52 | 11 | 0.0 | 45.29 | 1 | SB-dom. AGN |
| 78 | 040934 | 214.3998 | 52.5083 | - | 2.42 | 0.61 | 82 | 0.3 | 45.61 | 14 | Type-1 AGN |
| 79 | 039818 | 214.4012 | 52.5047 | - | 0.93 | 1.31 | 21 | 0.3 | 42.85 | 2 | SB-dom. AGN |
| 80 | 061825 | 214.4014 | 52.5957 | 0.197 (1) | 2.32 | 1.56 | 10 | 0.0 | 44.92 | 1 | SB-dom. AGN |
| 81 | 016037 | 214.4037 | 52.4084 | - | 2.33 | 1.37 | 19 | 0.3 | 44.79 | 14 | Type-1 AGN |
| 82 | 062180 | 214.4043 | 52.5994 | - | 0.25 | 1.22 | 27 | 0.0 | 44.79 | 22 | NG hosting AGN |
| 83 | 035272 | 214.4056 | 52.4893 | - | 1.19 | 0.36 | 87 | 0.9 | 43.83 | 9 | Type-2 AGN |
| 84 | 053837 | 214.4112 | 52.5706 | - | 1.11 | 1.17 | 30 | 0.3 | 43.65 | 2 | SB-dom. AGN |
| 86 | 031503 | 214.4127 | 52.4789 | - | 0.90 | 0.74 | 69 | 1.2 | 43.68 | 9 | Type-2 AGN |
| 87 | 031796 | 214.4137 | 52.4806 | - | 1.02 | 0.53 | 88 | 0.0 | 44.32 | 10 | Type-2 AGN |
| 89 | 057956 | 214.4228 | 52.5959 | - | 1.39 | 0.37 | 95 | 0.0 | 44.33 | 10 | Type-2 AGN |
| 90 | 028146 | 214.4244 | 52.4732 | 1.148 (4) | 1.15 | 2.43 | 1 | 0.6 | 44.53 | 4 | SB-cont. AGN |
| 91 | 031444 | 214.4393 | 52.4976 | 0.873 (4) | 0.87 | 1.27 | 24 | 0.9 | 43.76 | 1 | SB-dom. AGN |
| 92 | 024070 | 214.4401 | 52.4672 | 0.224 (2) | 0.23 | 0.61 | 82 | 0.0 | 43.03 | 22 | NG hosting AGN |
| 93 | 033761 | 214.4415 | 52.5091 | 0.985 (3) | 0.97 | 1.95 | 3 | 0.6 | 44.43 | 8 | Type-2 AGN |
| 95 | 027043 | 214.4445 | 52.4829 | - | 1.78 | 0.93 | 50 | 0.9 | 43.90 | 2 | SB-dom. AGN |
| 97 | 024055 | 214.4460 | 52.4713 | - | 2.58 | 0.27 | 90 | 1.2 | 43.83 | 12 | Type-1 AGN |
| 98 | 051437 | 214.4472 | 52.5862 | 1.547 (3) | 2.37 | 0.92 | 51 | 0.3 | 43.81 | 7 | Type-1 AGN |
| 99 | 021585 | 214.4550 | 52.4676 | 0.996 (4) | 1.00 | 0.50 | 87 | 0.3 | 44.65 | 17 | NG hosting AGN |
| 101 | 035904 | 214.4575 | 52.5290 | - | 2.65 | 0.47 | 88 | 0.9 | 44.30 | 2 | SB-dom. AGN |
| 105 | 030608 | 214.4657 | 52.5129 | - | 0.87 | 0.58 | 82 | 0.3 | 43.69 | 10 | Type-2 AGN |
| 106 | 022680 | 214.4684 | 52.4814 | - | 1.00 | 0.57 | 84 | 0.6 | 43.92 | 9 | Type-2 AGN |
| 107 | 021273 | 214.4707 | 52.4775 | 0.671 (3) | 0.60 | 0.40 | 95 | 0.3 | 43.96 | 22 | NG hosting AGN |
| 108 | 045400 | 214.4737 | 52.5795 | 0.719 (4) | 0.65 | 0.51 | 88 | 0.6 | 43.77 | 9 | Type-2 AGN |
| 109 | 028312 | 214.4748 | 52.5095 | - | 1.34 | 1.06 | 39 | 0.3 | 44.43 | 8 | Type-2 AGN |
| 110 | 031338 | 214.4760 | 52.5232 | - | 0.65 | 0.81 | 61 | 1.2 | 43.45 | 10 | Type-2 AGN |
| 111 | 044246 | 214.4775 | 52.5774 | 0.948 (3) | 0.85 | 0.61 | 81 | 0.3 | 43.99 | 21 | NG hosting AGN |
| 112 | 047305 | 214.4803 | 52.5924 | - | 2.75 | 0.34 | 96 | 0.3 | 43.91 | 12 | Type-1 AGN |
| 113 | 029613 | 214.4868 | 52.5235 | - | 0.50 | 0.52 | 88 | 1.2 | 42.79 | 7 | Type-1 AGN |
| 116 | 027980 | 214.4893 | 52.5186 | - | 0.16 | 0.70 | 67 | 0.9 | 42.79 | 7 | Type-1 AGN |
| 118 | 029054 | 214.4956 | 52.5275 | - | 0.63 | 0.15 | 100 | 0.6 | 43.69 | 9 | Type-2 AGN |
| 119 | 046309 | 214.5015 | 52.6030 | - | 2.45 | 0.31 | 93 | 0.0 | 43.69 | 13 | SB-cont. AGN |
| 124 | 041429 | 214.5082 | 52.5875 | - | 1.33 | 0.19 | 100 | 0.6 | 45.13 | 14 | Type-1 AGN |
| 125 | 042989 | 214.5119 | 52.5965 | - | 2.05 | 1.14 | 33 | 0.3 | 43.45 | 1 | SB-dom. AGN |
| 126 | 044785 | 214.5191 | 52.6092 | 0.387 (1) | 1.61 | 1.88 | 4 | 1.2 | 44.49 | 7 | Type-1 AGN |
| 127 | 032921 | 214.5270 | 52.5662 | - | 1.30 | 0.70 | 71 | 0.0 | 45.05 | 10 | Type-2 AGN |
| 128 | 018428 | 214.5305 | 52.5083 | - | 0.90 | 0.57 | 84 | 0.0 | 44.35 | 20 | NG hosting AGN |
| 133 | 024215 | 214.5679 | 52.5586 | - | 2.38 | 2.28 | 1 | 0.6 | 44.54 | 2 | SB-dom. AGN |
| 134 | 016978 | 214.5751 | 52.5340 | - | 1.32 | 2.04 | 3 | 0.3 | 43.89 | 3 | SB-dom. AGN |
| 135 | 022888 | 214.5841 | 52.5647 | - | 0.25 | 1.36 | 19 | 0.6 | 42.35 | 7 | Type-1 AGN |
| 136 | 018192 | 214.5888 | 52.5485 | 0.036 (1) | 0.05 | 0.59 | 81 | 1.2 | 40.70 | 7 | Type-1 AGN |
| 137 | 030219 | 214.5939 | 52.6020 | - | 0.84 | 0.92 | 50 | 1.2 | 43.51 | 9 | Type-2 AGN |
| Band | Total fit | SB-dom. AGN | SB-cont. AGN | Type-1 AGN | Type-2 AGN | NG hosting AGN | ||||||
|---|---|---|---|---|---|---|---|---|---|---|---|---|
| r | r | r | r | r | r | |||||||
| FUV | 1.22 | 0.84 | 1.05 | 0.81 | 1.37 | 0.94 | 1.29 | 0.95 | - | - | 1.12 | 0.71 |
| NUV | 0.83 | 0.73 | 1.08 | 0.83 | 0.87 | 0.87 | 0.99 | 0.85 | - | - | 0.72 | 0.52 |
| u | 0.75 | 0.73 | 0.90 | 0.77 | - | - | 1.01 | 0.89 | - | - | - | - |
| g | 0.70 | 0.72 | 0.79 | 0.72 | 1.12 | 0.80 | 0.99 | 0.91 | 0.76 | 0.58 | - | - |
| r | 0.67 | 0.71 | 0.71 | 0.66 | - | - | 0.97 | 0.92 | 0.71 | 0.57 | - | - |
| i | 0.66 | 0.73 | 0.71 | 0.66 | - | - | 0.96 | 0.93 | 0.64 | 0.55 | 0.47 | 0.58 |
| z | 0.67 | 0.73 | 0.78 | 0.74 | - | - | 0.97 | 0.93 | 0.64 | 0.59 | 0.48 | 0.57 |
| J | 0.68 | 0.75 | 0.82 | 0.79 | - | - | 0.97 | 0.94 | 0.75 | 0.62 | 0.48 | 0.58 |
| K | 0.72 | 0.78 | 0.78 | 0.82 | 1.25 | 0.87 | 0.91 | 0.92 | 0.66 | 0.51 | 0.62 | 0.67 |
| IRAC3.6 | 0.81 | 0.80 | 1.01 | 0.83 | 1.40 | 0.88 | 0.90 | 0.88 | 0.67 | 0.49 | 0.72 | 0.66 |
| IRAC4.5 | 0.87 | 0.80 | 1.07 | 0.82 | - | - | 0.90 | 0.86 | 0.77 | 0.51 | 0.82 | 0.67 |
| IRAC5.8 | 0.91 | 0.79 | 0.96 | 0.73 | 1.38 | 0.84 | 0.90 | 0.85 | 0.81 | 0.53 | 0.88 | 0.65 |
| IRAC8.0 | 0.93 | 0.80 | 0.69 | 0.64 | 1.40 | 0.85 | 0.92 | 0.87 | 0.82 | 0.56 | 0.98 | 0.69 |
| MIPS24 | 1.02 | 0.70 | - | - | - | - | 0.89 | 0.84 | 0.87 | 0.50 | 1.23 | 0.67 |
| Band | Total fit | SB-dom. AGN | SB-cont. AGN | Type-1 AGN | Type-2 AGN | NG hosting AGN | ||||||
| r | r | r | r | r | r | |||||||
| FUV | 1.07 | 0.83 | 0.92 | 0.80 | 0.92 | 0.95 | 1.17 | 0.95 | - | - | 0.92 | 0.63 |
| NUV | 0.75 | 0.74 | 0.87 | 0.85 | - | - | 0.87 | 0.86 | - | - | 0.68 | 0.54 |
| u | 0.66 | 0.73 | 0.70 | 0.78 | - | - | 0.87 | 0.89 | - | - | - | - |
| g | 0.61 | 0.71 | 0.64 | 0.72 | - | - | 0.85 | 0.90 | - | - | - | - |
| r | 0.58 | 0.70 | - | - | - | - | 0.84 | 0.90 | - | - | - | - |
| i | 0.57 | 0.70 | - | - | - | - | 0.83 | 0.91 | - | - | 0.44 | 0.58 |
| z | 0.57 | 0.70 | - | - | - | - | 0.83 | 0.91 | - | - | 0.45 | 0.59 |
| J | 0.59 | 0.72 | 0.52 | 0.65 | - | - | 0.82 | 0.91 | - | - | 0.45 | 0.59 |
| K | 0.62 | 0.76 | 0.49 | 0.67 | - | - | 0.79 | 0.91 | - | - | 0.55 | 0.65 |
| IRAC3.6 | 0.70 | 0.79 | 0.64 | 0.71 | - | - | 0.79 | 0.88 | - | - | 0.64 | 0.65 |
| IRAC4.5 | 0.76 | 0.79 | 0.73 | 0.74 | - | - | 0.80 | 0.87 | - | - | 0.71 | 0.65 |
| IRAC5.8 | 0.79 | 0.77 | 0.72 | 0.72 | - | - | 0.81 | 0.87 | - | - | 0.76 | 0.62 |
| IRAC8.0 | 0.80 | 0.77 | 0.58 | 0.67 | - | - | 0.81 | 0.88 | - | - | 0.81 | 0.63 |
| MIPS24 | 0.87 | 0.68 | 0.66 | 0.61 | - | - | 0.77 | 0.84 | - | - | 1.02 | 0.61 |
| X-ray range | SB-dom. AGN | SB-cont. AGN | Type-1 AGN | Type-2 AGN | NG hosting AGN |
|---|---|---|---|---|---|
| Hard | [42,44] | [43,44] | [40,45] | [42,43] | [40,43] |
| Soft | [41,44] | [42,44] | [39,45] | [41,43] | [40,43] |
| ID | ID IRAC | s1 IR emission | s2 IR emission | comments |
|---|---|---|---|---|
| 11 | 053271 | Dominant | Negligible | s2 diffuse region, s2 probably not AGN |
| 13 | 038708 | Dominant | Dominant | Interacting system |
| 23 | 056633 | Dominant | Dominant | s1 diffuse region with stellar knots, s2 interacting system itself |
| 31 | 034779 | Dominant | Negligible | Interacting system |
| 32 | 031799 | Dominant | Negligible | s1 QSO-like, s2 probably not AGN |
| 34 | 036704 | Dominant | Negligible | s1 interacting system itseft, s2 probably not AGN |
| 37 | 028084 | Dominant | Negligible | s1 face-on disky galaxy, s2 probably not AGN |
| 39 | 071060 | Dominant | Negligible | Interacting system spectroscopically confirmed, s2 probably not AGN |
| 58 | 046783 | Dominant | Dominant | s1 and s2 QSO-like |
| 65 | 042079 | Dominant | Negligible | s2 probably not AGN, s2 diffuse region with stellar knots |
| 88 | 061881 | Dominant | Negligible | s2 probably not AGN, s2 diffuse region with stellar knots |
| 100 | 022060 | Dominant | Negligible | s1 interacting system itself , s2 probably not AGN |
| 102 | 052826 | Dominant | Negligible | s2 probably not AGN, s2 diffuse region with stellar knots |
| 103 | 054493 | Dominant | Negligible | Interacting system, s2 probably not AGN |
| 117 | 029343 | Dominant | Negligible | s1 diffuse region and interacting system itseft, s2 probably not AGN |
| 121 | 019604 | Dominant | Negligible | s1 interacting system itself, s2 probably not AGN |
| 122 | 027967 | Dominant | Negligible | s2 probably not AGN |
| 129 | 022761 | Dominant | Negligible | s1 and s2 optical dropouts, s2 probably not AGN |
| 131 | 017174 | Dominant | Negligible | Minicluster, s2 probably not AGN |
| 132 | 021943 | Dominant | Negligible | s1 diffuse regions with stellar knots, s2 probably not AGN |
| ID | ID IRAC | RA (o) | Dec (o) | zspec | zphot | Prob (%) | AV | Lr | Template | Group | |
|---|---|---|---|---|---|---|---|---|---|---|---|
| 11 | 053271-1 | 214.1439 | 52.3775 | 2.089 (2) | 2.44 | 1.29 | 23 | 1.20 | 45.21 | 14 | Type-1 AGN |
| 13 | 038708-1 | 214.1499 | 52.3200 | - | 1.09 | 0.94 | 49 | 0.00 | 44.17 | 1 | SB-dom. AGN |
| 13 | 038708-2 | 214.1499 | 52.3200 | - | 1.10 | 1.21 | 28 | 0.00 | 44.11 | 3 | SB-dom. AGN |
| 23 | 056633-1 | 214.2032 | 52.4330 | - | 1.21 | 0.35 | 95 | 0.00 | 44.30 | 5 | SB-dom. AGN |
| 23 | 056633-2 | 214.2032 | 52.4330 | - | 0.26 | 1.73 | 6 | 0.30 | 43.18 | 22 | NG hosting AGN |
| 31 | 034779-1 | 214.2239 | 52.3567 | - | 0.22 | 0.91 | 53 | 0.90 | 42.76 | 10 | Type-2 AGN |
| 32 | 031799-1 | 214.2246 | 52.3453 | - | 2.67 | 0.67 | 76 | 0.30 | 44.41 | 12 | Type-1 AGN |
| 34 | 036704-1 | 214.2506 | 52.3845 | - | 1.41 | 0.42 | 92 | 0.30 | 44.47 | 21 | NG hosting AGN |
| 37 | 028084-1 | 214.2677 | 52.3611 | - | 0.44 | 0.89 | 55 | 0.90 | 43.48 | 10 | Type-2 AGN |
| 39 | 071060-1 | 214.2738 | 52.5418 | 0.170 (2) | 2.34 | 0.80 | 64 | 0.30 | 44.90 | 7 | Type-1 AGN |
| 58 | 046783-1 | 214.3350 | 52.4867 | - | 1.23 | 1.85 | 5 | 0.60 | 43.73 | 2 | SB-dom. AGN |
| 58 | 046783-2 | 214.3350 | 52.4867 | - | 0.92 | 3.14 | 0 | 0.00 | 42.67 | 2 | SB-dom. AGN |
| 65 | 042079-1 | 214.3627 | 52.4867 | - | 1.16 | 2.30 | 1 | 0.00 | 43.69 | 8 | Type-2 AGN |
| 88 | 061881-1 | 214.4148 | 52.6053 | - | 0.26 | 1.72 | 8 | 0.00 | 42.22 | 9 | Type-2 AGN |
| 100 | 022060-1 | 214.4551 | 52.4699 | 0.998 (2) | 0.98 | 0.75 | 68 | 0.00 | 44.13 | 10 | Type-2 AGN |
| 102 | 052826-1 | 214.4590 | 52.6005 | - | 1.26 | 0.33 | 95 | 0.90 | 43.61 | 2 | SB-dom. AGN |
| 103 | 054493-1 | 214.4620 | 52.6093 | - | 2.43 | 1.79 | 6 | 0.60 | 44.43 | 12 | Type-1 AGN |
| 117 | 029343-1 | 214.4923 | 52.5262 | - | 1.12 | 2.09 | 2 | 0.00 | 43.71 | 2 | SB-dom. AGN |
| 121 | 019604-1 | 214.5047 | 52.4950 | 0.623 (1) | 0.14 | 1.90 | 4 | 0.00 | 41.48 | 1 | SB-dom. AGN |
| 122 | 027967-1 | 214.5062 | 52.5305 | - | 0.89 | 1.31 | 22 | 0.30 | 43.85 | 21 | NG hosting AGN |
| 129 | 022761-1 | 214.5373 | 52.5309 | - | 1.06 | 0.77 | 61 | 1.20 | 43.19 | 1 | SB-dom. AGN |
| 131 | 017174-1 | 214.5545 | 52.5202 | - | 1.15 | 1.04 | 41 | 0.30 | 44.07 | 3 | SB-dom. AGN |
| 132 | 021943-1 | 214.5641 | 52.5466 | - | 0.98 | 0.63 | 77 | 0.30 | 43.44 | 2 | SB-dom. AGN |