Supermassive black holes, star formation and downsizing of elliptical galaxies
Abstract
The overabundance of Mg relative to Fe, observed in the nuclei of bright ellipticals, and its increase with galactic mass, poses a serious problem for all current models of galaxy formation. Here we improve on the one-zone chemical evolution models for elliptical galaxies by taking into account positive feedback produced in the early stages of super-massive central black hole growth. We can account for both the observed correlation and the scatter if the observed anti-hierarchical behaviour of the AGN population couples to galaxy assembly and results in an enhancement of the star formation efficiency which is proportional to galactic mass. At low and intermediate galactic masses, however, a slower mode for star formation suffices to account for the observational properties.
keywords:
galaxies: ellipticals: chemical abundances, formation and evolution1 Introduction
Increasing evidence has accumulated over the past decade that the [Mg/Fe] ratio is super-solar in the cores of bright galaxies (e.g. Faber et al., 1992; Carollo et al., 1993). An overabundance of Mg relative to Fe is the key indicator that galaxy formation occurred before a substantial number of type Ia SNe could explode and contribute to lower the [Mg/Fe] ratio (for the time-delay model, see Matteucci 2001). In addition, the [Mg/Fe] ratio in the cores of ellipticals increases with galactic mass (Worthey et al. 1992; Weiss et al. 1995; Kuntschner 2000, Kuntschner et al. 2001, Thomas et al. 2005, Nelan et al. 2006). This relation seems to already be in place at redshift 0.4 (Ziegler et al 2006).
In order to account for this trend in star formation time-scale, and specifically of increase in the star formation efficiency with galactic mass, there are at least three possibilities that have been discussed in the literature. One involves loss of the residual gas via galactic winds that are initiated earlier in the most massive objects (inverse wind picture, see Matteucci 1994). Another possibility is to assume that the initial mass function (IMF) systematically becoming flatter with increasing galactic mass (e.g., as argued by van Dokkum 2008). A top-heavy IMF was applied by Nagashima et al. (2005) to reproduce the mass-[Mg/Fe] relation, although this attempt proved to be unsuccessful. A selective loss of metals could also be the cause for the increase of [Mg/Fe] (see Matteucci et al. 1998). We consider that the first possibility is the best motivated, and we will refer to it as chemical downsizing. Observational evidence for chemical downsizing from has recently been obtained by Maiolino et al. (2008).
Chemical downsizing was predicted neither by the ’classical wind scenario’ of Larson (1974), where in bigger galaxies (i.e. deeper potential wells) the star formation time-scale is longer than in low mass counterparts, nor by hierarchical assembly in the CDM scenario (White and Rees 1978; Kauffmann & Charlot 1998), where the spheroids with the largest masses are the last ones to be formed (accordingly, in the time-delay model, they suffer strong injection of Fe from SNIa). The so-called revised monolithic scenario (Matteucci, 1994; Chiosi & Carraro 2002) does explain both the mass-[Mg/Fe] (MFMR, hereafter) and the mass-metallicity (MMR) relations, but physical motivation is lacking. In particular, Pipino & Matteucci (2004, PM04 hereafter) used the inverse wind scenario (Matteucci 1994) plus an initial infall episode within a multi-zone formulation to account simultaneously for the whole set of chemical and photometric observables. In contrast, a merger-induced star formation (SF) history produces results at variance with the MFMR (e.g. Thomas & Kauffmann 1999, Pipino & Matteucci, 2006, 2008). However none of these models addressed the associated issue of mass downsizing, which clearly must go hand in hand with chemical downsizing.
Study of the evolution of the galaxy luminosity function with redshift (Bundy et al. 2006, Scarlata et al 2006; Perez-Gonzalez et al. 2007) has demonstrated mass downsizing, in the sense that the stellar mass of the most massive spheroids seem to be passively evolving from high redshift. At the same time, the active galactic nuclei (AGN) population behaves anti-hierarchically (e.g. Hasinger et al. 2005). Substantial modification of the mass assembly of stars relative to assembly of baryons, at least with respect to CDM, seems to be required.
It is interesting to note that the peak of luminous AGN activity occurs around redshift 2 where the SF activity also seems to peak. In fact there is a time delay for low luminosity AGN; these peak several Gyr after the peak in SF activity. Moreover, the correlation between central black hole mass and spheroid velocity dispersion (Gebhardt et al. 2000; Ferrarese and Merritt 2000) suggests that the black holes form contemporaneously with the spheroids (Dietrich and Hamann 2004). The gas-rich protogalaxy provides the ideal accretion environment for forming the super-massive black hole (SMBH). There is indeed a natural coupling between the two processes, since the SMBH undergoes most of its growth in the gas-rich phase and the SMBH outflow pressurises the gas, which in turn forms stars. The nature, and indeed the direction, of the triggering is unclear, and it is worth mentioning that hitherto only models which incorporate negative (namely which quenches SF) feedback have been simulated. By means of different recipes, these models aim at reproducing the above mentioned observations. From the point of view of the cosmological simulations, AGN quenching of the cooling - and thus of the star formation - in the QSO mode is required to truncate star formation in early-type galaxies (ETGs), and AGN activity in the radio mode (of outflow) (Silk & Rees, 1998) is required to suppress infall and late star formation and thereby maintain the red colours of ETGs.
To-date, however, none of these cosmologically-motivated models have succeeded in reproducing the chemical downsizing inferred from the current epoch data. The disagreement with observations seems to worsen when the time evolution of the MMR is taken into account (Maiolino et al. 2008). The monolithic approach to chemical evolution models for single galaxies does allow one to reproduce the data. For example, Romano et al (2002) implemented a recipe for quenching SF earlier in the most massive galaxies by means of an AGN. At the same time, Kobayashi et al. (2007) managed to reproduce the observed trend by means of SNe and hypernovae, following PM04. No one, however, has so far studied the effects of SMBH-triggered star formation in a self-consistent way that is applicable to cosmological simulations. In particular, the recipes for star formation need to be addressed.
The aim of the present paper is to take a first step towards addressing the role of positive (i.e. which boosts SF) SMBH feedback in numerical simulations of galactic chemical evolution. A chemical evolution model for a single galaxy is the ideal tool for studying the reliability of such an approach, because the results can be directly compared with the observed MFMR. In particular, we implement the star formation modes suggested by Silk (2005) into the PM04 model for the chemical evolution of ETGs. According to Silk (2005), star formation is triggered coherently and rapidly by a SMBH jet-induced hot plasma cocoon which over-pressures cold clouds and induces collapse within the central core of the forming galaxy. This is one of the consequences of the propagation of a broad jet through an inhomogeneous interstellar medium with a low dense cloud filling factor (e.g., Saxton et al. 2005; Antonuccio-Delogu & Silk 2008). Krause & Alexander (2007) present simulations of the Kelvin-Helmhotz instability with clouds of differing density. The clouds are shocked, collapse into a filament, and then disperse into cloudlets and more filaments. Over time, more gas condenses into the cold phase. Mellema et al. (2002) then see fragmentation into small stable cloudlets, which may harbour star formation (Fragile et al. 2004). The feedback is positive, as there is insufficient time for the supernova-driven negative feedback to develop. The interaction of the outflow with the surrounding protogalactic gas at first stimulates star formation on a short time-scale. Evidence has been found for jet-stimulated star formation up to ( Bicknell et al. 2000, Venemans et al. 2004), followed in at least one case by a starburst-driven superwind (Zirm et al. 2005). There is also evidence for triggering of molecular gas at high redshift (Klamer et al. 2004). The prototypical low-redshift example is Minkowski’s object (van Breugel et al. 1985, Croft et al. 2006), where the neutral hydrogen may have cooled out of a warmer, clumpy intergalactic or interstellar medium as a result of jet interaction, followed by collapse of the cooling clouds and subsequent star formation, unlike the jet-induced star formation in Centaurus A, where the jet interacts with pre-existing cold gas. Another interesting case is the spiral galaxy NGC 4258 which exhibits a concentration of CO along the jets that is similar to what is expected as fuel for jet-induced star formation in more distant objects (e.g., Krause et al. 2007). We finally note that there is evidence of a higher type Ia supernova rate in radio-loud ellipticals (Della Valle et al. 2005) that may be connected to a small amount of recent (jet-induced) star formation (Antonuccio-Delogu & Silk, in preparation).
We first review the main ingredients of our chemical evolution models and present the new modifications in Sec. 2. Results and conclusions will be presented in Secs. 3 and 4, respectively
2 The model
The adopted chemical evolution model is an updated version of the multi-zone model of Pipino & Matteucci (2004). Note that, in order to compare our results with the latest available data by Thomas et al. (2008), which pertain to the whole galaxies rather than only to their central parts, we will run the model in a one-zone fashion out to one effective radius. This assumption is also required because we want to take into account the physics of the jet (see below) without detailed modelling of the gas transfer between the shells. We calculate the evolution of the elemental abundances by means of the equation of chemical evolution:
where is the mass density of the element i at the time t. is defined as the abundance by mass of each element i. By definition . We refer the reader to Matteucci Greggio (1986) for a comprehensive discussion of this equation. Here we note that the integrals on the right-hand side of the equation give the rate at which the element i is restored into the interstellar medium (ISM) as unprocessed or newly-synthesized elements by low- and intermediate-mass stars, SNIa and SNII, respectively. The last term represents the infall rate, namely the rate at which the gas is assembling to form the galaxy. is the IMF, normalized to unity in the mass interval . In the following we shall only use the exponent (Salpeter, 1955).
2.1 The growth of a SMBH
We deal with SMBH growth in a simple way, namely we note that the time-scale for star formation set by chemical downsizing is of the order of Gyr for the most massive galaxies (see PM04’s best model results). This is roughly the time needed for a SMBH to grow from a seed of to the mass required to fit the local Magorrian (1998) relation. Therefore we will assume this to happen without any further hypotheses.
We refer the reader to Silk (2005) for a more detailed analysis of the SMBH growth during the formation of a massive spheroid. Here we note that one may crudely describe this situation by modelling the late-time cocoon-driven outflow as quasi-spherical, and use a spherical shell approximation to describe the swept-up protogalactic gas. Initially, following Begelman and Cioffi (1989), the interaction of the pair of jets may be modelled by introducing an over-pressured and much larger cocoon, the ends of which advance into the protogalactic gas at a speed and which expands laterally at a speed determined eventually by pressure balance with the ambient gas.
Only a small fraction of the protogalactic gas reservoir is implicated in AGN feeding, even if this occurs at the maximum (Bondi) accretion rate. Super-Eddington outflow of course requires super-Eddington accretion which is plausibly associated with an Eddington luminosity-limited luminous phase implicated in the need to generate massive SMBHs by (Volonteri and Rees 2005). A time-scale of yr for the super-Eddington phase would more than suffice to provide the accelerated triggering of associated star formation. The SMBH grows mostly in the super-Eddington phase while most of the spheroid stars grow during the Eddington phase. The latter phase ends by quenching the feeding source, when the outflow clears out the remaining gas. Only then is spheroid star formation terminated.
2.2 Recipes for star formation
The variable in the equation of the chemical evolution is the star formation rate, for which PM04 adopted the following law:
| (1) |
namely it is assumed to be proportional to the gas density via a constant which represents the star formation efficiency. We assume , namely as an increasing function of the galactic mass (see Table 1) in order to reproduce the ’inverse wind model’ as originally suggested by Matteucci (1994) and to recover PM04’s best model (their model II). The star formation history is thus determined by the interplay between the infall time-scale at that radius, the star formation efficiency and the occurrence of the galactic wind (i.e. the energetic feedback from SNe and stellar winds). In each zone, we assume that after the development of the wind.
Silk (2005) proposes that there are two modes of star formation, writing where pertains to a slow self-regulated mode, similar to the disks of spirals, whereas takes into account SF boosting by SMBH. is the constant of gravity, the gas fraction, the gas velocity dispersion.
In more detail, we have:
| (2) |
where the velocity of the SN remnant shell, , the initial energy of a SN explosion and is the mass of stars needed per each SNII explosion for the Salpeter IMF. An order of magnitude estimate give us 0.01-0.05 for low mass ellipticals. whereas for more massive objects we expect 0.2. On the other hand, is set by the super-Eddington outflow. Silk (2005) shows that in this case the star formation rate can be written as , where is the jet luminosity, is the terminal velocity of the outflow, is the baryon compression in the galactic core, the wind velocity, is the cocoon expansion velocity; finally is the jet velocity. Comparing the above expression for to et. (1) we derive:
| (3) |
namely scales as the the jet luminosity in units of the critical luminosity needed to expel all of the protogalactic gas.
Silk (2005)’s conjecture is the following. The outflow is super-Eddington until the cocoon is limited by ambient pressure and becomes quasi-spherical. As the massive star formation/death rate slows, the AGN feeding augments and the outflow stimulates more star formation. Therefore the net effect is that the star formation has negative feedback on AGN feeding, whereas the AGN feeding has positive feedback on star formation. At this stage we have . Clearly the one-zone chemical evolution model cannot properly resolve the evolution of a jet and its interaction with the surrounding medium. In order to avoid the use of too many free parameters, we simply assume that the jet is playing a role in triggering SF by setting .
We can rewrite the two modes suggested by Silk (2005) as:
| (4) |
where , for the slow mode. For the jet-induced mode we have:
| (5) |
where . Interestingly, it can be seen that we can rewrite the above equations as , namely the SF time-scale is proportional to the dynamical time of the system, and the proportionality constant is given by either or . In the former case the SF time-scale will be only a (small) fraction of , whereas in the latter the SF can proceed on a dynamical time-scale. We can estimate the boosting factor in the SF due to the positive feedback simply as 5 for the most massive galaxies, but it can reach values as high as 50-100 for smaller objects as we will see in Sec. 3. We also note that in both (the slow and the jet-triggered) cases scales as the stellar velocity dispersion : therefore a downsizing trend is built-in in either cases. Silk (2005) also provides a possible demarcation between these two modes for the star formation efficiency at around , resembling a trend seen in the SDSS data (Kauffmann et al. 2003). We will show that this distinction seems to be supported by our models.
2.3 Potential energy of the gas
A key quantity of the model is the potential energy of the gas, which gives the minimum energy to be achieved in order for the galactic wind to develop (this also corresponds also to the time at which we halt the SF; for details see PM04 and Pipino et al. 2002). Following Martinelli et al. (1998), we evaluated the potential energy of the gas as
| (6) |
where is the work required to carry a quantity of mass at a radius out to infinity (Martinelli et al., 1998). The baryonic matter (i.e. star plus gas) is assumed to follow the distribution (Jaffe, 1983):
| (7) |
where .
We assume that the dark matter is distributed in a diffuse halo ten times more massive than the baryonic component of the galaxy with a scale radius (Matteucci 1992), where is the effective radius. In particular, we make use of Eq. 1 and 16 by Matteucci & Tornambe’ (1987) in order to empirically estimate in a given mass bin. The effective radius that we refer to is the final value, however it undergoes negligible evolution after the collapse is almost over (this occurs roughly at time ). The DM profile is taken from Bertin et al. (1992). We estimate the gas velocity dispersion as . It is a generic function of time because the gas is subject to both the dark matter potential (assumed to be fixed, following PM04) and the gravity due to the baryonic matter (which changes in time)
2.4 Supernova feedback
One of the fundamental points upon which our model is based, is the detailed calculation of the SN explosion rates. For type Ia SNe, we assume a progenitor model made of a C-O white dwarf plus a red giant (Greggio Renzini, 1983; Matteucci Greggio, 1986). The predicted type Ia SN explosion rate is constrained to reproduce the present day observed value (Cappellaro et al., 1999) We adopt two different recipes for SNIa and SNII, respectively.
SNe Ia are allowed to transfer all of their initial blast wave energy, . The reason for this extremely efficient energy transfer resides in the fact that radiative losses from SNIa are likely to be negligible, since their explosions occur in a medium already heated by SNII (Recchi et al. 2001). On the other hand, for SNe II which explode first in a cold and dense medium we allow for the cooling to be quite efficient. In particular, for SNII we assume that the evolution of the energy in the ’snow-plow’ phase is regulated by the Cioffi et al. (1988) cooling time.
Since we use a chemical evolution code which adopts the same formulation for the feedback as in Pipino et al. (2002, to which we refer the reader), we consider a 20% mean efficiency in energy transfer as a representative value also for the model galaxies presented in this paper. We still define the time when the galactic wind occurs () as the time at which the energy input by supernovae exceeds the gas binding energy (see section above and Pipino et al. 2002). The wind carries out the residual gas from the galaxies, thus inhibiting further star formation.
2.5 Infall
We recall that the main novelty of the PM04 paper relative to our previous discussions (Matteucci et al., 1998; Martinelli et al., 1998; Pipino et al., 2002) is that we simulate the creation of the spheroid as due to the collapse of either a big gas cloud or several smaller gas lumps. The infall makes the star formation rate start from a smaller value than in the closed box case, reach a maximum and, then, decrease when the star formation process becomes dominant. This treatment is certainly more realistic since it includes the simulation of a gas collapse.
Furthermore, in a galactic formation scenario in which the galaxies are assembled starting from gas clouds falling into the galactic potential well, the more massive objects have a higher probability (i.e. a higher cross-section) of capturing gas clouds than the less massive systems, thus completing their assembly on a faster timescale (Ferreras Silk, 2003) . This mechanism accounts for the anti-hierarchical behaviour of SMBH, because smaller galaxies accrete gas at a lower rate with respect to more massive objects, thus having a smaller reservoir with which to feed the SMBH.
The infall term is present on the right-hand side of the equation of chemical evolution, and the adopted expression is:
| (8) |
where describes the chemical composition of the accreted gas, assumed to be primordial. is a constant obtained by integrating the infall law over time and requiring that of the initial gas has been accreted at (in fact, we halt the infall of the gas at the occurrence of the galactic wind). Finally, is the infall time-scale.
2.6 Stellar Yields
We follow in detail the evolution of 21 chemical elements, for which we need to adopt specific prescriptions for stellar nucleosynthesis. In particular, our nucleosynthesis prescriptions are:
-
1.
For single low and intermediate mass stars () we make use of the yields of van den Hoek Groenewegen (1997) as a function of metallicity.
-
2.
We use the yields by Nomoto et al. (1997) for SNIa which are assumed to originate from C-O white dwarfs in binary systems which accrete material from a companion (the secondary) and reach the Chandrasekar mass and explode via C-deflagration .
-
3.
Finally, for massive stars () we adopt the yields of Thielemann et al. (1996, TNH96) which refer to the solar chemical composition.
3 Results and discussion
We run models for elliptical galaxies in the baryonic mass range . is the ’nominal’ mass of the object, i.e. the mass of the initial gas cloud (we recall that we normalize the infall law between and ). The mass in stars at the present time is for all the models and the velocity dispersion is evaluated from the relation (Burstein et al., 1997).
The models are:
-
1.
Model I: PM04’s best model: Salpeter IMF, is decreasing with galactic mass, whereas increases (see Table 1).
-
2.
Model II: Salpeter IMF, decreasing with galactic mass; self-consistently calculated according to Silk (2005) slow SF mode (see Table 1).
-
3.
Model III: Salpeter IMF, decreasing with galactic mass; self-consistently calculated according to Silk (2005) SMBH-triggered SF mode (see Table 1).
-
4.
Model IV: a hybrid case between Model II - for low galactic masses - and Model III - for the high mass end (see Table 1).
The basic features of the above mentioned models are highlighted in Table 1, where the input luminous mass, effective radius, SF efficiency and infall timescale are listed in columns 1-4, respectively, whereas the output galactic wind time-scale and mass-weighted abundance ratios in stars are presented in columns 5-7.
| () | (kpc) | () | (Gyr) | (Gyr) | ||
| Model I (PM04) | ||||||
| 1 | 3 () | 0.5 | 1.30 | -0.10 | 0.15 | |
| 3 | 10 () | 0.4 | 0.55 | -0.06 | 0.21 | |
| 10 | 22 () | 0.2 | 0.44 | 0.06 | 0.33 | |
| b | 10 | 44 (2x) | 0.2 | 0.41 | 0.10 | 0.34 |
| Model II | ||||||
| 1 | 1.5 | 0.94 | -0.18 | 0.15 | ||
| 3 | 0.4 | 0.66 | -0.04 | 0.26 | ||
| 10 | 0.2 | 0.56 | 0.08 | 0.29 | ||
| Model III | ||||||
| 1 | 0.5 | 1.40 | -0.45 | 0.57 | ||
| 3 | 0.4 | 0.71 | -0.27 | 0.48 | ||
| 10 | 0.2 | 0.33 | -0.04 | 0.35 | ||
| Model IV (hybrid) plus 10% SN eff. | ||||||
| 1 | 1.5 | 1.00 | -0.05 | 0.13 | ||
| 3 | 0.4 | 0.64 | 0.00 | 0.20 | ||
| 10 | 0.2 | 0.50 | 0.21 | 0.32 |
We start the analysis by comparing the massive objects predicted by model III with the PM04 best model (model I). The similarity is striking, even if , more than in the case in which we simply double the SF efficiency (Model I, b). This happens because of the linear relation between and time. In fact, as time proceeds, the gas mass decreases mainly due to SF, whereas increases because of the low- and intermediate-mass stars formed.
From fig. 1 we find that is only higher than at a late stage. For most of the galactic active evolution, however, , therefore the global effect on the SN explosion rate and the resulting galactic wind are similar. The slow mode (Model II), instead, has an efficiency ( but still within a factor of 2-3) for most of the galactic evolution. This produces a lower -enhancement with respect to the average value inferred from observations for the given galactic mass.
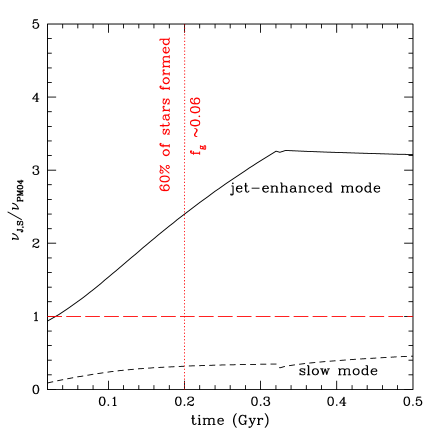

With the help of Fig. 2 we can see the effect of the two modes on the SF histories for three different masses. The solid line refers to the standard SF history of the PM04 model, which, in a sense, is a template that we want to reproduce with the more physically grounded recipe for evaluating . The new models are presented by dashed (Model II) and dotted (Model III) lines, respectively. Again, we stress that the fact that for the most massive galaxy leads to a SF history which is very similar to the one predicted by PM04.
At the low mass end, such a model implies , hence too large an amount of SNII which trigger too early a wind with respect to the fiducial PM04 case. The result is an average [Mg/Fe] higher than expected from observations at that given mass. The slow SF mode (Model II) seems to be more appropriate in this mass range.
The analysis of an intermediate-size galaxy () helps in understanding at which mass the SF process switches from the slow to the SMBH-induced mode. We find better agreement with the fiducial PM04 SF history when the model with undergoes a slow SF mode, whereas the jet-triggered case leads to a SF history lasting less than 0.2 Gyr. The stellar mass of this model after 10 Gyr of passive evolution is . Even if at a first glance of Fig. 2 it may seem that the downsizing trend with galactic mass, namely that the more massive galaxies have a higher peak value for the SF rate than the lower mass ones, is fulfilled by every SF recipe, we warn the reader that this does not suffice to reproduce the MFMR. At the same time the duration of the star formation must decrease with mass. Moreover, since smaller galaxies are younger than the most massive ones (e.g. Thomas et al. 2005), we expect the peak in the SF rate, namely the epoch at which the majority of the stars in a given galaxy form, to shift to later times.
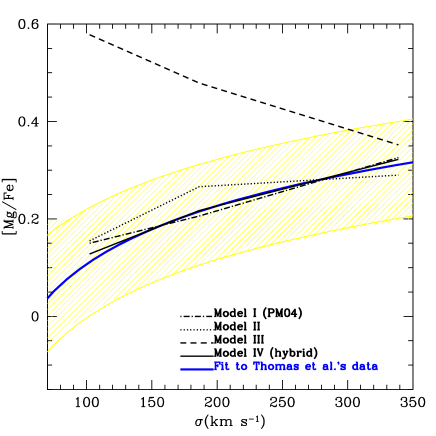
These findings become more clear if we show the MFMR predicted by different models plotted against a set of data (Fig. 3). Although several large samples are now available (e.g. Nelan et al. 2006, Smith et al. 2006, Graves et al. 2007), almost all agree on the typical slope and zero-point of the MFMR; therefore we make use of only one of such datasets, namely a sample of ellipticals drawn out of the SDSS, whose line-strength indices have been analysed and transformed into [/Fe] ratios by Thomas et al. (2008). Not surprisingly, Model I (dash-dotted line) fits the observed relation very well, being also the PM04 best model. As expected from the above discussion, Model II (dotted line) gives a flattening at high masses, whereas Model III (dashed line) predicts galaxies with a high overall enhancement and a decreasing trend with mass, in disagreement with observations.
In order to make a more quantitative comparison, we note that a linear regression fit of Thomas et al. (2008)’s data returns (Fig. 3:thick solid line that covers the entire range in ), with an intrinsic scatter in the relation of 0.1 dex. In the case of model I, we predict , therefore the agreement is remarkable. Model II, gives a slightly flatter trend, in the whole mass range, but basically a null slope at the high mass end; nonetheless its predictions are discrepant by only one standard deviation111We assume that theintrinsic scatter quoted by Thomas et al. (2008) corresponds to one standard deviation, although they do not report any formal error on both the intercept and the slope obtained from the fit to they data.. Finally, Model III is clearly ruled out, because the slope of the MFMR is negative and the zero point is offset by more than an order of magnitude from the data; in fact the formal linear regression returns .
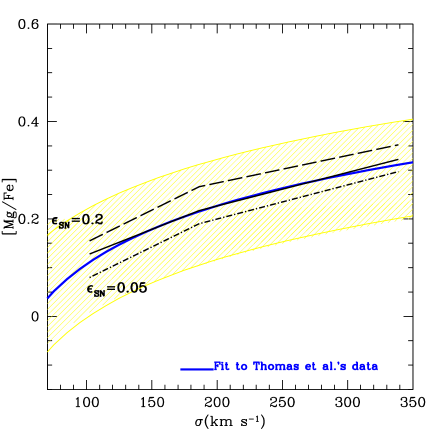
We now let only the most massive galaxies form through a SMBH-induced SF episode, whereas the lower mass ones are allowed to form only via the slow mode. From the entries of Table 1, however, we notice that both Model II and III galaxies populate the upper half of the MFMR therefore we are probing the shortest possible SF time-scales, as it can be seen by a close inspection of Fig. 2. In order to have a better fit to the mean trend, we let the SF timescale be slightly longer by lowering the SN ejection efficiency to the 10%. Basically, since is slightly higher than , the time at which the galactic wind sets in () occurs earlier, because the a suitable number of SN explosions occurs on a shorter timescale. An easy way to compensate for this effect - without changing the stellar metal production, the SFR and, hence, the SN rate itself- is to lower the mean energy input to the interstellar medium by SNe. In particular, this is done by halving the energy input from SNIa, since SNII already undergo cooling and contributed only to a few percent of the total budget (see Sec. 2.4). In this case we get the so-called hybrid case represented by the solid line (Model IV in Table 1, solid line in Figs. 2 and 4). It reproduces fairly well the observed trend, having practically the same values of the PM04 best model at a given galactic mass. In this case, in fact, we predict , in excellent agreement with Thomas et al.’s data. This last hybrid case works well in reproducing the MFMR, whose scatter can be explained by variations of local properties from galaxy to galaxy. In particular, we also show in fig. 4 the cases in which we set the total SN efficiency to the PM04 default value (i.e. 20% on the average) and to 5%, respectively. Interestingly, the best match is obtained by lowering the SN efficiency at variance with many theoretical works which, instead, require extremely high values in order to, e.g., trigger a wind (see Pipino et al., 2002 for discussion and references). We note that values smaller than 5% hardly allow the galactic wind to develop, whereas fractions much higher that 20% unbind the gas too early, leading to a situation which will be more similar to a disruption of the galaxies rather than a galactic wind. In the allowed region, instead, the SN efficiency can be regarded as a free parameter. In this regime, the SFR - which consumes gas and create massive stars which will explode as SNII - set the conditions for the wind to happen around 0.5 Gyr, whereas the contribution of SNIa is important in determining the exact occurrence of the wind. An advantage of the new formulation for is that it helps in reducing the SNIa transfer efficiency from the somehow unphysical value of 100% down to a more sensible percentage. We also deem implausible to entirely explain the MFMR by means a change in the SN efficiency - increasing as a function of mass - at a fixed . The effect of changes in other parameters, such as the infall timescale and the IMF have already been addressed in Thomas et al. (1999) and PM04, whereas the degeneracy between star formation efficiency and infall timescale was thoroughly discussed in Ferreras & Silk (2003); therefore we do not repeat here their analysis. Small variations in the above quantities can easily make the model galaxy properties span the observed range and recover the scatter. The important conclusion that we draw from our phenomenological approach is that both the infall and the star formation time-scales have to be much shorter in ellipticals than in spirals.
In principle, different prescriptions for the nucleosynthesis can affect the predicted quantities. As shown by PM04 (see also Thomas et al. 1999), a change in the yields for massive stars can produce a 0.2–0.3 dex difference in the final stellar [Mg/Fe]. However, when one makes use of recipes for the nucleosynthesis which have been constrained in the solar vicinity, the differences are smaller (see discussion in PM04).
Also, the type Ia progenitors and the mean delay in their occurrence since the episode of star formation are debated in the literature. On the basis of observational arguments, Mannucci et al. (2005, 2006) recently suggested that there is a bimodal distribution of delay times for the explosion of Type Ia SNe. In particular, a percentage from 35 to 50% of the total Type Ia SNe should be composed by systems with lifetimes as short as years, whereas the rest should arise from smaller mass progenitors with a much broader distribution of lifetimes. Matteucci et al. (2006) tested Mannucci et al.’s hypothesis in models of chemical evolution of galaxies of different morphological type: ellipticals, spirals and irregulars. They showed that this proposed scenario is compatible also with the main chemical properties of galaxies. For ellipticals the differences are less noticeable than in other morphological types, since they must have evolved very fast and at a very high redshift. The differences produced in the [Mg/Fe] ratio in the stars with respect to the results of PM04 are negligible.
In summary, the slow mode works well at low and intermediate galactic masses where we want to have [Mg/Fe] 0.2 dex on average, namely in a situation resembling more a low-rate star forming disc () rather than a massive elliptical. On the other hand, the extremely short SF rates in Fig. 2 for the lower mass spheroids, with the consequent [Mg/Fe] ratios 0.4 dex off the observed MFMR, tell us that these galaxies have to form stars on a timescale much longer than the dynamical time. Therefore, the jet-triggered mode in not suitable in the low mass regime. Indeed Silk (2005) already finds that the transition to jet-triggered mode occurs only at stellar masses larger than , value which is close to the final stellar mass of our intermediate-mass case. As a matter of fact, the jet-triggered mode proves to be reasonable only for the largest masses. This, in a sense, is reassuring, because the most massive objects are the most difficult to explain in any scenario of galaxy formation. Therefore they need some extreme recipe.
We also find remarkable the fact that, if we estimate the boosting factor in the SF due to the positive feedback simply as , we have only a factor of 5 (as shown in Fig. 1) for the most massive galaxies. In other words, as shown in Fig. 2, the SF rate predicted by the slow-mode for the most massive galaxy does not differ much from the fiducial behaviour of PM04. The reason for the similarity between the two modes at high masses is linked to the fact that , whereas . On the other hand, a factor of 5 increase in the star formation efficiency suffices to create differences in the final [Mg/Fe]; for instance the difference between for the lowest and the intermediate mass case is 3, whereas the difference with respect to the moss massive case amount to a factor of 7. We prefer the ”hybrid” case because it gives the best match with the observed slope in the MFMR, especially in the high galactic mass regime. In this sense the SMBH positive feedback shapes the MFMR, but only at the high mass end. The important novelty of our approach to the modelisation of the SF efficiency is that in both (the slow and the jet-triggered) cases scales as . This is what creates the downsizing behaviour. Changes in other model parameters - we explored the SN feedback efficiency, but stellar yields and IMF can have a role - affect mainly the zero-point of the MFMR and help us to achieve a best match of the mean observational trend, but cannot create the slope in the MFMR222Unless an unphysical variation of the stellar yields or a flattening of the IMF with galactic mass are invoked.. Unfortunately, the degree of degeneracy between model parameters is still quite high, and this hamper us from deriving more quantitative conclusions.
4 Conclusions
In this paper we have analysed the role of star formation efficiency in the creation of the mass-[Mg/Fe] relation (MFMR). We started from the heuristic approach of PM04, who required the SF efficiency to increase as a function of galactic mass, and we showed that the data can be explained by implementing a physically motivated value for the SF efficiency parameter .
To explain the higher star formation efficiency in the most massive galaxies, we appeal to SMBH-triggered SF. Following the arguments in Silk (2005), we argue that a short ( yr) super-Eddington phase can provide the accelerated triggering of associated star formation. The SMBH grows mostly in the initial super-Eddington phase while most of the spheroid stars grow during the succeeding Eddington phase, until the SN-driven wind quenches SF. The quenching is accomplished by the multiplicative factor of SN energy input induced by AGN outflows, and results in the usual SMBH mass-spheroid velocity dispersion (Magorrian) relation. According to our models, the galaxy is fully assembled on a timescale of 0.3-0.5 Gyr. This timescale is long enough, however, to allow the SMBH to complete its growth in order to reproduce the Magorrian relation.
In low- and intermediate-mass ETGs, instead, the SF efficiency occurs via a slow mode which is related to the Schmidt-Kennicutt law. In fact, supernova-induced feedback controls galaxy formation by rendering star formation slow and inefficient (relative to star formation in the most massive galaxies). By comparing the trend in the MFMR predicted by means of these two recipes for SF, we find that there must be a demarcation between these two modes at , resembling a trend seen in the SDSS data (Kauffmann et al. 2003). The observational scatter in the MFMR can be entirely explained as being intrinsic. Local effects, such as variations in the SNe feedback efficiency of order a factor of 2 with respect to the best model case, can induce or delay the occurrence of the galactic wind and thus contribute to setting the final value for [Mg/Fe].
Acknowledgments
A.P. thanks N.Nesvadba and M.Lattanzi for enlightening discussions. The anonymous referee is acknowledged for comments that improved the quality of the paper.
References
- [1]
- [] Antonuccio-Delogu V., Silk J., 2007, arXiv0710.0484
- [] Begelman M., Cioffi D., 1989, ApJ, 345, L21
- [] Bertin, G., Saglia, R.P., Stiavelli, M., 1992, ApJ, 384, 423
- [] Bicknell, G.V., Sutherland, R.S., van Breugel, W.J.M., Dopita, M.A.; Dey, A.; Miley, G.K. 2000, ApJ, 540, 678
- [] Bundy K., Ellis Richard S., Conselice, Christopher J. 2005, ApJ, 625, 621
- [] Burstein D., Bender R., Faber S.M., Nolthenius R. 1997, AJ, 114, 1365
- [] Cappellaro E., Evans R., Turatto M., AA, 1999, 351, 459
- [] Carollo C.M., Danziger I.J., Buson L. 1993, MNRAS, 265, 553
- [] Chiosi C., Carraro G. 2002, MNRAS, 335, 335
- [] Croft, S., van Breugel, W., de Vries, W., Dopita, M., Martin, C. et al. 2006, ApJ, 647, 1040
- [] Della Valle, M., Panagia, N., Padovani, P., Cappellaro, E., Mannucci, F., Turatto, M 2005, ApJ, 629, 750
- [] Dietrich M. , Hamann, F. 2004, ApJ, 611, 761
- [] Faber S.M., Worthey G., Gonzalez J.J. 1992, in IAU Symp. n.149, eds. B. Barbuy A. Renzini, p. 255
- [] Ferreras I., Silk J. 2003, MNRAS, 344, 455
- [] Ferrarese L. , Merritt D. 2000, ApJ, 539, L9
- [] Fragile, P. C., Murray, S. D., Anninos, P., & van Breugel, W. 2004, ApJ, 604, 74
- [] Gebhardt, et al. 2000, ApJ, 539, L13
- [] Graves, G.J., Faber, S.M., Schiavon, R.P., Yan, R. 2007, ApJ, 671, 243
- [] Greggio L., Renzini A. 1983, AA, 118, 217
- [] Hasinger G., Miyaji, T., Schmidt, M. 2005 A&A, 441, 417
- [] Jaffe, W., 1983, MNRAS, 202, 995
- [] Kauffmann G.,et al. 2003, MNRAS, 341, 33
- [] Kauffmann G., Charlot S. 1998, MNRAS, 294, 705
- [] Klamer J., Ekers R. D., Sadler E. M., Hunstead R. W. 2004, ApJ, 612, 97
- [] Kobayashi C.,Springel V., White S.D.M., 2007, MNRAS, 376, 1465
- [] Krause, M., Alexander, P. 2007, MNRAS, 376, 465
- [] Krause, M., Fendt, C., Neininger, N. 2007, A&A, 467, 1037
- [] Kuntschner H. 2000, MNRAS, 315, 184
- [] Kuntschner H., Lucey J.R., Smith R.J., Hudson M.J., Davies R.L. 2001, MNRAS, 323, 615
- [] Larson R.B., 1974, MNRAS, 166, 585
- [] Magorrian J. et al 1998, AJ, 115, 2285
- [] Maiolino R., Nagao, T., Grazian, A., Cocchia, F., Marconi., A., Mannucci, F, Cimatti, A., Pipino, A. et al. 2008, A&A, 488, 463
- [] Mannucci, F., Della Valle, M. & Panagia, N., 2006, MNRAS, 370, 773
- [] Mannucci, F., Della Valle, M., Panagia, N., Cappellaro, E., Cresci, G., Maiolino, R., Petrosian, A., Turatto, M., 2005, A&A, 433, 807
- [] Martinelli A., Matteucci F., Colafrancesco S., 1998, MNRAS, 298, 42
- [] Matteucci F. 1994, AA, 288, 57
- [] Matteucci F. 2001, The chemical evolution of the Galaxy, Kluwer Academic Publishers, Dordrecht
- [] Matteucci F., Greggio L., 1986, AA, 154, 279
- [] Matteucci, F.; Panagia, N.; Pipino, A.; Mannucci, F.; Recchi, S.; Della Valle, M. 2006, MNRAS, 372, 265
- [] Matteucci F., Ponzone R., Gibson B.K., 1998, AA, 335, 855
- [] Matteucci, F., Tornambe’, A., 1987, AA, 185, 51
- [] Nagashima M., Lacey C.G., Okamoto T., Baugh C.M., Frenk C.S., Cole S. 2005, MNRAS, 363L, 31
- [] Nelan J.E., et al 2005, ApJ, 632, 137
- [] Nomoto K., Hashimoto M., Tsujimoto T., Thielemann F.K., Kishimoto N., Kubo Y., Nakasato N., 1997, Nuclear Physics A, A621, 467
- [] Perez-Gonzalez P. G. et al 2007, ApJ in press, arXiv0709.1354
- [] Pipino A., Matteucci F. 2004, MNRAS, 347, 968 (PM04)
- [] Pipino A., Matteucci F. 2006, MNRAS, 365, 1114
- [] Pipino A., Matteucci F. 2008, A&A, 486, 763
- [] Pipino A., Matteucci F., Borgani S., Biviano A. 2002, NewA, 7, 227
- [] Recchi, S., Matteucci, F., D’Ercole, A., 2001, MNRAS, 322, 800
- [] Romano D., Silva L., Matteucci F., Danese L. 2002, MNRAS, 334, 444
- [] Salpeter E.E., 1955, ApJ, 121, 161
- [] Saxton C., Bicknell G., Sutherland R., Midgeley S. 2005, MNRAS, 359, 781
- [] Scarlata C., et al 2007, ApJS, 172, 494
- [] Silk J. 2005, MNRAS, 364, 1337
- [] Silk J. , Rees M. 1998, A&A, 331, L1
- [] Smith, R.J.; Hudson, M.J.; Lucey, J.R.; Nelan, J.E.; Wegner, G.A. 2006, MNRAS,369, 1419
- [] Thielemann F.K., Nomoto K., Hashimoto M. 1996, ApJ, 460, 408
- [] Thomas, D., Greggio, L., Bender, R., 1999, MNRAS, 302, 537
- [] Thomas D., Maraston C., Bender R., Mendes de Oliveira C. 2005, ApJ, 621, 673
- [] Thomas D., et al. 2008, MNRAS in press
- [] Thomas D., Kauffmann G. 1999, in Spectroscopic dating of stars and galaxies, ASP Conference Series, 192, eds. I. Hubeny, S. Heap, R. Cornett, 261
- [] van Breugel, W., Filippenko, A. V., Heckman, T., & Miley, G. 1985, ApJ, 293, 83
- [] van den Hoek L.B., Groenewegen M.A.T. 1997, AAS, 123, 305
- [] van Dokkum, P. 2008, ApJ, 674, 29
- [] Venemans, B. et al. 2004, A&A, 424, L17
- [] Volonteri M. , Rees M. 2005, ApJ, 633, 624
- [] Weiss A., Peletier R.F., Matteucci F. 1995, AA, 296, 73
- [] White S.D.M., Rees M.J., 1978, MNRAS, 183, 341
- [] Worthey G., Faber S.M., Gonzalez J.J. 1992, ApJ, 398, 69
- [] Ziegler B.L., Thomas D., Bohm A., Bender R., Fritz A., Maraston C. 2005, A&A, 433, 519
- [] Zirm, A. et al 2005, ApJ, 630, 68