CDF Collaboration222With visitors from aUniversity of Massachusetts Amherst, Amherst, Massachusetts 01003,
bUniversiteit Antwerpen, B-2610 Antwerp, Belgium,
cUniversity of Bristol, Bristol BS8 1TL, United Kingdom,
dChinese Academy of Sciences, Beijing 100864, China,
eIstituto Nazionale di Fisica Nucleare, Sezione di Cagliari, 09042 Monserrato (Cagliari), Italy,
fUniversity of California Irvine, Irvine, CA 92697,
gUniversity of California Santa Cruz, Santa Cruz, CA 95064,
hCornell University, Ithaca, NY 14853,
iUniversity of Cyprus, Nicosia CY-1678, Cyprus,
jUniversity College Dublin, Dublin 4, Ireland,
kRoyal Society of Edinburgh/Scottish Executive Support Research Fellow,
lUniversity of Edinburgh, Edinburgh EH9 3JZ, United Kingdom,
mUniversidad Iberoamericana, Mexico D.F., Mexico,
nQueen Mary, University of London, London, E1 4NS, England,
oUniversity of Manchester, Manchester M13 9PL, England,
pNagasaki Institute of Applied Science, Nagasaki, Japan,
qUniversity of Notre Dame, Notre Dame, IN 46556,
rUniversity de Oviedo, E-33007 Oviedo, Spain,
sTexas Tech University, Lubbock, TX 79409,
tIFIC(CSIC-Universitat de Valencia), 46071 Valencia, Spain,
uUniversity of Virginia, Charlottesville, VA 22904,
ccOn leave from J. Stefan Institute, Ljubljana, Slovenia,
First Measurement of the Ratio of Branching Fractions
T. AaltonenDivision of High Energy Physics, Department of Physics, University of Helsinki and Helsinki Institute of Physics, FIN-00014, Helsinki, FinlandJ. AdelmanEnrico Fermi Institute, University of Chicago, Chicago, Illinois 60637T. AkimotoUniversity of Tsukuba, Tsukuba, Ibaraki 305, JapanM.G. AlbrowFermi National Accelerator Laboratory, Batavia, Illinois 60510B. Álvarez GonzálezInstituto de Fisica de Cantabria, CSIC-University of Cantabria, 39005 Santander, SpainS. AmeriowIstituto Nazionale di Fisica Nucleare, Sezione di Padova-Trento, wUniversity of Padova, I-35131 Padova, ItalyD. AmideiUniversity of Michigan, Ann Arbor, Michigan 48109A. AnastassovNorthwestern University, Evanston, Illinois 60208A. AnnoviLaboratori Nazionali di Frascati, Istituto Nazionale di Fisica Nucleare, I-00044 Frascati, ItalyJ. AntosComenius University, 842 48 Bratislava, Slovakia; Institute of Experimental Physics, 040 01 Kosice, SlovakiaG. ApollinariFermi National Accelerator Laboratory, Batavia, Illinois 60510A. ApresyanPurdue University, West Lafayette, Indiana 47907T. ArisawaWaseda University, Tokyo 169, JapanA. ArtikovJoint Institute for Nuclear Research, RU-141980 Dubna, RussiaW. AshmanskasFermi National Accelerator Laboratory, Batavia, Illinois 60510A. AttalInstitut de Fisica d’Altes Energies, Universitat Autonoma de Barcelona, E-08193, Bellaterra (Barcelona), SpainA. AurisanoTexas A&M University, College Station, Texas 77843F. AzfarUniversity of Oxford, Oxford OX1 3RH, United KingdomP. AzzurrizIstituto Nazionale di Fisica Nucleare Pisa, xUniversity of Pisa, yUniversity of Siena and zScuola Normale Superiore, I-56127 Pisa, ItalyW. BadgettFermi National Accelerator Laboratory, Batavia, Illinois 60510A. Barbaro-GaltieriErnest Orlando Lawrence Berkeley National Laboratory, Berkeley, California 94720V.E. BarnesPurdue University, West Lafayette, Indiana 47907B.A. BarnettThe Johns Hopkins University, Baltimore, Maryland 21218V. BartschUniversity College London, London WC1E 6BT, United KingdomG. BauerMassachusetts Institute of Technology, Cambridge, Massachusetts 02139P.-H. BeaucheminInstitute of Particle Physics: McGill University, Montréal, Québec, Canada H3A 2T8; Simon Fraser University, Burnaby, British Columbia, Canada V5A 1S6; University of Toronto, Toronto, Ontario, Canada M5S 1A7; and TRIUMF, Vancouver, British Columbia, Canada V6T 2A3F. BedeschiIstituto Nazionale di Fisica Nucleare Pisa, xUniversity of Pisa, yUniversity of Siena and zScuola Normale Superiore, I-56127 Pisa, ItalyD. BeecherUniversity College London, London WC1E 6BT, United KingdomS. BehariThe Johns Hopkins University, Baltimore, Maryland 21218G. BellettinixIstituto Nazionale di Fisica Nucleare Pisa, xUniversity of Pisa, yUniversity of Siena and zScuola Normale Superiore, I-56127 Pisa, ItalyJ. BellingerUniversity of Wisconsin, Madison, Wisconsin 53706D. BenjaminDuke University, Durham, North Carolina 27708A. BeretvasFermi National Accelerator Laboratory, Batavia, Illinois 60510J. BeringerErnest Orlando Lawrence Berkeley National Laboratory, Berkeley, California 94720A. BhattiThe Rockefeller University, New York, New York 10021M. BinkleyFermi National Accelerator Laboratory, Batavia, Illinois 60510D. BisellowIstituto Nazionale di Fisica Nucleare, Sezione di Padova-Trento, wUniversity of Padova, I-35131 Padova, ItalyI. BizjakccUniversity College London, London WC1E 6BT, United KingdomR.E. BlairArgonne National Laboratory, Argonne, Illinois 60439C. BlockerBrandeis University, Waltham, Massachusetts 02254B. BlumenfeldThe Johns Hopkins University, Baltimore, Maryland 21218A. BocciDuke University, Durham, North Carolina 27708A. BodekUniversity of Rochester, Rochester, New York 14627V. BoisvertUniversity of Rochester, Rochester, New York 14627G. BollaPurdue University, West Lafayette, Indiana 47907D. BortolettoPurdue University, West Lafayette, Indiana 47907J. BoudreauUniversity of Pittsburgh, Pittsburgh, Pennsylvania 15260A. BoveiaUniversity of California, Santa Barbara, Santa Barbara, California 93106B. BrauaUniversity of California, Santa Barbara, Santa Barbara, California 93106A. BridgemanUniversity of Illinois, Urbana, Illinois 61801L. BrigliadoriIstituto Nazionale di Fisica Nucleare, Sezione di Padova-Trento, wUniversity of Padova, I-35131 Padova, ItalyC. BrombergMichigan State University, East Lansing, Michigan 48824E. BrubakerEnrico Fermi Institute, University of Chicago, Chicago, Illinois 60637J. BudagovJoint Institute for Nuclear Research, RU-141980 Dubna, RussiaH.S. BuddUniversity of Rochester, Rochester, New York 14627S. BuddUniversity of Illinois, Urbana, Illinois 61801S. BurkeFermi National Accelerator Laboratory, Batavia, Illinois 60510K. BurkettFermi National Accelerator Laboratory, Batavia, Illinois 60510G. BusettowIstituto Nazionale di Fisica Nucleare, Sezione di Padova-Trento, wUniversity of Padova, I-35131 Padova, ItalyP. BusseykGlasgow University, Glasgow G12 8QQ, United KingdomA. BuzatuInstitute of Particle Physics: McGill University, Montréal, Québec, Canada H3A 2T8; Simon Fraser
University, Burnaby, British Columbia, Canada V5A 1S6; University of Toronto, Toronto, Ontario, Canada M5S 1A7; and TRIUMF, Vancouver, British Columbia, Canada V6T 2A3K. L. ByrumArgonne National Laboratory, Argonne, Illinois 60439S. CabrerauDuke University, Durham, North Carolina 27708C. CalanchaCentro de Investigaciones Energeticas Medioambientales y Tecnologicas, E-28040 Madrid, SpainM. CampanelliMichigan State University, East Lansing, Michigan 48824M. CampbellUniversity of Michigan, Ann Arbor, Michigan 48109F. CanelliFermi National Accelerator Laboratory, Batavia, Illinois 60510A. CanepaUniversity of Pennsylvania, Philadelphia, Pennsylvania 19104B. CarlsUniversity of Illinois, Urbana, Illinois 61801D. CarlsmithUniversity of Wisconsin, Madison, Wisconsin 53706R. CarosiIstituto Nazionale di Fisica Nucleare Pisa, xUniversity of Pisa, yUniversity of Siena and zScuola Normale Superiore, I-56127 Pisa, ItalyS. CarrillomUniversity of Florida, Gainesville, Florida 32611S. CarronInstitute of Particle Physics: McGill University, Montréal, Québec, Canada H3A 2T8; Simon Fraser University, Burnaby, British Columbia, Canada V5A 1S6; University of Toronto, Toronto, Ontario, Canada M5S 1A7; and TRIUMF, Vancouver, British Columbia, Canada V6T 2A3B. CasalInstituto de Fisica de Cantabria, CSIC-University of Cantabria, 39005 Santander, SpainM. CasarsaFermi National Accelerator Laboratory, Batavia, Illinois 60510A. CastrovIstituto Nazionale di Fisica Nucleare Bologna, vUniversity of Bologna, I-40127 Bologna, ItalyP. CatastiniyIstituto Nazionale di Fisica Nucleare Pisa, xUniversity of Pisa, yUniversity of Siena and zScuola Normale Superiore, I-56127 Pisa, ItalyD. CauzbbIstituto Nazionale di Fisica Nucleare Trieste/Udine, bbUniversity of Trieste/Udine, ItalyV. CavaliereyIstituto Nazionale di Fisica Nucleare Pisa, xUniversity of Pisa, yUniversity of Siena and zScuola Normale Superiore, I-56127 Pisa, ItalyM. Cavalli-SforzaInstitut de Fisica d’Altes Energies, Universitat Autonoma de Barcelona, E-08193, Bellaterra (Barcelona), SpainA. CerriErnest Orlando Lawrence Berkeley National Laboratory, Berkeley, California 94720L. CerritonUniversity College London, London WC1E 6BT, United KingdomS.H. ChangCenter for High Energy Physics: Kyungpook National University, Daegu 702-701, Korea; Seoul National University, Seoul 151-742, Korea; Sungkyunkwan University, Suwon 440-746, Korea; Korea Institute of Science and Technology Information, Daejeon, 305-806, Korea; Chonnam National University, Gwangju, 500-757, KoreaY.C. ChenInstitute of Physics, Academia Sinica, Taipei, Taiwan 11529, Republic of ChinaM. ChertokUniversity of California, Davis, Davis, California 95616G. ChiarelliIstituto Nazionale di Fisica Nucleare Pisa, xUniversity of Pisa, yUniversity of Siena and zScuola Normale Superiore, I-56127 Pisa, ItalyG. ChlachidzeFermi National Accelerator Laboratory, Batavia, Illinois 60510F. ChlebanaFermi National Accelerator Laboratory, Batavia, Illinois 60510K. ChoCenter for High Energy Physics: Kyungpook National University, Daegu 702-701, Korea; Seoul National University, Seoul 151-742, Korea; Sungkyunkwan University, Suwon 440-746, Korea; Korea Institute of Science and Technology Information, Daejeon, 305-806, Korea; Chonnam National University, Gwangju, 500-757, KoreaD. ChokheliJoint Institute for Nuclear Research, RU-141980 Dubna, RussiaJ.P. ChouHarvard University, Cambridge, Massachusetts 02138G. ChoudalakisMassachusetts Institute of Technology, Cambridge, Massachusetts 02139S.H. ChuangRutgers University, Piscataway, New Jersey 08855K. ChungCarnegie Mellon University, Pittsburgh, PA 15213W.H. ChungUniversity of Wisconsin, Madison, Wisconsin 53706Y.S. ChungUniversity of Rochester, Rochester, New York 14627T. ChwalekInstitut für Experimentelle Kernphysik, Universität Karlsruhe, 76128 Karlsruhe, GermanyC.I. CiobanuLPNHE, Universite Pierre et Marie Curie/IN2P3-CNRS, UMR7585, Paris, F-75252 FranceM.A. CiocciyIstituto Nazionale di Fisica Nucleare Pisa, xUniversity of Pisa, yUniversity of Siena and zScuola Normale Superiore, I-56127 Pisa, ItalyA. ClarkUniversity of Geneva, CH-1211 Geneva 4, SwitzerlandD. ClarkBrandeis University, Waltham, Massachusetts 02254G. CompostellaIstituto Nazionale di Fisica Nucleare, Sezione di Padova-Trento, wUniversity of Padova, I-35131 Padova, ItalyM.E. ConveryFermi National Accelerator Laboratory, Batavia, Illinois 60510J. ConwayUniversity of California, Davis, Davis, California 95616M. CordelliLaboratori Nazionali di Frascati, Istituto Nazionale di Fisica Nucleare, I-00044 Frascati, ItalyG. CortianawIstituto Nazionale di Fisica Nucleare, Sezione di Padova-Trento, wUniversity of Padova, I-35131 Padova, ItalyC.A. CoxUniversity of California, Davis, Davis, California 95616D.J. CoxUniversity of California, Davis, Davis, California 95616F. CresciolixIstituto Nazionale di Fisica Nucleare Pisa, xUniversity of Pisa, yUniversity of Siena and zScuola Normale Superiore, I-56127 Pisa, ItalyC. Cuenca AlmenaruUniversity of California, Davis, Davis, California 95616J. CuevasrInstituto de Fisica de Cantabria, CSIC-University of Cantabria, 39005 Santander, SpainR. CulbertsonFermi National Accelerator Laboratory, Batavia, Illinois 60510J.C. CullyUniversity of Michigan, Ann Arbor, Michigan 48109D. DagenhartFermi National Accelerator Laboratory, Batavia, Illinois 60510M. DattaFermi National Accelerator Laboratory, Batavia, Illinois 60510T. DaviesGlasgow University, Glasgow G12 8QQ, United KingdomP. de BarbaroUniversity of Rochester, Rochester, New York 14627S. De CeccoIstituto Nazionale di Fisica Nucleare, Sezione di Roma 1, aaSapienza Università di Roma, I-00185 Roma, ItalyA. DeisherErnest Orlando Lawrence Berkeley National Laboratory, Berkeley, California 94720G. De LorenzoInstitut de Fisica d’Altes Energies, Universitat Autonoma de Barcelona, E-08193, Bellaterra (Barcelona), SpainM. Dell’OrsoxIstituto Nazionale di Fisica Nucleare Pisa, xUniversity of Pisa, yUniversity of Siena and zScuola Normale Superiore, I-56127 Pisa, ItalyC. DelucaInstitut de Fisica d’Altes Energies, Universitat Autonoma de Barcelona, E-08193, Bellaterra (Barcelona), SpainL. DemortierThe Rockefeller University, New York, New York 10021J. DengDuke University, Durham, North Carolina 27708M. DeninnoIstituto Nazionale di Fisica Nucleare Bologna, vUniversity of Bologna, I-40127 Bologna, ItalyP.F. DerwentFermi National Accelerator Laboratory, Batavia, Illinois 60510G.P. di GiovanniLPNHE, Universite Pierre et Marie Curie/IN2P3-CNRS, UMR7585, Paris, F-75252 FranceC. DionisiaaIstituto Nazionale di Fisica Nucleare, Sezione di Roma 1, aaSapienza Università di Roma, I-00185 Roma, ItalyB. Di RuzzabbIstituto Nazionale di Fisica Nucleare Trieste/Udine, bbUniversity of Trieste/Udine, ItalyJ.R. DittmannBaylor University, Waco, Texas 76798M. D’OnofrioInstitut de Fisica d’Altes Energies, Universitat Autonoma de Barcelona, E-08193, Bellaterra (Barcelona), SpainS. DonatixIstituto Nazionale di Fisica Nucleare Pisa, xUniversity of Pisa, yUniversity of Siena and zScuola Normale Superiore, I-56127 Pisa, ItalyP. DongUniversity of California, Los Angeles, Los Angeles, California 90024J. DoniniIstituto Nazionale di Fisica Nucleare, Sezione di Padova-Trento, wUniversity of Padova, I-35131 Padova, ItalyT. DorigoIstituto Nazionale di Fisica Nucleare, Sezione di Padova-Trento, wUniversity of Padova, I-35131 Padova, ItalyS. DubeRutgers University, Piscataway, New Jersey 08855J. EfronThe Ohio State University, Columbus, Ohio 43210A. ElaginTexas A&M University, College Station, Texas 77843R. ErbacherUniversity of California, Davis, Davis, California 95616D. ErredeUniversity of Illinois, Urbana, Illinois 61801S. ErredeUniversity of Illinois, Urbana, Illinois 61801R. EusebiFermi National Accelerator Laboratory, Batavia, Illinois 60510H.C. FangErnest Orlando Lawrence Berkeley National Laboratory, Berkeley, California 94720S. FarringtonUniversity of Oxford, Oxford OX1 3RH, United KingdomW.T. FedorkoEnrico Fermi Institute, University of Chicago, Chicago, Illinois 60637R.G. FeildYale University, New Haven, Connecticut 06520M. FeindtInstitut für Experimentelle Kernphysik, Universität Karlsruhe, 76128 Karlsruhe, GermanyJ.P. FernandezCentro de Investigaciones Energeticas Medioambientales y Tecnologicas, E-28040 Madrid, SpainC. FerrazzazIstituto Nazionale di Fisica Nucleare Pisa, xUniversity of Pisa, yUniversity of Siena and zScuola Normale Superiore, I-56127 Pisa, ItalyR. FieldUniversity of Florida, Gainesville, Florida 32611G. FlanaganPurdue University, West Lafayette, Indiana 47907R. ForrestUniversity of California, Davis, Davis, California 95616M.J. FrankBaylor University, Waco, Texas 76798M. FranklinHarvard University, Cambridge, Massachusetts 02138J.C. FreemanFermi National Accelerator Laboratory, Batavia, Illinois 60510I. FuricUniversity of Florida, Gainesville, Florida 32611M. GallinaroIstituto Nazionale di Fisica Nucleare, Sezione di Roma 1, aaSapienza Università di Roma, I-00185 Roma, ItalyJ. GalyardtCarnegie Mellon University, Pittsburgh, PA 15213F. GarbersonUniversity of California, Santa Barbara, Santa Barbara, California 93106J.E. GarciaUniversity of Geneva, CH-1211 Geneva 4, SwitzerlandA.F. GarfinkelPurdue University, West Lafayette, Indiana 47907K. GenserFermi National Accelerator Laboratory, Batavia, Illinois 60510H. GerberichUniversity of Illinois, Urbana, Illinois 61801D. GerdesUniversity of Michigan, Ann Arbor, Michigan 48109A. GesslerInstitut für Experimentelle Kernphysik, Universität Karlsruhe, 76128 Karlsruhe, GermanyS. GiaguaaIstituto Nazionale di Fisica Nucleare, Sezione di Roma 1, aaSapienza Università di Roma, I-00185 Roma, ItalyV. GiakoumopoulouUniversity of Athens, 157 71 Athens, GreeceP. GiannettiIstituto Nazionale di Fisica Nucleare Pisa, xUniversity of Pisa, yUniversity of Siena and zScuola Normale Superiore, I-56127 Pisa, ItalyK. GibsonUniversity of Pittsburgh, Pittsburgh, Pennsylvania 15260J.L. GimmellUniversity of Rochester, Rochester, New York 14627C.M. GinsburgFermi National Accelerator Laboratory, Batavia, Illinois 60510N. GiokarisUniversity of Athens, 157 71 Athens, GreeceM. GiordanibbIstituto Nazionale di Fisica Nucleare Trieste/Udine, bbUniversity of Trieste/Udine, ItalyP. GirominiLaboratori Nazionali di Frascati, Istituto Nazionale di Fisica Nucleare, I-00044 Frascati, ItalyM. GiuntaxIstituto Nazionale di Fisica Nucleare Pisa, xUniversity of Pisa, yUniversity of Siena and zScuola Normale Superiore, I-56127 Pisa, ItalyG. GiurgiuThe Johns Hopkins University, Baltimore, Maryland 21218V. GlagolevJoint Institute for Nuclear Research, RU-141980 Dubna, RussiaD. GlenzinskiFermi National Accelerator Laboratory, Batavia, Illinois 60510M. GoldUniversity of New Mexico, Albuquerque, New Mexico 87131N. GoldschmidtUniversity of Florida, Gainesville, Florida 32611A. GolossanovFermi National Accelerator Laboratory, Batavia, Illinois 60510G. GomezInstituto de Fisica de Cantabria, CSIC-University of Cantabria, 39005 Santander, SpainG. Gomez-CeballosMassachusetts Institute of Technology, Cambridge, Massachusetts 02139M. GoncharovTexas A&M University, College Station, Texas 77843O. GonzálezCentro de Investigaciones Energeticas Medioambientales y Tecnologicas, E-28040 Madrid, SpainI. GorelovUniversity of New Mexico, Albuquerque, New Mexico 87131A.T. GoshawDuke University, Durham, North Carolina 27708K. GoulianosThe Rockefeller University, New York, New York 10021A. GreselewIstituto Nazionale di Fisica Nucleare, Sezione di Padova-Trento, wUniversity of Padova, I-35131 Padova, ItalyS. GrinsteinHarvard University, Cambridge, Massachusetts 02138C. Grosso-PilcherEnrico Fermi Institute, University of Chicago, Chicago, Illinois 60637R.C. GroupFermi National Accelerator Laboratory, Batavia, Illinois 60510U. GrundlerUniversity of Illinois, Urbana, Illinois 61801J. Guimaraes da CostaHarvard University, Cambridge, Massachusetts 02138Z. Gunay-UnalanMichigan State University, East Lansing, Michigan 48824C. HaberErnest Orlando Lawrence Berkeley National Laboratory, Berkeley, California 94720K. HahnMassachusetts Institute of Technology, Cambridge, Massachusetts 02139S.R. HahnFermi National Accelerator Laboratory, Batavia, Illinois 60510E. HalkiadakisRutgers University, Piscataway, New Jersey 08855B.-Y. HanUniversity of Rochester, Rochester, New York 14627J.Y. HanUniversity of Rochester, Rochester, New York 14627F. HappacherLaboratori Nazionali di Frascati, Istituto Nazionale di Fisica Nucleare, I-00044 Frascati, ItalyK. HaraUniversity of Tsukuba, Tsukuba, Ibaraki 305, JapanD. HareRutgers University, Piscataway, New Jersey 08855M. HareTufts University, Medford, Massachusetts 02155S. HarperUniversity of Oxford, Oxford OX1 3RH, United KingdomR.F. HarrWayne State University, Detroit, Michigan 48201R.M. HarrisFermi National Accelerator Laboratory, Batavia, Illinois 60510M. HartzUniversity of Pittsburgh, Pittsburgh, Pennsylvania 15260K. HatakeyamaThe Rockefeller University, New York, New York 10021C. HaysUniversity of Oxford, Oxford OX1 3RH, United KingdomM. HeckInstitut für Experimentelle Kernphysik, Universität Karlsruhe, 76128 Karlsruhe, GermanyA. HeijboerUniversity of Pennsylvania, Philadelphia, Pennsylvania 19104J. HeinrichUniversity of Pennsylvania, Philadelphia, Pennsylvania 19104C. HendersonMassachusetts Institute of Technology, Cambridge, Massachusetts 02139M. HerndonUniversity of Wisconsin, Madison, Wisconsin 53706J. HeuserInstitut für Experimentelle Kernphysik, Universität Karlsruhe, 76128 Karlsruhe, GermanyS. HewamanageBaylor University, Waco, Texas 76798D. HidasDuke University, Durham, North Carolina 27708C.S. HillcUniversity of California, Santa Barbara, Santa Barbara, California 93106D. HirschbuehlInstitut für Experimentelle Kernphysik, Universität Karlsruhe, 76128 Karlsruhe, GermanyA. HockerFermi National Accelerator Laboratory, Batavia, Illinois 60510S. HouInstitute of Physics, Academia Sinica, Taipei, Taiwan 11529, Republic of ChinaM. HouldenUniversity of Liverpool, Liverpool L69 7ZE, United KingdomS.-C. HsuErnest Orlando Lawrence Berkeley National Laboratory, Berkeley, California 94720B.T. HuffmanUniversity of Oxford, Oxford OX1 3RH, United KingdomR.E. HughesThe Ohio State University, Columbus, Ohio 43210U. HusemannM. HusseinMichigan State University, East Lansing, Michigan 48824U. HusemannYale University, New Haven, Connecticut 06520J. HustonMichigan State University, East Lansing, Michigan 48824J. IncandelaUniversity of California, Santa Barbara, Santa Barbara, California 93106G. IntrozziIstituto Nazionale di Fisica Nucleare Pisa, xUniversity of Pisa, yUniversity of Siena and zScuola Normale Superiore, I-56127 Pisa, ItalyM. IoriaaIstituto Nazionale di Fisica Nucleare, Sezione di Roma 1, aaSapienza Università di Roma, I-00185 Roma, ItalyA. IvanovUniversity of California, Davis, Davis, California 95616E. JamesFermi National Accelerator Laboratory, Batavia, Illinois 60510B. JayatilakaDuke University, Durham, North Carolina 27708E.J. JeonCenter for High Energy Physics: Kyungpook National University, Daegu 702-701, Korea; Seoul National University, Seoul 151-742, Korea; Sungkyunkwan University, Suwon 440-746, Korea; Korea Institute of Science and Technology Information, Daejeon, 305-806, Korea; Chonnam National University, Gwangju, 500-757, KoreaM.K. JhaIstituto Nazionale di Fisica Nucleare Bologna, vUniversity of Bologna, I-40127 Bologna, ItalyS. JindarianiFermi National Accelerator Laboratory, Batavia, Illinois 60510W. JohnsonUniversity of California, Davis, Davis, California 95616M. JonesPurdue University, West Lafayette, Indiana 47907K.K. JooCenter for High Energy Physics: Kyungpook National University, Daegu 702-701, Korea; Seoul National University, Seoul 151-742, Korea; Sungkyunkwan University, Suwon 440-746, Korea; Korea Institute of Science and Technology Information, Daejeon, 305-806, Korea; Chonnam National University, Gwangju, 500-757, KoreaS.Y. JunCarnegie Mellon University, Pittsburgh, PA 15213J.E. JungCenter for High Energy Physics: Kyungpook National University, Daegu 702-701, Korea; Seoul National University, Seoul 151-742, Korea; Sungkyunkwan University, Suwon 440-746, Korea; Korea Institute of Science and Technology Information, Daejeon, 305-806, Korea; Chonnam National University, Gwangju, 500-757, KoreaT.R. JunkFermi National Accelerator Laboratory, Batavia, Illinois 60510T. KamonTexas A&M University, College Station, Texas 77843D. KarUniversity of Florida, Gainesville, Florida 32611P.E. KarchinWayne State University, Detroit, Michigan 48201Y. KatoOsaka City University, Osaka 588, JapanR. KephartFermi National Accelerator Laboratory, Batavia, Illinois 60510J. KeungUniversity of Pennsylvania, Philadelphia, Pennsylvania 19104V. KhotilovichTexas A&M University, College Station, Texas 77843B. KilminsterFermi National Accelerator Laboratory, Batavia, Illinois 60510D.H. KimCenter for High Energy Physics: Kyungpook National University, Daegu 702-701, Korea; Seoul National University, Seoul 151-742, Korea; Sungkyunkwan University, Suwon 440-746, Korea; Korea Institute of Science and Technology Information, Daejeon, 305-806, Korea; Chonnam National University, Gwangju, 500-757, KoreaH.S. KimCenter for High Energy Physics: Kyungpook National University, Daegu 702-701, Korea; Seoul National University, Seoul 151-742, Korea; Sungkyunkwan University, Suwon 440-746, Korea; Korea Institute of Science and Technology Information, Daejeon, 305-806, Korea; Chonnam National University, Gwangju, 500-757, KoreaH.W. KimCenter for High Energy Physics: Kyungpook National University, Daegu 702-701, Korea; Seoul National University, Seoul 151-742, Korea; Sungkyunkwan University, Suwon 440-746, Korea; Korea Institute of Science and Technology Information, Daejeon, 305-806, Korea; Chonnam National University, Gwangju, 500-757, KoreaJ.E. KimCenter for High Energy Physics: Kyungpook National University, Daegu 702-701, Korea; Seoul National University, Seoul 151-742, Korea; Sungkyunkwan University, Suwon 440-746, Korea; Korea Institute of Science and Technology Information, Daejeon, 305-806, Korea; Chonnam National University, Gwangju, 500-757, KoreaM.J. KimLaboratori Nazionali di Frascati, Istituto Nazionale di Fisica Nucleare, I-00044 Frascati, ItalyS.B. KimCenter for High Energy Physics: Kyungpook National University, Daegu 702-701, Korea; Seoul National University, Seoul 151-742, Korea; Sungkyunkwan University, Suwon 440-746, Korea; Korea Institute of Science and Technology Information, Daejeon, 305-806, Korea; Chonnam National University, Gwangju, 500-757, KoreaS.H. KimUniversity of Tsukuba, Tsukuba, Ibaraki 305, JapanY.K. KimEnrico Fermi Institute, University of Chicago, Chicago, Illinois 60637N. KimuraUniversity of Tsukuba, Tsukuba, Ibaraki 305, JapanL. KirschBrandeis University, Waltham, Massachusetts 02254S. KlimenkoUniversity of Florida, Gainesville, Florida 32611B. KnutesonMassachusetts Institute of Technology, Cambridge, Massachusetts 02139B.R. KoDuke University, Durham, North Carolina 27708K. KondoWaseda University, Tokyo 169, JapanD.J. KongCenter for High Energy Physics: Kyungpook National University, Daegu 702-701, Korea; Seoul National University, Seoul 151-742, Korea; Sungkyunkwan University, Suwon 440-746, Korea; Korea Institute of Science and Technology Information, Daejeon, 305-806, Korea; Chonnam National University, Gwangju, 500-757, KoreaJ. KonigsbergUniversity of Florida, Gainesville, Florida 32611A. KorytovUniversity of Florida, Gainesville, Florida 32611A.V. KotwalDuke University, Durham, North Carolina 27708M. KrepsInstitut für Experimentelle Kernphysik, Universität Karlsruhe, 76128 Karlsruhe, GermanyJ. KrollUniversity of Pennsylvania, Philadelphia, Pennsylvania 19104D. KropEnrico Fermi Institute, University of Chicago, Chicago, Illinois 60637N. KrumnackBaylor University, Waco, Texas 76798M. KruseDuke University, Durham, North Carolina 27708V. KrutelyovUniversity of California, Santa Barbara, Santa Barbara, California 93106T. KuboUniversity of Tsukuba, Tsukuba, Ibaraki 305, JapanT. KuhrInstitut für Experimentelle Kernphysik, Universität Karlsruhe, 76128 Karlsruhe, GermanyN.P. KulkarniWayne State University, Detroit, Michigan 48201M. KurataUniversity of Tsukuba, Tsukuba, Ibaraki 305, JapanY. KusakabeWaseda University, Tokyo 169, JapanS. KwangEnrico Fermi Institute, University of Chicago, Chicago, Illinois 60637A.T. LaasanenPurdue University, West Lafayette, Indiana 47907S. LamiIstituto Nazionale di Fisica Nucleare Pisa, xUniversity of Pisa, yUniversity of Siena and zScuola Normale Superiore, I-56127 Pisa, ItalyS. LammelFermi National Accelerator Laboratory, Batavia, Illinois 60510M. LancasterUniversity College London, London WC1E 6BT, United KingdomR.L. LanderUniversity of California, Davis, Davis, California 95616K. LannonqThe Ohio State University, Columbus, Ohio 43210A. LathRutgers University, Piscataway, New Jersey 08855G. LatinoyIstituto Nazionale di Fisica Nucleare Pisa, xUniversity of Pisa, yUniversity of Siena and zScuola Normale Superiore, I-56127 Pisa, ItalyI. LazzizzerawIstituto Nazionale di Fisica Nucleare, Sezione di Padova-Trento, wUniversity of Padova, I-35131 Padova, ItalyT. LeCompteArgonne National Laboratory, Argonne, Illinois 60439E. LeeTexas A&M University, College Station, Texas 77843H.S. LeeEnrico Fermi Institute, University of Chicago, Chicago, Illinois 60637S.W. LeetTexas A&M University, College Station, Texas 77843S. LeoneIstituto Nazionale di Fisica Nucleare Pisa, xUniversity of Pisa, yUniversity of Siena and zScuola Normale Superiore, I-56127 Pisa, ItalyJ.D. LewisFermi National Accelerator Laboratory, Batavia, Illinois 60510C.-S. LinErnest Orlando Lawrence Berkeley National Laboratory, Berkeley, California 94720J. LinacreUniversity of Oxford, Oxford OX1 3RH, United KingdomM. LindgrenFermi National Accelerator Laboratory, Batavia, Illinois 60510E. LipelesUniversity of Pennsylvania, Philadelphia, Pennsylvania 19104A. ListerUniversity of California, Davis, Davis, California 95616D.O. LitvintsevFermi National Accelerator Laboratory, Batavia, Illinois 60510C. LiuUniversity of Pittsburgh, Pittsburgh, Pennsylvania 15260T. LiuFermi National Accelerator Laboratory, Batavia, Illinois 60510N.S. LockyerUniversity of Pennsylvania, Philadelphia, Pennsylvania 19104A. LoginovYale University, New Haven, Connecticut 06520M. LoretiwIstituto Nazionale di Fisica Nucleare, Sezione di Padova-Trento, wUniversity of Padova, I-35131 Padova, ItalyL. LovasComenius University, 842 48 Bratislava, Slovakia; Institute of Experimental Physics, 040 01 Kosice, SlovakiaD. LucchesiwIstituto Nazionale di Fisica Nucleare, Sezione di Padova-Trento, wUniversity of Padova, I-35131 Padova, ItalyC. LuciaaIstituto Nazionale di Fisica Nucleare, Sezione di Roma 1, aaSapienza Università di Roma, I-00185 Roma, ItalyJ. LueckInstitut für Experimentelle Kernphysik, Universität Karlsruhe, 76128 Karlsruhe, GermanyP. LujanErnest Orlando Lawrence Berkeley National Laboratory, Berkeley, California 94720P. LukensFermi National Accelerator Laboratory, Batavia, Illinois 60510G. LunguThe Rockefeller University, New York, New York 10021L. LyonsUniversity of Oxford, Oxford OX1 3RH, United KingdomJ. LysErnest Orlando Lawrence Berkeley National Laboratory, Berkeley, California 94720R. LysakComenius University, 842 48 Bratislava, Slovakia; Institute of Experimental Physics, 040 01 Kosice, SlovakiaD. MacQueenInstitute of Particle Physics: McGill University, Montréal, Québec, Canada H3A 2T8; Simon
Fraser University, Burnaby, British Columbia, Canada V5A 1S6; University of Toronto, Toronto, Ontario, Canada M5S 1A7; and TRIUMF, Vancouver, British Columbia, Canada V6T 2A3R. MadrakFermi National Accelerator Laboratory, Batavia, Illinois 60510K. MaeshimaFermi National Accelerator Laboratory, Batavia, Illinois 60510K. MakhoulMassachusetts Institute of Technology, Cambridge, Massachusetts 02139T. MakiDivision of High Energy Physics, Department of Physics, University of Helsinki and Helsinki Institute of Physics, FIN-00014, Helsinki, FinlandP. MaksimovicThe Johns Hopkins University, Baltimore, Maryland 21218S. MaldeUniversity of Oxford, Oxford OX1 3RH, United KingdomS. MalikUniversity College London, London WC1E 6BT, United KingdomG. MancaeUniversity of Liverpool, Liverpool L69 7ZE, United KingdomA. Manousakis-KatsikakisUniversity of Athens, 157 71 Athens, GreeceF. MargaroliPurdue University, West Lafayette, Indiana 47907C. MarinoInstitut für Experimentelle Kernphysik, Universität Karlsruhe, 76128 Karlsruhe, GermanyC.P. MarinoUniversity of Illinois, Urbana, Illinois 61801A. MartinYale University, New Haven, Connecticut 06520V. MartinlGlasgow University, Glasgow G12 8QQ, United KingdomM. MartínezInstitut de Fisica d’Altes Energies, Universitat Autonoma de Barcelona, E-08193, Bellaterra (Barcelona), SpainR. Martínez-BallarínCentro de Investigaciones Energeticas Medioambientales y Tecnologicas, E-28040 Madrid, SpainT. MaruyamaUniversity of Tsukuba, Tsukuba, Ibaraki 305, JapanP. MastrandreaIstituto Nazionale di Fisica Nucleare, Sezione di Roma 1, aaSapienza Università di Roma, I-00185 Roma, ItalyT. MasubuchiUniversity of Tsukuba, Tsukuba, Ibaraki 305, JapanM. MathisThe Johns Hopkins University, Baltimore, Maryland 21218M.E. MattsonWayne State University, Detroit, Michigan 48201P. MazzantiIstituto Nazionale di Fisica Nucleare Bologna, vUniversity of Bologna, I-40127 Bologna, ItalyK.S. McFarlandUniversity of Rochester, Rochester, New York 14627P. McIntyreTexas A&M University, College Station, Texas 77843R. McNultyjUniversity of Liverpool, Liverpool L69 7ZE, United KingdomA. MehtaUniversity of Liverpool, Liverpool L69 7ZE, United KingdomP. MehtalaDivision of High Energy Physics, Department of Physics, University of Helsinki and Helsinki Institute of Physics, FIN-00014, Helsinki, FinlandA. MenzioneIstituto Nazionale di Fisica Nucleare Pisa, xUniversity of Pisa, yUniversity of Siena and zScuola Normale Superiore, I-56127 Pisa, ItalyP. MerkelPurdue University, West Lafayette, Indiana 47907C. MesropianThe Rockefeller University, New York, New York 10021T. MiaoFermi National Accelerator Laboratory, Batavia, Illinois 60510N. MiladinovicBrandeis University, Waltham, Massachusetts 02254R. MillerMichigan State University, East Lansing, Michigan 48824C. MillsHarvard University, Cambridge, Massachusetts 02138M. MilnikInstitut für Experimentelle Kernphysik, Universität Karlsruhe, 76128 Karlsruhe, GermanyA. MitraInstitute of Physics, Academia Sinica, Taipei, Taiwan 11529, Republic of ChinaG. MitselmakherUniversity of Florida, Gainesville, Florida 32611H. MiyakeUniversity of Tsukuba, Tsukuba, Ibaraki 305, JapanN. MoggiIstituto Nazionale di Fisica Nucleare Bologna, vUniversity of Bologna, I-40127 Bologna, ItalyC.S. MoonCenter for High Energy Physics: Kyungpook National University, Daegu 702-701, Korea; Seoul National University, Seoul 151-742, Korea; Sungkyunkwan University, Suwon 440-746, Korea; Korea Institute of Science and Technology Information, Daejeon, 305-806, Korea; Chonnam National University, Gwangju, 500-757, KoreaR. MooreFermi National Accelerator Laboratory, Batavia, Illinois 60510M.J. MorelloxIstituto Nazionale di Fisica Nucleare Pisa, xUniversity of Pisa, yUniversity of Siena and zScuola Normale Superiore, I-56127 Pisa, ItalyJ. MorlokInstitut für Experimentelle Kernphysik, Universität Karlsruhe, 76128 Karlsruhe, GermanyP. Movilla FernandezFermi National Accelerator Laboratory, Batavia, Illinois 60510J. MülmenstädtErnest Orlando Lawrence Berkeley National Laboratory, Berkeley, California 94720A. MukherjeeFermi National Accelerator Laboratory, Batavia, Illinois 60510Th. MullerInstitut für Experimentelle Kernphysik, Universität Karlsruhe, 76128 Karlsruhe, GermanyR. MumfordThe Johns Hopkins University, Baltimore, Maryland 21218P. MuratFermi National Accelerator Laboratory, Batavia, Illinois 60510M. MussinivIstituto Nazionale di Fisica Nucleare Bologna, vUniversity of Bologna, I-40127 Bologna, ItalyJ. NachtmanFermi National Accelerator Laboratory, Batavia, Illinois 60510Y. NagaiUniversity of Tsukuba, Tsukuba, Ibaraki 305, JapanA. NaganoUniversity of Tsukuba, Tsukuba, Ibaraki 305, JapanJ. NaganomaUniversity of Tsukuba, Tsukuba, Ibaraki 305, JapanK. NakamuraUniversity of Tsukuba, Tsukuba, Ibaraki 305, JapanI. NakanoOkayama University, Okayama 700-8530, JapanA. NapierTufts University, Medford, Massachusetts 02155V. NeculaDuke University, Durham, North Carolina 27708J. NettUniversity of Wisconsin, Madison, Wisconsin 53706C. NeuvUniversity of Pennsylvania, Philadelphia, Pennsylvania 19104M.S. NeubauerUniversity of Illinois, Urbana, Illinois 61801S. NeubauerInstitut für Experimentelle Kernphysik, Universität Karlsruhe, 76128 Karlsruhe, GermanyJ. NielsengErnest Orlando Lawrence Berkeley National Laboratory, Berkeley, California 94720L. NodulmanArgonne National Laboratory, Argonne, Illinois 60439M. NormanUniversity of California, San Diego, La Jolla, California 92093O. NorniellaUniversity of Illinois, Urbana, Illinois 61801E. NurseUniversity College London, London WC1E 6BT, United KingdomL. OakesUniversity of Oxford, Oxford OX1 3RH, United KingdomS.H. OhDuke University, Durham, North Carolina 27708Y.D. OhCenter for High Energy Physics: Kyungpook National University, Daegu 702-701, Korea; Seoul National University, Seoul 151-742, Korea; Sungkyunkwan University, Suwon 440-746, Korea; Korea Institute of Science and Technology Information, Daejeon, 305-806, Korea; Chonnam National University, Gwangju, 500-757, KoreaI. OksuzianUniversity of Florida, Gainesville, Florida 32611T. OkusawaOsaka City University, Osaka 588, JapanR. OravaDivision of High Energy Physics, Department of Physics, University of Helsinki and Helsinki Institute of Physics, FIN-00014, Helsinki, FinlandS. Pagan GrisowIstituto Nazionale di Fisica Nucleare, Sezione di Padova-Trento, wUniversity of Padova, I-35131 Padova, ItalyE. PalenciaFermi National Accelerator Laboratory, Batavia, Illinois 60510V. PapadimitriouFermi National Accelerator Laboratory, Batavia, Illinois 60510A. PapaikonomouInstitut für Experimentelle Kernphysik, Universität Karlsruhe, 76128 Karlsruhe, GermanyA.A. ParamonovEnrico Fermi Institute, University of Chicago, Chicago, Illinois 60637B. ParksThe Ohio State University, Columbus, Ohio 43210S. PashapourInstitute of Particle Physics: McGill University, Montréal, Québec, Canada H3A 2T8; Simon Fraser University, Burnaby, British Columbia, Canada V5A 1S6; University of Toronto, Toronto, Ontario, Canada M5S 1A7; and TRIUMF, Vancouver, British Columbia, Canada V6T 2A3J. PatrickFermi National Accelerator Laboratory, Batavia, Illinois 60510G. PaulettabbIstituto Nazionale di Fisica Nucleare Trieste/Udine, bbUniversity of Trieste/Udine, ItalyM. PauliniCarnegie Mellon University, Pittsburgh, PA 15213C. PausMassachusetts Institute of Technology, Cambridge, Massachusetts 02139T. PeifferInstitut für Experimentelle Kernphysik, Universität Karlsruhe, 76128 Karlsruhe, GermanyD.E. PellettUniversity of California, Davis, Davis, California 95616A. PenzoIstituto Nazionale di Fisica Nucleare Trieste/Udine, bbUniversity of Trieste/Udine, ItalyT.J. PhillipsDuke University, Durham, North Carolina 27708G. PiacentinoIstituto Nazionale di Fisica Nucleare Pisa, xUniversity of Pisa, yUniversity of Siena and zScuola Normale Superiore, I-56127 Pisa, ItalyE. PianoriUniversity of Pennsylvania, Philadelphia, Pennsylvania 19104L. PineraUniversity of Florida, Gainesville, Florida 32611K. PittsUniversity of Illinois, Urbana, Illinois 61801C. PlagerUniversity of California, Los Angeles, Los Angeles, California 90024L. PondromUniversity of Wisconsin, Madison, Wisconsin 53706O. Poukhov111DeceasedJoint Institute for Nuclear Research, RU-141980 Dubna, RussiaN. PounderUniversity of Oxford, Oxford OX1 3RH, United KingdomF. PrakoshynJoint Institute for Nuclear Research, RU-141980 Dubna, RussiaA. PronkoFermi National Accelerator Laboratory, Batavia, Illinois 60510J. ProudfootArgonne National Laboratory, Argonne, Illinois 60439F. PtohosiFermi National Accelerator Laboratory, Batavia, Illinois 60510E. PueschelCarnegie Mellon University, Pittsburgh, PA 15213G. PunzixIstituto Nazionale di Fisica Nucleare Pisa, xUniversity of Pisa, yUniversity of Siena and zScuola Normale Superiore, I-56127 Pisa, ItalyJ. PursleyUniversity of Wisconsin, Madison, Wisconsin 53706J. RademackercUniversity of Oxford, Oxford OX1 3RH, United KingdomA. RahamanUniversity of Pittsburgh, Pittsburgh, Pennsylvania 15260V. RamakrishnanUniversity of Wisconsin, Madison, Wisconsin 53706N. RanjanPurdue University, West Lafayette, Indiana 47907I. RedondoCentro de Investigaciones Energeticas Medioambientales y Tecnologicas, E-28040 Madrid, SpainP. RentonUniversity of Oxford, Oxford OX1 3RH, United KingdomM. RenzInstitut für Experimentelle Kernphysik, Universität Karlsruhe, 76128 Karlsruhe, GermanyM. RescignoIstituto Nazionale di Fisica Nucleare, Sezione di Roma 1, aaSapienza Università di Roma, I-00185 Roma, ItalyS. RichterInstitut für Experimentelle Kernphysik, Universität Karlsruhe, 76128 Karlsruhe, GermanyF. RimondivIstituto Nazionale di Fisica Nucleare Bologna, vUniversity of Bologna, I-40127 Bologna, ItalyL. RistoriIstituto Nazionale di Fisica Nucleare Pisa, xUniversity of Pisa, yUniversity of Siena and zScuola Normale Superiore, I-56127 Pisa, ItalyA. RobsonGlasgow University, Glasgow G12 8QQ, United KingdomT. RodrigoInstituto de Fisica de Cantabria, CSIC-University of Cantabria, 39005 Santander, SpainT. RodriguezUniversity of Pennsylvania, Philadelphia, Pennsylvania 19104E. RogersUniversity of Illinois, Urbana, Illinois 61801S. RolliTufts University, Medford, Massachusetts 02155R. RoserFermi National Accelerator Laboratory, Batavia, Illinois 60510M. RossiIstituto Nazionale di Fisica Nucleare Trieste/Udine, bbUniversity of Trieste/Udine, ItalyR. RossinUniversity of California, Santa Barbara, Santa Barbara, California 93106P. RoyInstitute of Particle Physics: McGill University, Montréal, Québec, Canada H3A 2T8; Simon
Fraser University, Burnaby, British Columbia, Canada V5A 1S6; University of Toronto, Toronto, Ontario, Canada
M5S 1A7; and TRIUMF, Vancouver, British Columbia, Canada V6T 2A3A. RuizInstituto de Fisica de Cantabria, CSIC-University of Cantabria, 39005 Santander, SpainJ. RussCarnegie Mellon University, Pittsburgh, PA 15213V. RusuFermi National Accelerator Laboratory, Batavia, Illinois 60510A. SafonovTexas A&M University, College Station, Texas 77843W.K. SakumotoUniversity of Rochester, Rochester, New York 14627O. SaltóInstitut de Fisica d’Altes Energies, Universitat Autonoma de Barcelona, E-08193, Bellaterra (Barcelona), SpainL. SantibbIstituto Nazionale di Fisica Nucleare Trieste/Udine, bbUniversity of Trieste/Udine, ItalyS. SarkaraaIstituto Nazionale di Fisica Nucleare, Sezione di Roma 1, aaSapienza Università di Roma, I-00185 Roma, ItalyL. SartoriIstituto Nazionale di Fisica Nucleare Pisa, xUniversity of Pisa, yUniversity of Siena and zScuola Normale Superiore, I-56127 Pisa, ItalyK. SatoFermi National Accelerator Laboratory, Batavia, Illinois 60510A. Savoy-NavarroLPNHE, Universite Pierre et Marie Curie/IN2P3-CNRS, UMR7585, Paris, F-75252 FranceP. SchlabachFermi National Accelerator Laboratory, Batavia, Illinois 60510A. SchmidtInstitut für Experimentelle Kernphysik, Universität Karlsruhe, 76128 Karlsruhe, GermanyE.E. SchmidtFermi National Accelerator Laboratory, Batavia, Illinois 60510M.A. SchmidtEnrico Fermi Institute, University of Chicago, Chicago, Illinois 60637M.P. Schmidt††footnotemark: Yale University, New Haven, Connecticut 06520M. SchmittNorthwestern University, Evanston, Illinois 60208T. SchwarzUniversity of California, Davis, Davis, California 95616L. ScodellaroInstituto de Fisica de Cantabria, CSIC-University of Cantabria, 39005 Santander, SpainA. ScribanoyIstituto Nazionale di Fisica Nucleare Pisa, xUniversity of Pisa, yUniversity of Siena and zScuola Normale Superiore, I-56127 Pisa, ItalyF. ScuriIstituto Nazionale di Fisica Nucleare Pisa, xUniversity of Pisa, yUniversity of Siena and zScuola Normale Superiore, I-56127 Pisa, ItalyA. SedovPurdue University, West Lafayette, Indiana 47907S. SeidelUniversity of New Mexico, Albuquerque, New Mexico 87131Y. SeiyaOsaka City University, Osaka 588, JapanA. SemenovJoint Institute for Nuclear Research, RU-141980 Dubna, RussiaL. Sexton-KennedyFermi National Accelerator Laboratory, Batavia, Illinois 60510F. SforzaIstituto Nazionale di Fisica Nucleare Pisa, xUniversity of Pisa, yUniversity of Siena and zScuola Normale Superiore, I-56127 Pisa, ItalyA. SfyrlaUniversity of Illinois, Urbana, Illinois 61801S.Z. ShalhoutWayne State University, Detroit, Michigan 48201T. ShearsUniversity of Liverpool, Liverpool L69 7ZE, United KingdomP.F. ShepardUniversity of Pittsburgh, Pittsburgh, Pennsylvania 15260M. ShimojimapUniversity of Tsukuba, Tsukuba, Ibaraki 305, JapanS. ShiraishiEnrico Fermi Institute, University of Chicago, Chicago, Illinois 60637M. ShochetEnrico Fermi Institute, University of Chicago, Chicago, Illinois 60637Y. ShonUniversity of Wisconsin, Madison, Wisconsin 53706I. ShreyberInstitution for Theoretical and Experimental Physics, ITEP, Moscow 117259, RussiaA. SidotiIstituto Nazionale di Fisica Nucleare Pisa, xUniversity of Pisa, yUniversity of Siena and zScuola Normale Superiore, I-56127 Pisa, ItalyP. SinervoInstitute of Particle Physics: McGill University, Montréal, Québec, Canada H3A 2T8; Simon Fraser University, Burnaby, British Columbia, Canada V5A 1S6; University of Toronto, Toronto, Ontario, Canada M5S 1A7; and TRIUMF, Vancouver, British Columbia, Canada V6T 2A3A. SisakyanJoint Institute for Nuclear Research, RU-141980 Dubna, RussiaA.J. SlaughterFermi National Accelerator Laboratory, Batavia, Illinois 60510J. SlaunwhiteThe Ohio State University, Columbus, Ohio 43210K. SliwaTufts University, Medford, Massachusetts 02155J.R. SmithUniversity of California, Davis, Davis, California 95616F.D. SniderFermi National Accelerator Laboratory, Batavia, Illinois 60510R. SnihurInstitute of Particle Physics: McGill University, Montréal, Québec, Canada H3A 2T8; Simon
Fraser University, Burnaby, British Columbia, Canada V5A 1S6; University of Toronto, Toronto, Ontario, Canada
M5S 1A7; and TRIUMF, Vancouver, British Columbia, Canada V6T 2A3A. SohaUniversity of California, Davis, Davis, California 95616S. SomalwarRutgers University, Piscataway, New Jersey 08855V. SorinMichigan State University, East Lansing, Michigan 48824J. SpaldingFermi National Accelerator Laboratory, Batavia, Illinois 60510T. SpreitzerInstitute of Particle Physics: McGill University, Montréal, Québec, Canada H3A 2T8; Simon Fraser University, Burnaby, British Columbia, Canada V5A 1S6; University of Toronto, Toronto, Ontario, Canada M5S 1A7; and TRIUMF, Vancouver, British Columbia, Canada V6T 2A3P. SquillaciotiyIstituto Nazionale di Fisica Nucleare Pisa, xUniversity of Pisa, yUniversity of Siena and zScuola Normale Superiore, I-56127 Pisa, ItalyM. StanitzkiYale University, New Haven, Connecticut 06520R. St. DenisGlasgow University, Glasgow G12 8QQ, United KingdomB. StelzerInstitute of Particle Physics: McGill University, Montréal, Québec, Canada H3A 2T8; Simon Fraser University, Burnaby, British Columbia, Canada V5A 1S6; University of Toronto, Toronto, Ontario, Canada M5S 1A7; and TRIUMF, Vancouver, British Columbia, Canada V6T 2A3O. Stelzer-ChiltonInstitute of Particle Physics: McGill University, Montréal, Québec, Canada H3A 2T8; Simon
Fraser University, Burnaby, British Columbia, Canada V5A 1S6; University of Toronto, Toronto, Ontario, Canada M5S 1A7;
and TRIUMF, Vancouver, British Columbia, Canada V6T 2A3D. StentzNorthwestern University, Evanston, Illinois 60208J. StrologasUniversity of New Mexico, Albuquerque, New Mexico 87131G.L. StryckerUniversity of Michigan, Ann Arbor, Michigan 48109D. StuartUniversity of California, Santa Barbara, Santa Barbara, California 93106J.S. SuhCenter for High Energy Physics: Kyungpook National University, Daegu 702-701, Korea; Seoul National University, Seoul 151-742, Korea; Sungkyunkwan University, Suwon 440-746, Korea; Korea Institute of Science and Technology Information, Daejeon, 305-806, Korea; Chonnam National University, Gwangju, 500-757, KoreaA. SukhanovUniversity of Florida, Gainesville, Florida 32611I. SuslovJoint Institute for Nuclear Research, RU-141980 Dubna, RussiaT. SuzukiUniversity of Tsukuba, Tsukuba, Ibaraki 305, JapanA. TaffardfUniversity of Illinois, Urbana, Illinois 61801R. TakashimaOkayama University, Okayama 700-8530, JapanY. TakeuchiUniversity of Tsukuba, Tsukuba, Ibaraki 305, JapanR. TanakaOkayama University, Okayama 700-8530, JapanM. TecchioUniversity of Michigan, Ann Arbor, Michigan 48109P.K. TengInstitute of Physics, Academia Sinica, Taipei, Taiwan 11529, Republic of ChinaK. TerashiThe Rockefeller University, New York, New York 10021R.J. TesarekFermi National Accelerator Laboratory, Batavia, Illinois 60510J. ThomhFermi National Accelerator Laboratory, Batavia, Illinois 60510A.S. ThompsonGlasgow University, Glasgow G12 8QQ, United KingdomG.A. ThompsonUniversity of Illinois, Urbana, Illinois 61801E. ThomsonUniversity of Pennsylvania, Philadelphia, Pennsylvania 19104P. TiptonYale University, New Haven, Connecticut 06520P. Ttito-GuzmánCentro de Investigaciones Energeticas Medioambientales y Tecnologicas, E-28040 Madrid, SpainS. TkaczykFermi National Accelerator Laboratory, Batavia, Illinois 60510D. TobackTexas A&M University, College Station, Texas 77843S. TokarComenius University, 842 48 Bratislava, Slovakia; Institute of Experimental Physics, 040 01 Kosice, SlovakiaK. TollefsonMichigan State University, East Lansing, Michigan 48824T. TomuraUniversity of Tsukuba, Tsukuba, Ibaraki 305, JapanD. TonelliFermi National Accelerator Laboratory, Batavia, Illinois 60510S. TorreLaboratori Nazionali di Frascati, Istituto Nazionale di Fisica Nucleare, I-00044 Frascati, ItalyD. TorrettaFermi National Accelerator Laboratory, Batavia, Illinois 60510P. TotarobbIstituto Nazionale di Fisica Nucleare Trieste/Udine, bbUniversity of Trieste/Udine, ItalyS. TourneurLPNHE, Universite Pierre et Marie Curie/IN2P3-CNRS, UMR7585, Paris, F-75252 FranceM. TrovatoIstituto Nazionale di Fisica Nucleare Pisa, xUniversity of Pisa, yUniversity of Siena and zScuola Normale Superiore, I-56127 Pisa, ItalyS.-Y. TsaiInstitute of Physics, Academia Sinica, Taipei, Taiwan 11529, Republic of ChinaY. TuUniversity of Pennsylvania, Philadelphia, Pennsylvania 19104N. TuriniyIstituto Nazionale di Fisica Nucleare Pisa, xUniversity of Pisa, yUniversity of Siena and zScuola Normale Superiore, I-56127 Pisa, ItalyF. UkegawaUniversity of Tsukuba, Tsukuba, Ibaraki 305, JapanS. VallecorsaUniversity of Geneva, CH-1211 Geneva 4, SwitzerlandN. van RemortelbDivision of High Energy Physics, Department of Physics, University of Helsinki and Helsinki Institute of Physics, FIN-00014, Helsinki, FinlandA. VarganovUniversity of Michigan, Ann Arbor, Michigan 48109E. VatagazIstituto Nazionale di Fisica Nucleare Pisa, xUniversity of Pisa, yUniversity of Siena
and zScuola Normale Superiore, I-56127 Pisa, ItalyF. VázquezmUniversity of Florida, Gainesville, Florida 32611G. VelevFermi National Accelerator Laboratory, Batavia, Illinois 60510C. VellidisUniversity of Athens, 157 71 Athens, GreeceV. VeszpremiPurdue University, West Lafayette, Indiana 47907M. VidalCentro de Investigaciones Energeticas Medioambientales y Tecnologicas, E-28040 Madrid, SpainR. VidalFermi National Accelerator Laboratory, Batavia, Illinois 60510I. VilaInstituto de Fisica de Cantabria, CSIC-University of Cantabria, 39005 Santander, SpainR. VilarInstituto de Fisica de Cantabria, CSIC-University of Cantabria, 39005 Santander, SpainT. VineUniversity College London, London WC1E 6BT, United KingdomM. VogelUniversity of New Mexico, Albuquerque, New Mexico 87131I. VolobouevtErnest Orlando Lawrence Berkeley National Laboratory, Berkeley, California 94720G. VolpixIstituto Nazionale di Fisica Nucleare Pisa, xUniversity of Pisa, yUniversity of Siena and zScuola Normale Superiore, I-56127 Pisa, ItalyP. WagnerUniversity of Pennsylvania, Philadelphia, Pennsylvania 19104R.G. WagnerArgonne National Laboratory, Argonne, Illinois 60439R.L. WagnerFermi National Accelerator Laboratory, Batavia, Illinois 60510W. WagnerInstitut für Experimentelle Kernphysik, Universität Karlsruhe, 76128 Karlsruhe, GermanyJ. Wagner-KuhrInstitut für Experimentelle Kernphysik, Universität Karlsruhe, 76128 Karlsruhe, GermanyT. WakisakaOsaka City University, Osaka 588, JapanR. WallnyUniversity of California, Los Angeles, Los Angeles, California 90024S.M. WangInstitute of Physics, Academia Sinica, Taipei, Taiwan 11529, Republic of ChinaA. WarburtonInstitute of Particle Physics: McGill University, Montréal, Québec, Canada H3A 2T8; Simon
Fraser University, Burnaby, British Columbia, Canada V5A 1S6; University of Toronto, Toronto, Ontario, Canada M5S 1A7; and TRIUMF, Vancouver, British Columbia, Canada V6T 2A3D. WatersUniversity College London, London WC1E 6BT, United KingdomM. WeinbergerTexas A&M University, College Station, Texas 77843J. WeineltInstitut für Experimentelle Kernphysik, Universität Karlsruhe, 76128 Karlsruhe, GermanyW.C. Wester IIIFermi National Accelerator Laboratory, Batavia, Illinois 60510B. WhitehouseTufts University, Medford, Massachusetts 02155D. WhitesonfUniversity of Pennsylvania, Philadelphia, Pennsylvania 19104A.B. WicklundArgonne National Laboratory, Argonne, Illinois 60439E. WicklundFermi National Accelerator Laboratory, Batavia, Illinois 60510S. WilburEnrico Fermi Institute, University of Chicago, Chicago, Illinois 60637G. WilliamsInstitute of Particle Physics: McGill University, Montréal, Québec, Canada H3A 2T8; Simon
Fraser University, Burnaby, British Columbia, Canada V5A 1S6; University of Toronto, Toronto, Ontario, Canada
M5S 1A7; and TRIUMF, Vancouver, British Columbia, Canada V6T 2A3H.H. WilliamsUniversity of Pennsylvania, Philadelphia, Pennsylvania 19104P. WilsonFermi National Accelerator Laboratory, Batavia, Illinois 60510B.L. WinerThe Ohio State University, Columbus, Ohio 43210P. WittichhFermi National Accelerator Laboratory, Batavia, Illinois 60510S. WolbersFermi National Accelerator Laboratory, Batavia, Illinois 60510C. WolfeEnrico Fermi Institute, University of Chicago, Chicago, Illinois 60637T. WrightUniversity of Michigan, Ann Arbor, Michigan 48109X. WuUniversity of Geneva, CH-1211 Geneva 4, SwitzerlandF. WürthweinUniversity of California, San Diego, La Jolla, California 92093S.M. WynneUniversity of Liverpool, Liverpool L69 7ZE, United KingdomS. XieMassachusetts Institute of Technology, Cambridge, Massachusetts 02139A. YagilUniversity of California, San Diego, La Jolla, California 92093K. YamamotoOsaka City University, Osaka 588, JapanJ. YamaokaRutgers University, Piscataway, New Jersey 08855U.K. YangoEnrico Fermi Institute, University of Chicago, Chicago, Illinois 60637Y.C. YangCenter for High Energy Physics: Kyungpook National University, Daegu 702-701, Korea; Seoul National University, Seoul 151-742, Korea; Sungkyunkwan University, Suwon 440-746, Korea; Korea Institute of Science and Technology Information, Daejeon, 305-806, Korea; Chonnam National University, Gwangju, 500-757, KoreaW.M. YaoErnest Orlando Lawrence Berkeley National Laboratory, Berkeley, California 94720G.P. YehFermi National Accelerator Laboratory, Batavia, Illinois 60510J. YohFermi National Accelerator Laboratory, Batavia, Illinois 60510K. YoritaEnrico Fermi Institute, University of Chicago, Chicago, Illinois 60637T. YoshidaOsaka City University, Osaka 588, JapanG.B. YuUniversity of Rochester, Rochester, New York 14627I. YuCenter for High Energy Physics: Kyungpook National University, Daegu 702-701, Korea; Seoul National University, Seoul 151-742, Korea; Sungkyunkwan University, Suwon 440-746, Korea; Korea Institute of Science and Technology Information, Daejeon, 305-806, Korea; Chonnam National University, Gwangju, 500-757, KoreaS.S. YuFermi National Accelerator Laboratory, Batavia, Illinois 60510J.C. YunFermi National Accelerator Laboratory, Batavia, Illinois 60510L. ZanelloaaIstituto Nazionale di Fisica Nucleare, Sezione di Roma 1, aaSapienza Università di Roma, I-00185 Roma, ItalyA. ZanettiIstituto Nazionale di Fisica Nucleare Trieste/Udine, bbUniversity of Trieste/Udine, ItalyX. ZhangUniversity of Illinois, Urbana, Illinois 61801Y. ZhengdUniversity of California, Los Angeles, Los Angeles, California 90024S. ZucchellivIstituto Nazionale di Fisica Nucleare Bologna, vUniversity of Bologna, I-40127 Bologna, Italy
Abstract
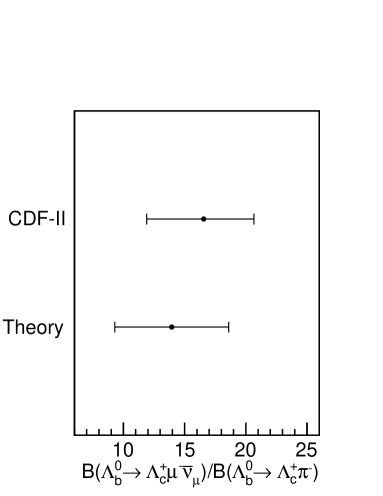
This article presents the first measurement of the ratio of branching
fractions .
Measurements in two control samples using the same technique,
and , are also
reported.
The analysis uses data from an integrated luminosity of approximately
172 of collisions at TeV, collected
with the CDF II detector at the Fermilab Tevatron.
The relative branching fractions are measured to be:
The uncertainties are from statistics , internal
systematics , world averages of measurements published
by the Particle Data Group or subsidiary measurements in this analysis
, and unmeasured branching
fractions estimated from theory , respectively.
This article also presents measurements of the branching fractions of
four new semileptonic decays:
,
,
, and
,
relative to the branching fraction of the decay. Finally, the transverse-momentum distribution of baryons produced in
collisions is measured and found to be significantly different
from that of mesons,
which results in a modification in the production cross-section ratio
with respect to the CDF I measurement.
Amplitudes for the weak decays of hadrons are described by the
product of Cabibbo-Kobayashi-Maskawa (CKM) matrix
elements Cabibbo:1963yz; Kobayashi:1973fv and dynamical factors. The
CKM matrix elements represent
the coupling strength of the weak decays and are fundamental
parameters of the standard model of particle physics. In order to extract
values of the CKM elements, knowledge of the dynamical factors is
needed either from experiment or theory. Calculation of the
dynamical factors, in the case of -hadron decays, is aided by
heavy quark effective theory (HQET) Manohar:2000dt; Godfrey:1985xj; Isgur:1988gb.
HQET is an approximation relying on the large mass of the quark
(), as compared with the Quantum
Chromodynamics (QCD) energy scale ,
to imply a spin-independent interaction between the quark and the
light degrees of freedom.
In baryon spectroscopy, the light degrees of freedom
are in a relative spin-0 state for all -type baryons;
there is no spin-related
interaction between the quark and the light degrees of freedom.
Therefore, the subleading order corrections to the heavy
quark limit are simpler than those mesons which contain a quark ( mesons) Georgi:1990ei.
Measurements of -baryon branching fractions may be compared with predictions
by HQET and test the calculation of dynamical factors to subleading order.
However, in contrast to the mesons, little is known about the baryon.
At the time of writing this article, only five decay modes of the have
been observed, with large uncertainties on their branching fraction
measurements pdg. On the theoretical side,
combining measurements of the CKM matrix element,
, and the world average of the lifetime theory; pdg,
the branching fraction predicted by HQET
for is % by Huang et al.Huang:2005me, and
that for is % by Leibovich et al.Leibovich:2003tw.
An independent prediction of by Cheng using the
non-relativistic quark model yields % Cheng:1996cs.
Presented here is the first measurement of the ratio of the branching
fractions, . This
measurement is based on data from an integrated luminosity of approximately
172 of collisions at
TeV, collected with the CDF II detector at Fermilab.
Taking advantage of the relatively long lifetime of hadrons
, all -hadron decays described in
this article are reconstructed from data satisfying an online event selection
(trigger) which requires two charged tracks forming a vertex displaced from
the location of collisions (two-track trigger). The is
reconstructed using the three-body decay ,
therefore both the and decays result in four charged particles
which are observable in the detector and have a similar topology (Fig. 1).
Since both decays have a similar topology and satisfy the same trigger,
most systematic uncertainties from the detector, trigger, and reconstruction
efficiencies cancel in the measurement of the ratio of branching fractions.
Throughout this article, the inclusion of charge conjugate decays is
implied.
The ratio of the branching fraction of the exclusive semileptonic decay
relative to that of the hadronic decay, , is extracted from
the ratio of signal yields divided by the ratio of
acceptance times efficiency :
(1)
The analysis procedure can be summarized in four steps.
First, the hadronic () and inclusive semileptonic ()
candidates are reconstructed. Second, the yields, and , are
determined by fitting the mass distributions.
Third, the contribution of backgrounds which produce a in the
final state is either measured or estimated and combined into .
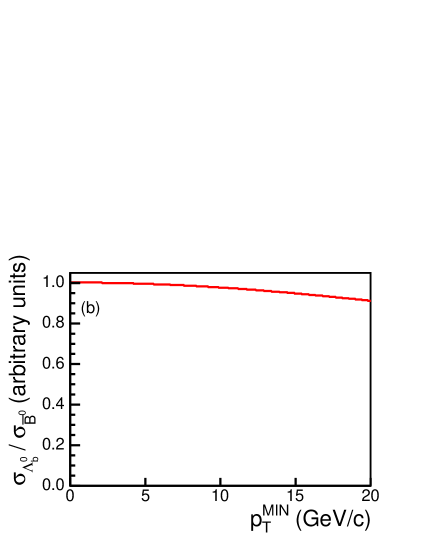
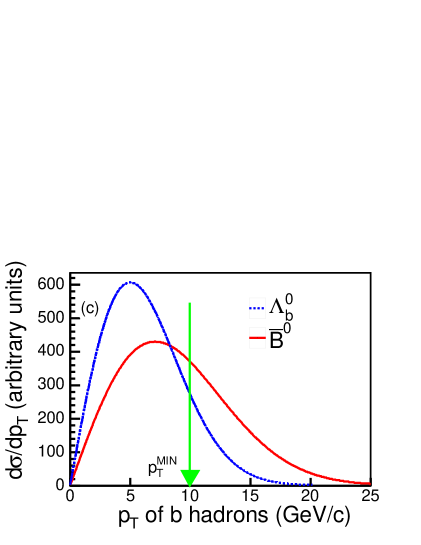
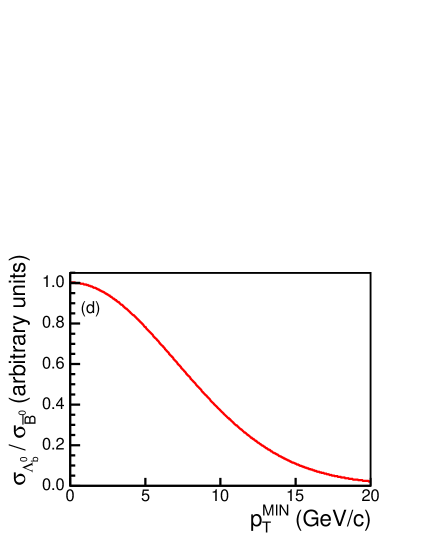
The estimate of requires a modification of the
production cross-section ratio, , with respect to the CDF I
measurement Affolder:1999iq. The dominant backgrounds which contribute
to , , , , and
, have also been reconstructed in the data for the first
time. Measurements of their branching fractions relative to the branching
fraction of the decay will be used in the estimate of .
Fourth, the ratio of the products of detector acceptance and reconstruction
efficiency, , is estimated from simulation.
The analysis method described above is tested by performing the
same measurements in decays which have a similar event topology.
Specifically, the following ratios of branching fractions are measured:
where , and
where .
The results of the measurements are compared with previous results
from the factories pdg to check the techniques used in this
analysis.
This article is structured as follows.
Section II describes the relevant parts of
the CDF II detector and trigger. Section III details the
event selections for the and samples.
Section IV describes the simulations used in this analysis.
Section V gives an account of the determination of the yields
and . In Section VI, is estimated.
Section VII includes measurements and estimates of the
branching fractions of other semileptonic decays which may contribute
to , and an estimate of
derived from a modification of the CDF I measurement of .
Section VIII summarizes the systematic uncertainties.
Section IX shows the measurements with the control samples
using the same analysis technique.
Section X compares the results of the and relative branching fractions with the predictions from HQET and the world
averages, respectively.
Finally, Section XI gives the conclusion.
Unless stated otherwise, branching fractions, fragmentation fractions, and
lifetimes are obtained from the Particle Data Group world averages pdg.
The symbols “” and “” are used to generically denote
hadrons containing charm and bottom quarks, “ hadrons”
and “ hadrons”, respectively. The symbol “MC”, which stands for
“Monte Carlo”, is used to generically denote simulation.
II The CDF II Detector and Trigger
The CDF II detector is a cylindrically symmetric apparatus described
in detail elsewhere CDF. Only the parts of the detector relevant for
this analysis are summarized here. The crucial features of the detector for
this measurement are the tracking and muon systems. The tracking system, which
enables reconstruction of the trajectories of charged particles, is contained
in a superconducting solenoid which generates a 1.4 Tesla magnetic field in
the direction coor.
The 96-cm long silicon vertex detector (SVX II) SVXII
consists of six equal subsections in and five concentric layers of
double-sided silicon sensors from
cm to cm.
The 310-cm long central outer tracker (COT) COT, an open-cell wire
drift chamber, consists of 96 sense wire layers from cm
to cm which are grouped into alternating axial and
stereo superlayers. The SVX II and COT provide both - and
position measurements in the pseudorapidity region of
and eta, respectively. The 452-cm long central
muon detector
(CMU) CMU, a set of drift chambers mounted outside of the central hadron
calorimeter at cm, contains 4 sense wire layers which allow the
formation of short track segments (stubs) and identify the muon candidates in
the region of .
The data for this analysis are collected with a three-level, two-track trigger
which selects events with a displaced vertex. Consequently, data
satisfying this trigger are rich in heavy flavor with a low background from
the combination of random tracks (combinatorial background).
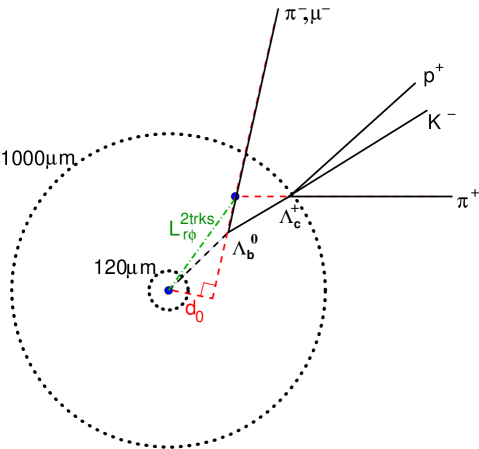
A schematic diagram of the event topology and trigger requirements is shown
in Fig. 1.
The strategy of the two-track trigger is as follows: at the first trigger
level, the
extremely fast tracker (XFT) Thomson:2002xp finds two oppositely-charged
tracks reconstructed in the COT, with a minimum transverse momentum ()
of 2.04 for each track. The scalar sum of the from the two tracks is required to exceed 5.5 and the azimuthal angle
between the two tracks to be less than .
At the second trigger level, the silicon vertex trigger (SVT) Ashmanskas:2003gf attaches hits measured with SVX II to the tracks found by XFT.
The SVT reapplies the requirements made at level 1 and further requires
that each track has a transverse impact parameter ,
measured at the point of closest approach (POCA) with respect to the beam
line svtbeamline, in the range 120 m–1000 m.
In addition, between the two trigger tracks is required to be in
the range 2∘ – 90∘. The intersection of
the two tracks forms a displaced vertex. Finally, the quantity,
, defined
as the projection of the vector from the primary vertex to the displaced vertex
onto the vector of the total momentum of the two tracks
in the - plane, must be larger than 200 m. The level 1 and 2
triggers are implemented in hardware, while at the third level, a cluster of
computers uses all detector information to perform a full reconstruction of
the event L3. In addition to reinforcing the same requirements as
applied at level 2, level 3 requires the difference in between the two
tracks at the POCA to be less than 5 cm.
The measurements presented in this article are based on an integrated
luminosity of pb-1 collected between February 2002 and
September 2003, comprising million two-track trigger events.
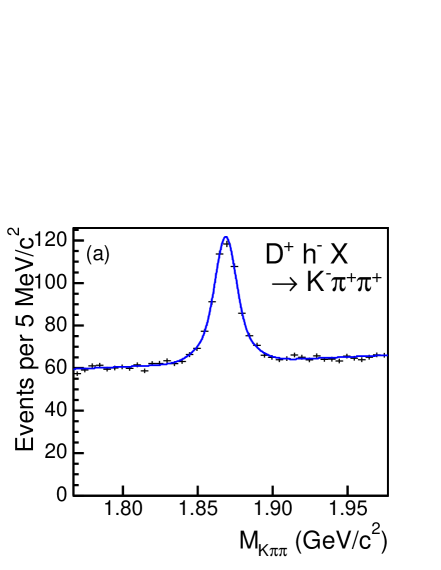
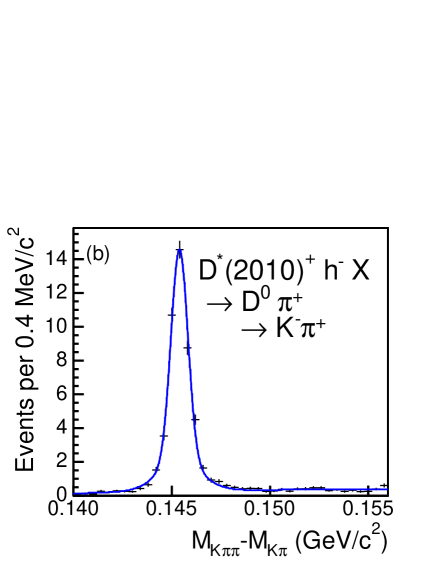
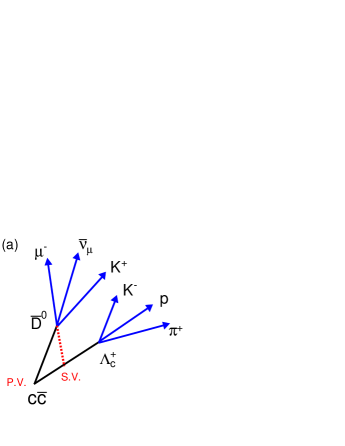
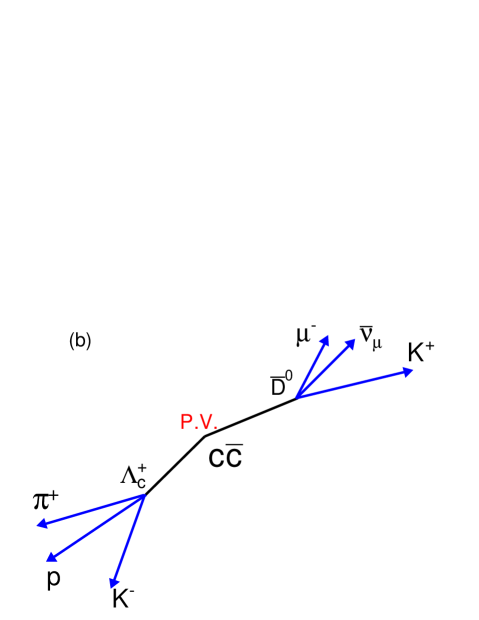
Figure 1:
An - view of a decay with a
two-prong decay vertex
and a three-prong decay vertex. In this case, the of each pion
(the pion and the muon) and the of the
two-pion vertex (pion-muon vertex) satisfy the trigger requirements.
III Event Reconstruction
The final states and , where , are reconstructed in the data collected with the two-track trigger.
The selection criteria for the hadronic and the inclusive semileptonic decay
modes are kept as similar as possible, which reduces systematic uncertainties
on the relative branching fractions.
Both signal decays have a four-track topology. Therefore, events are
selected which contain a minimum of four tracks, each with a minimum of
0.5 , less than 5000 m (measured with the SVX II), a minimum
of 20 hits each in the COT axial and stereo layers axialstereo, and a
minimum of three axial hits in the SVX II. Each track is also required to be in
the fiducial region of the COT and to traverse all 96 wire layers. Making
these requirements on each track ensures good quality of the track
reconstruction and good momentum resolution. In addition, the maximum
requirement on suppresses background from daughters of and
, and from particles produced by inelastic collisions of beam
products with the detector material.
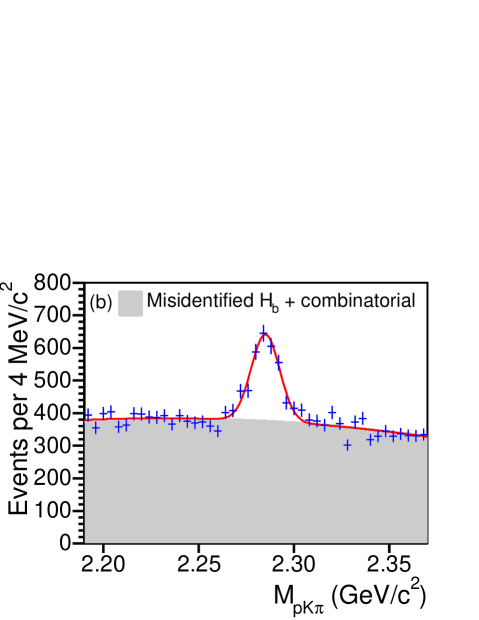
The reconstruction begins by identifying the candidate. Only combinations
of three tracks which satisfy the requirements described above are
considered. Every combination must have two positively charged tracks and one
negatively charged track. At least one of the three tracks must match a
displaced track found by the SVT (SVT track SVTtrk).
The proton mass is assigned to the positively charged track of higher ,
the pion mass to the track of lower , and the kaon mass to
the negatively charged track. Assuming the proton track to be the higher track reduces the combinatorial background by while keeping
of the signal.
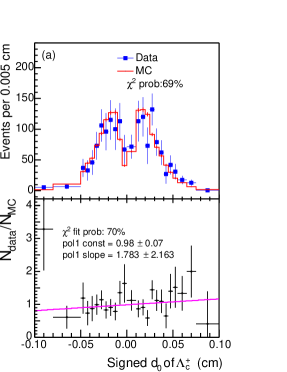
A three-track kinematic fit determines the decay vertex by varying the
track parameters of the daughter particles simultaneously, within their
uncertainties, so that the between the adjusted and the original track
parameters is minimized. Only three-track candidates for which the fit
converges and the invariant mass () is in the range
2.18 – 2.38 are considered further.
Next, the selected candidate is combined with an additional
negatively charged track to form a candidate. This fourth track must be
matched to an SVT track. The combination is considered a semileptonic
candidate and a muon mass is assumed for this track if the following two
requirements are satisfied. First, a CMU muon stub must be present within 30 cm
of the extrapolated track at the CMU radius ( cm) in the - view.
Second, the matching between the track and the stub positions cmuchi2 is less than 9. Otherwise, the combination is a hadronic candidate
and a pion mass is assumed. Both the muon and the pion tracks from the decay must extrapolate to the fiducial region of the CMU.
Making the same fiducial requirement for the hadronic and semileptonic modes
ensures that the tracking efficiency of both modes cancel in the ratio.
Once all four -candidate tracks are found, the two tracks which have been
matched to SVT tracks (one track from the candidate, the other is
the fourth track) must pass the two-track trigger requirements as described in
Section II.
Then, a four-track kinematic fit is performed. This fit includes
two constraints. First, the daughter tracks of the must originate from a
common, tertiary vertex. Second, the trajectory of the candidate must
intersect with that of the remaining -candidate track, in three dimensions;
this intersection is the decay vertex of the candidate (defined as the
secondary vertex). The secondary and tertiary vertices are determined
in the four-track kinematic fit simultaneously. These constraints improve the
precision of the decay vertex determination and the invariant mass of the
candidate is recalculated. After the kinematic fit, the values of
must be in the range: 2.269 – 2.302 (2 around
the mean) for the hadronic candidates and 2.18 – 2.38 for the
inclusive semileptonic candidates (see Fig. 2). The wider mass window for the semileptonic candidates allows for the spectrum
to be fit to extract the yield .
Also for the semileptonic decays, the four-track invariant mass
must be in the range of 3.7 – 5.64 , where the minimum
requirement on reduces the background from other -hadron and
-hadron decays. See Section VI for more details.
In order to reduce the combinatorial backgrounds further, the selection
criteria on the following variables are optimized: of the proton track,
of the fourth -candidate track [],
of , of the four-track system,
of the and the four-track kinematic fits,
proper decay length of the candidate, and (pseudo) proper decay length of the candidate. The is the - plane
contribution to the returned by the kinematic fit. The
is defined as:
(2)
where
is the projection of the vector from the secondary to the tertiary
vertex onto the momentum vector of in the - plane, and is
the world average of the mass pdg. The has a similar
definition:
(3)
where is the projection of the vector from the primary to the
secondary vertex onto the total momentum vector of the four tracks in the
- plane, is the transverse component
of the total momentum of the four tracks, and is the world average of
the mass pdg. Here, the primary vertex is estimated from the
intersection of the beam line and the trajectory of the candidate.
The optimization procedure maximizes the signal significance of the hadronic
decays, , where is the number of events in
simulation multiplied by a data-to-MC scaling factor and is the number of
background events estimated from the candidates in the data
sideband. The data-to-MC scaling factor for is obtained by comparing
the number of signal events in data and simulation with relaxed
requirements.
The background is estimated by fitting the mass sideband region above the
signal peak with an exponential function and then extrapolating from the
sideband region to the 3 signal region around the peak. The optimized
selection criteria are listed in Table 1.
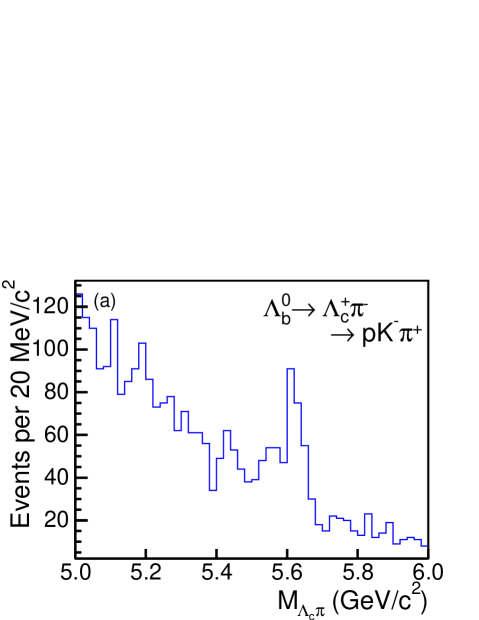
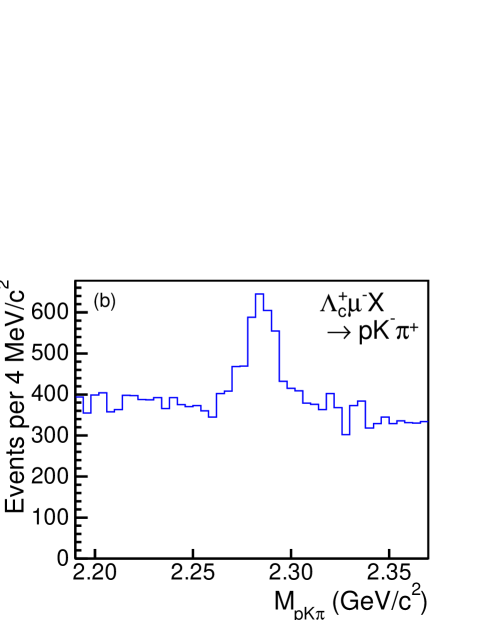
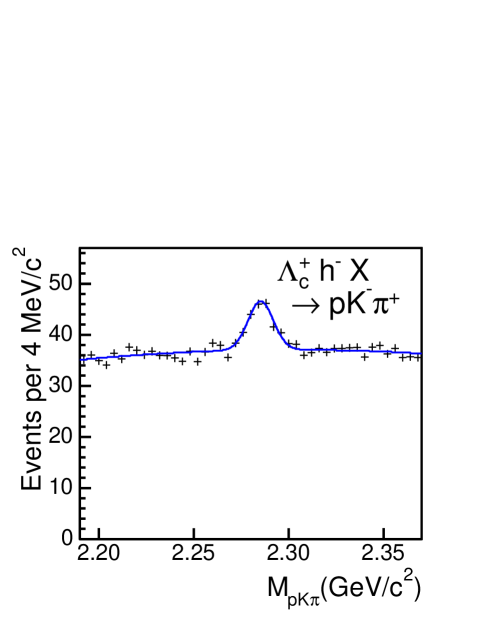
Figure 2(a) shows the reconstructed
spectrum from the hadronic data and Fig. 2(b) shows the
reconstructed spectrum from the inclusive semileptonic data, both
after applying the optimized selections. The most significant peaks in
Fig. 2 represent the signals for each decay mode.
In order to obtain the correct signal yields, a good modeling of the mass
spectra, which includes a description of signal and background, is needed.
The mass spectrum shapes of backgrounds from partially-reconstructed or
misidentified -hadron decays are determined by fitting the mass
distributions from simulation. The next section describes details
of the simulations used in this analysis.
Table 1: Optimized requirements for reconstructing the
and decays.
2
2
5
6
14
15
m
250 m
Figure 2: The reconstructed invariant mass spectra in data after applying
all selection criteria: (a) the spectrum of the hadronic candidates; (b) the spectrum of the inclusive
semileptonic candidates.
IV Simulation
In order to determine the mass spectrum shapes close to the signal peaks in
Fig. 2 and to estimate the acceptance and efficiency of signal
and background, both generator-level and full simulations are used. The
generator-level simulation includes only the production and decay of
hadrons, and the analysis requirements are applied to quantities immediately
after generation. The full simulation includes simulation of the
CDF II detector and trigger, and track reconstruction.
It was found that the efficiency ratios, , from a
generator-level simulation and from a full simulation differ by only
. The generator-level simulation is used to estimate the
quantities which are found to be small or already have large uncertainties from
other sources whysmall: the size of the background contribution where
the and the originate from two different heavy-flavor hadrons
produced by the fragmentation of or pairs
(termed / background), part of the systematic uncertainties (the semileptonic decay model and lifetime of ,
and polarizations, and Dalitz structure), and
modification of the CDF I result. Therefore, this 3
difference has a negligible effect on the final measurement.
The following subsections describe the key components of the simulations used
in this analysis.
IV.1 Production and decay of hadrons
Two different programs are used to simulate -hadron production: pythia version 6.2 pythia, which simulates all of the strong interaction
processes which are involved in -hadron production, and bgeneratorbgen, which
generates a single hadron in the event.
Since pythia simulates all of the products of the collision, it
is computationally intensive to produce a given final state. Therefore,
pythia is used to estimate only the / backgrounds in
the inclusive semileptonic data (Appendix C).
The pythia generator simulates physics processes using leading-order matrix
elements, supplemented by initial and final state radiation. The program also
includes hadronization of the quarks and gluons in the final state and the
beam remnants left when a parton undergoes high-momentum scattering.
The bgenerator program is very efficient at producing a large sample of a
specific -hadron under well-defined kinematic conditions.
It is used to determine the acceptance and efficiency for signal and
other backgrounds and to model the mass spectra.
In the bgenerator program, a single hadron is generated using the measured
spectra of hadrons as inputs. The and spectra are
derived from the fully-reconstructed and decays in the two-track trigger data, after correcting for acceptance and
efficiency.
After the event generation, the decays of the and hadrons and their
daughters are simulated using the evtgen package evtgen. For
all other particles in the event, this is done by the pythia program.
The evtgen program uses the dynamics from a full matrix-element calculation
and is tuned to
measurements, mainly results from experiments at the
resonance babar:tdr; belle:tdr; Andrews:1982dp; Albrecht:1988vy where the
decay models for the and the have been demonstrated to match data.
As a full theoretical model for semileptonic decays is not yet implemented
in evtgen, a flat phase space (termed PHSP) simulation is used for decays. A correction is applied after generation to account for the proper semileptonic decay dynamics. Details of this correction are given in
Section IV.3.
IV.2 Detector simulation and comparison of
kinematic distributions
After an event has been simulated at the generator level, it is processed
with a full simulation of the CDF II detector and trigger. The geometry and
response of the active and passive detector components are simulated using the
geant software package geant. The events are then processed
with a two-track trigger decision program and reconstructed using the same
executable as that used to reconstruct the data.
The resulting events have the same structure and format as the data and are
analyzed in the framework described in
Section III.
Distributions of kinematic variables from the full simulation with
bgenerator input are compared with the same distributions from data. In order to
compare the data and the simulation, the data distributions are
background-subtracted. The agreement between the data and the simulation is
quantified by a comparison probability and the ratio of
spectra produced from the data and the simulation.
All relevant distributions agree satisfactorily.
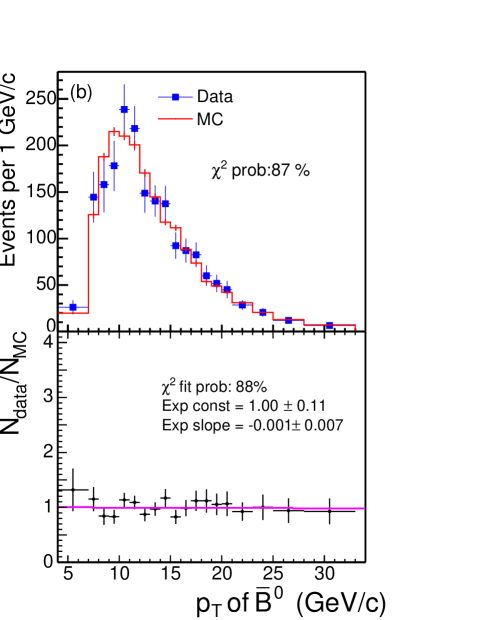
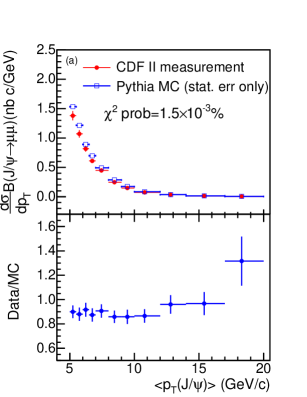
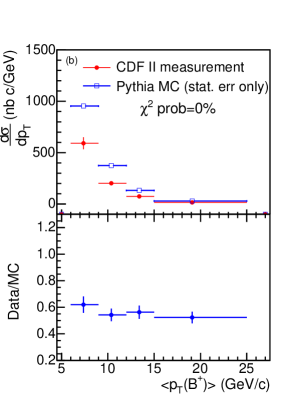
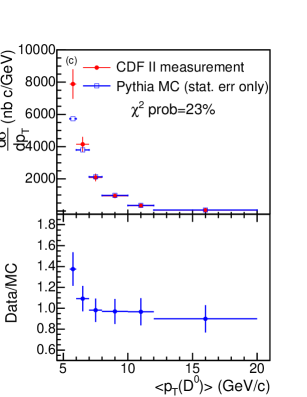
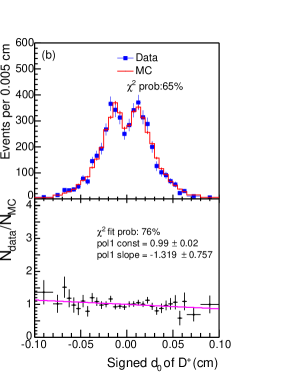
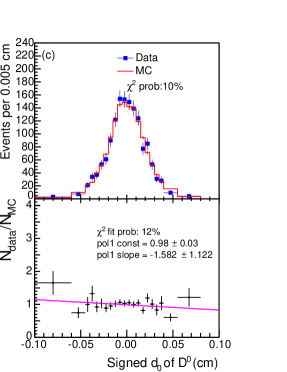
Figure 3 shows good agreement between the data and the
simulation in the and spectra.
The of the hadron is the most important kinematic variable in
this analysis because the -hadron momentum is distributed among three
particles in the final state for the exclusive semileptonic decay and between
two particles for the hadronic decay.
IV.3 Acceptance and efficiency scale factors
In order to obtain accurate estimates of the acceptance and efficiency,
several scale factors are applied to the number of events
selected in simulation and their values are listed in Table 2.
As mentioned earlier, evtgen contains only a phase space simulation of
semileptonic decays.
In order to estimate the effect of decay models on the signal acceptance, a
weighting of the flat
phase space distribution according to a form factor model from Huang et al.Huang:2005me for the hadronic current of the to transition, and
a model for the leptonic current, is performed at the generator level.
The ratio of the generator-level acceptance after weighting relative to that
before weighting, , is found to be .
Since this ratio is consistent with unity, the PHSP full simulation samples are
used throughout the analysis. The correction factor, ,
which accounts for the semileptonic decay dynamics, is applied to the
efficiencies for semileptonic decays.
The shape of the distribution is sensitive to the decay
dynamics and may be used to cross-check the form factor and models
(termed FF).
Figure 4 shows the reconstructed
distributions from the data and from the PHSP full simulation, before and after
multiplying the MC histogram with the bin-by-bin ratios which are derived from the
same generator-level simulation samples for ratio.
The corrected distribution has a significantly improved
agreement with the data, which confirms the procedure for
deriving .
In addition, the CMU muon reconstruction efficiency is found to be
over-estimated in the full simulation; the resulting scale factor,
, is measured using a sample of
decays CDF. The dependence of the XFT trigger efficiency on the
particle species and is not included in the full simulation.
Using a pure proton sample from the decays, and
pure kaon and pion samples from the decays
where Acosta:2004ts; yile:lblcpi; Yu:2005hw,
the data-to-MC scaling factors, , , and , are derived and
applied to the track which passes the trigger requirements in the
reconstruction program.
With a reliable simulation for the modeling of mass spectrum shapes, the
numbers of signal events can be determined by fitting the invariant
mass spectra in Fig. 2 as described in the following section.
Figure 3: Comparison of reconstructed spectra of -hadrons
between the data and the full simulation: (a) and (b) .
The top figures show the distributions while the bottom
figures show the ratio of data to MC. The curves
in the bottom figures
are the result of an exponential fit of the ratio.
Table 2: Acceptance and efficiency scale factors applied to the number of
events selected in simulation. The is the transverse momentum
(in ) of the track which passes the trigger requirements.
The uncertainty on is obtained by taking the difference between
the -dependent formula below and a constant from an
average over the sample, 0.905.
The uncertainties on and are below and
have negligible effect on the final relative branching fractions.
Scale Factor
Value
0.994
0.025
0.986
0.003
Figure 4: Comparison of reconstructed between the data and the
phase space (PHSP) full simulation, (a) before and (b) after
the MC histogram is corrected to account for the
proper semileptonic decay dynamics ratio. Note that the
feed-in backgrounds which are present in the sample are
already included in the simulation.
V Determination of the Signal Yields
The numbers of hadronic events and inclusive semileptonic
events in Eq. (1) are extracted by
fitting the and spectra in data, respectively.
The fit to the mass spectra is performed using an unbinned, extended likelihood
technique Cowan:1998ji, where the fit parameters are adjusted to
minimize the negative log-likelihood .
The general unbinned, extended log-likelihood is expressed as:
(4)
where represents the candidate and represents the
reconstructed mass or . The numbers of signal and
background events are denoted as and ; and are the
normalized functions which describe the shapes of signal and background mass
spectra, respectively.
Each is a Gaussian constraint on a specific
fit parameter :
(5)
where the parameter has a central value of and an
uncertainty of .
Because the data sample size is not large enough to determine these parameters
accurately from the fit, they are constrained to values which are estimated
from independent measurements and the full simulation. Definitions of the
constrained parameters () are given in Section V.1.
Correct modeling of the mass spectra is crucial in the determination of
and .
Two types of background appear in each mass window of interest.
The first is combinatorial background. Combinations of four random tracks
contribute to this background in both the hadronic and semileptonic modes.
Combinations of a real hadron and a random track contribute only in the
hadronic mode. The mass spectrum of the combinatorial background is determined
using data sidebands. The second background is misidentified or partially-reconstructed decays of hadrons. Their mass spectrum shapes are determined using the simulations as described in Section IV.
The dominant contributing decays
are identified with a generator-level simulation of inclusive
-hadron decays, and are categorized according to their mass spectrum shapes.
Decay modes with similar shapes are
generated together using a full simulation, with the number of
generated events for each decay mode proportional to the fragmentation fraction
times the branching ratio, and are parameterized by a single
function. The functional form for each combined background spectrum is
determined empirically to match the shape of simulated
mass distribution. The parameter values of each function are obtained by fitting the
simulated spectrum. When fitting data, the values of the shape parameters
are fixed while the normalization is a free parameter.
V.1 The spectrum for the yield
Figure 5(a) shows the spectrum with the fit
result superimposed.
The likelihood fit is performed in the mass
window , whereas Fig. 5(a) shows
a more restricted mass range near the signal peak.
The yield returned by the fit is .
The signal peak at is described by a
Gaussian function. The width of the Gaussian is constrained in the fit to
reduce the uncertainty on . The constrained width is the
product of a data/MC scale factor and the width of the
distribution in the full simulation,
which is . The scale factor,
,
is obtained by comparing the width of the invariant mass distribution in data
with that in the simulated events, using the decay which has a similar
topology and a larger data sample size.
The combinatorial background is parameterized by an exponential
(light-gray filled region), where the exponential
slope is determined by the candidates in the mass region above
5.7 .
The functions which describe the mass spectra of backgrounds from the misidentified or partially-reconstructed -hadron decays are determined from the
simulated mass distributions.
Details of the background from the misidentified or partially-reconstructed
-hadron decays follow.
The doubly Cabibbo-suppressed decays , with a pion mass mistakenly assumed for the kaon, are indicated by
the black filled region.
The ratio of the number of doubly Cabibbo-suppressed decays relative to that
of the signal mode, , is
fixed to in the fit. This value is obtained from the world average of
measurements in the modes.
Fully reconstructed -meson decays with misidentified daughters produce a
distinct peak at (wavy-line region). The
decays, where and one of the pions is
reconstructed as a proton, contribute about to this background. The
background from the remaining partially-reconstructed -meson decays has a
monotonically falling mass distribution (dark-gray filled region) dominated by
, where
, and where
and the ’s are not reconstructed
in the event.
The remaining decays also have a falling mass spectrum (hatched region)
dominated by
and where .
V.2 The spectrum for the yield
Figure 5(b) shows the spectrum for events with muons,
with the fit result superimposed.
The inclusive yield returned by the fit is
.
The fit for the spectrum is less complex than that for the
spectrum described above. Note that the signal peak includes the
backgrounds which also contain in the final state
(see Section VI). The signal peak at is modeled by a Gaussian function.
Background from the -hadron semileptonic decays with a -hadron daughter
misidentified as a , such as where
and one of the pions is assigned the proton mass, does not produce a peak or
distinctive structure and is inseparable from the combinatorial background.
These two backgrounds are combined and modeled by a second-order polynomial
(light-gray filled region).
V.3 Summary
Table 3 summarizes the hadronic and inclusive
semileptonic yields and the probability of corresponding fits.
Each model describes the data well, as indicated by the probability.
In order to obtain the number of exclusive semileptonic signal events ,
the contributions from backgrounds which also
produce a and a in the final state, , must
be subtracted from . Section VI describes the
estimation of the composition of the inclusive semileptonic data sample.
Section VII details observations of four new semileptonic
decays and the estimates of semileptonic and hadronic branching ratios
which are required to determine the
sample composition in Section VI.
Table 3: Observed number of events in each decay mode determined from
the unbinned, extended likelihood fit, NDF,
and the corresponding probability computed to indicate
quality of the fit.
Mode
Yield
NDF
Prob
123/111
20.7
48/38
13.0
Figure 5: Results (curve) of the unbinned, extended likelihood fits for
determining the numbers of candidates: (a) hadronic and (b) inclusive
semileptonic. The filled histograms indicate various backgrounds.
VI Composition of
the Inclusive Semileptonic Data
The factories babar:tdr; belle:tdr; Andrews:1982dp; Albrecht:1988vy
produce hadrons in interactions where the beam
energy may be used as a constraint when reconstructing events. This feature
is particularly helpful for reconstructing semileptonic decays where a
neutrino is missing. At the Tevatron, hadrons are produced by the
interactions between quarks and gluons with a broad parton momentum spectrum.
Therefore, beam energy constraints are not available to aid -hadron
reconstruction. Backgrounds which contain a , a , and other
particles in the final state can not be separated easily from the exclusive
semileptonic signal, , and will contribute to the inclusive
events observed in data. These backgrounds arise from three sources:
1.
false muon: a and a hadron track
(, or ) misidentified as a .
2.
/: a from the decay of a heavy-flavor hadron
() and a from the decay of the other heavy-flavor hadron
(), where the two hadrons are produced by
the fragmentation of () pairs.
3.
feed-in: decays of a single hadron into a , a ,
and particles not reconstructed in data.
The goal is to measure the branching fraction of the exclusive
semileptonic decay relative to that of the hadronic decay. The backgrounds
listed above must be subtracted from the observed number of inclusive
semileptonic events in data.
Equation (1) is then re-written as follows:
(6)
The number of false-muon events is obtained
from data containing a and a hadron track satisfying reconstruction
requirements, with the hadron track weighted by an appropriate
muon-misidentification probability.
The contributions from the /
and the feed-in backgrounds are estimated using
both data and simulation.
Instead of the absolute amount, the ratios and
are estimated. Estimating the ratios instead of the absolute
amount has one advantage: the majority of the background events are decays of
, so knowledge of the production cross-section is not necessary.
The quantities and are determined from the ratios
of the products of branching fractions and efficiencies
(times production cross-section for non- background).
The normalization procedure requires measurements or
estimates of the branching fractions for the decay and for several
semileptonic decays which may contribute to the backgrounds; details of
these measurements and estimates are found in Section VII.
The ratio has been estimated to be very small and contributes
to the signal. More information on and
backgrounds may be found in Appendix C.
The following sections describe the estimation of and .
VI.1 False muons
One type of semileptonic background is due to the pairing of a with a
proton, a kaon, or a pion which is misidentified as a muon. A hadron is
misidentified as a muon when it passes through the calorimeter into the muon
detector, or when it decays into a muon in flight. The probabilities for a
proton, kaon, or pion to be misidentified as a muon (,
, and , respectively) are measured using
a pure proton sample from the decays, and pure
and samples from the decays where
ash:dmm. The muon-misidentification
probability is defined as the fraction of the CMU-fiducial and SVT-matched
hadron tracks which satisfy the muon identification requirement (a track
associated with hits in the CMU and with a matching less than 9).
Figure 6 shows the (measured in twelve
bins) and ,
(measured in sixteen bins) for positively and negatively charged
tracks, separately. A difference is observed between
and in the low region, which is not seen for
protons and pions. The larger hadronic cross-section for the scattering
relative to that for the scattering results in a lower rate of
being misidentified as muons passing through the calorimeter.
The contribution of the false-muon background to the signal, ,
is obtained by weighting data containing a and a hadron track
, with
the muon-misidentification probability
as a function of the momentum of .
This hadron track must extrapolate to the fiducial region of the CMU and fail
the muon identification requirements in order to remove real muons. The
other selection criteria for the sample are the same as
those for the reconstruction.
The is then extracted from a fit of the
distribution produced from the weighted sample.
Figure 7 shows the result of the fit.
Since no particle identification requirement is applied, whether is a
proton, a kaon, or a pion can not be determined from data.
The muon-misidentification probability, ,
is, therefore, an average of , , and weighted by , , and (the fractions of ,
, in ):
(7)
In order to determine , , and , physics processes which
produce these hadrons must be understood.
The principal sources of these hadrons after analysis requirements are the
decays
, where is a , , or misidentified as a muon and could be nothing (e.g., ) or
any other particles which are not reconstructed
(e.g., ).
Other sources include: fragmentation of a primarily produced quark or gluon,
inelastic collisions of secondary particles with the detector material,
and decays of hadrons.
Hadrons which are not from -hadron decays are suppressed
by requiring that the transverse impact parameter
of the muon candidate is in the range 120 m–1000 m, and that the
and the muon candidates form a vertex significantly displaced
from the beam line (see Section III).
In addition, the pythia simulation indicates that the background
where a false muon and a signal originate from decays of
two different or hadrons is less than 0.1 of the inclusive
semileptonic signal and can be ignored.
Therefore, , , and are obtained from the
full simulation.
Table 4 shows values obtained for , , , and
. The uncertainty on includes: the statistical
uncertainty from the fit, the uncertainties on , , and
, and the uncertainties on the measured muon-misidentification
probabilities. The is approximately % of the number of
events.
Figure 6: The probability for a proton, kaon or pion to be misidentified as a muon
as a function of ash:dmm. Note that for the measurements
with negative values, a zero muon-misidentification probability is
used to weight data.Figure 7: Distribution of produced from data with a hadron track
and a candidate in the final state,
after weighting the hadron track with an average
muon-misidentification probability .
The curve indicates the result of the fit.
Table 4: The fractions of , , and in the
(, , and ), the estimated
number of false-muon events to the signal, and for
comparison, the number of the inclusive semileptonic events in data.
VI.2 Feed-in backgrounds
The feed-in backgrounds to the signal fall into three
categories:
1.
: Baryonic, semileptonic decays of //,
which decay into , an anti-nucleon and leptons
(e.g., ).
2.
: Semileptonic decays of other baryons
(e.g., ).
3.
: Other semileptonic decays of , which
include either additional
particles (e.g., ) or a higher mass baryon with subsequent
decay into the signal (e.g., , ),
and the ratio is expressed as:
(8)
The and have been
estimated to be very small and contribute to the signal.
Details of these estimates are found in Appendices A
and B.
The contributions from other semileptonic decays are estimated below.
The ratio is given by:
(9)
where and are the branching fraction of semileptonic decay mode and the efficiency of partially reconstructing
the decay as the semileptonic signal, respectively.
The estimate of starts by identifying the dominant
background decay modes that enter Eq. (9).
The observation of spin- and spin-Edwards:1994ar; Albrecht:1997qa indicates
the existence of and decays.
In addition, the following decays may contribute to the final state:
,
,
,
,
(non-resonant),
(non-resonant).
The decay in the tau channel, where
, also makes a small
contribution.
Equation (9) requires knowledge of the branching fractions of
and these background decays. In order to reduce systematic
uncertainties from theoretical predictions, the dominant background
decays, , , , and
, have been reconstructed in the data. Measurements of their
branching fractions relative to the branching fraction of the decay
and estimates of the branching fractions of and the other semileptonic decays are found in Section VII.
Once the list of background decay modes is established and their branching
fractions are estimated, the acceptances and efficiencies of these
backgrounds relative to that of the hadronic mode () are
obtained from the full simulation as described in Section IV.
Figure 8 shows that a minimum requirement on
of 3.7 reduces the backgrounds
from other semileptonic decays which have more particles in the final
state.
Table 5 summarizes the feed-in backgrounds from
the semileptonic decays discussed above and lists the
hadronic and inclusive semileptonic yields observed in data.
The two leading backgrounds after all selections are
and .
The total contribution from feed-in backgrounds has been estimated to be
% of the number of events.
Figure 8: The fully-simulated distributions
of the signal and backgrounds from
other semileptonic decays of , on a log scale.
The arrow indicates the minimum analysis requirement
at 3.7 . Note that the backgrounds tend to be at
the lower mass region.
Table 5: Feed-in backgrounds to from other
semileptonic decays.
The “” indicates decays which have been reconstructed for this
measurement and seen in data for the first time
(Section VII.1). The second column lists the estimated branching
fractions from Section VII. Numbers in parentheses are
estimated uncertainties cerror; berror.
The third column lists with statistical uncertainty.
All efficiencies are determined from the full simulation as described
in Section IV.
The fourth and the fifth columns list the normalization for each
background relative to the hadronic and the exclusive semileptonic
signals, respectively. The last column lists the number of events for
each background after multiplying
by
, and the uncertainty includes only the statistical uncertainty
on . Note that while the numbers listed in the fourth column are
used in the final measurement, the last two columns are shown only for
a comparison with the signal.
Mode
1.000
–
–
–
–
–
–
()
6.118
1.000
–
()
0.503
0.082
90
10
24
7
100
(5)
24
7
100
(5)
24
100
(5)
18
10
9
1
()
0.815
0.133
146
15
66
33
1
()
0.089
0.015
16
2
100
(5)
()
0.080
0.013
14
2
100
(5)
()
0.084
0.014
15
2
100
(5)
0.040
0.006
7
1
0.00
0.000
0.000
0
0.00
0.000
0.000
0
0.00
0.000
0.000
0
VI.3 Summary
Table 6 lists the values of all the background variables which
enter Eq. (6) and summarizes the composition of the inclusive
sample.
The dominant signal contamination is from the feed-in background. The second
largest background arises from false muons. The smallest background source is
/.
The estimate of
requires knowledge of the branching fraction of each feed-in decay and also
the hadronic decay . The next section details the measurements and
assumptions used to estimate these branching fractions.
Table 6:
The values of background variables in Eq. (6) and
the composition of the sample.
Uncertainties on the / and feed-in
backgrounds to the decay are statistical only.
The values of , , and in
Eq. (6) are ,
, and ,
respectively.
Source
Signal
–
–
False muon
–
/
–
Feed-in
–
VII Observations of Four New Semileptonic Decays and
Estimates of Semileptonic and Hadronic Branching Fractions
The size of the background contribution from the feed-in of other semileptonic
decays of , , is normalized to the observed
hadronic signal yield in data, with corrections for the relative acceptance
times efficiency for each decay mode [see Eq. (9)].
This procedure requires estimates of the
branching fractions for each background decay and also for the hadronic
signal. In order to reduce systematic
uncertainties from these branching fractions, resonant semileptonic decays
expected to contribute to the sample have been reconstructed in
data. These reconstructed decays are then used to
estimate the branching fractions of non-resonant semileptonic decays
with a constraint of the world average of and
an estimate of .
Note that the estimate of the and branching fractions appear
in the estimate of the backgrounds (Section VI.2). It must be
pointed out here that from Table 6, the total contribution of
feed-in background is % and contributes at most this amount to the
total uncertainty for this measurement. Furthermore, the ratio of the estimated
to need not be
the same as the final measured result.
Section VII.1 first presents measurements of the branching
fractions of four new semileptonic decays relative to that of the
decay:
, , , and ,
and then describes the estimation of
and branching fractions of
several non-resonant semileptonic
decays. Section VII.2 shows that how the distribution of the baryon produced from
collisions is significantly different from that of the meson and gives
the corresponding modification to the ratio, , with respect to the
CDF I measurement Affolder:1999iq. The ratio is then used
to estimate .
VII.1 Observations of four new semileptonic decays and
estimates of the semileptonic branching fractions
The following semileptonic decays are considered in the estimate of
in Section VI.2:
,
,
,
,
,
,
(non-resonant),
(non-resonant),
.
Among the nine decays above, none have been observed previously DELPHI;
only the branching fractions for the
and the decays have been predicted, but
with an uncertainty as large as 100Leibovich:1997az.
In order to reduce the systematic uncertainty on the final measurement
coming from the branching ratios of these backgrounds, the following decays
are searched for in a larger data sample (360 pb-1):
1.
where .
2.
where .
3.
where .
4.
where .
All four decays modes above contain in the final state.
The selection criteria are the same as those for the sample
(see Section III), except that two oppositely-charged
tracks are added to determine the secondary vertex for the and modes,
and one track is added for the modes. In all cases, the pion mass
is assumed for each additional track and each track is required to have 0.4 .
The available four-momentum transferred to the daughters in the decays of
these baryons into is small. Therefore, the
mass differences , ,
and , have a better resolution than the
masses of the -baryon candidates and are the figure of merit for detecting
signal peaks. Figure 9 shows the mass difference distributions,
where the numbers of signal events are determined by fitting the mass
differences to a Gaussian for the signal and a kinematically-motivated line
shape for the combinatorial background. Table 7 summarizes
the signal yields, the corresponding significances, and the fitted mass
differences. In this table, contributions of in
the modes have been subtracted from the modes and the significances of the
and modes are combined.
Systematic uncertainties on the yields are determined by varying the
functions for the combinatorial background in the fit.
This is the first observation of the decay.
Table 7: The observed number of signal events, the corresponding
significance , and the fitted mass
difference in data for each semileptonic decay mode.
Mode
Yield
Significance ()
[]
2.9
5.2
modes combined
2.1
After estimating, with simulation, the acceptance times efficiency of these
reconstructed decays relative to that of the decay, and
taking into account the false-muon background physbinnew, the relative
branching ratios are extracted:
where the two modes are averaged.
Assuming isospin symmetry leads to the estimate:
The systematic uncertainties on the relative branching fractions come from
variation of background fitting models and uncertainties on the low-momentum
pion spectrum and the correction to the reconstruction efficiency.
In order to convert the above measurements of the relative branching fractions
into absolute branching fractions, an estimate of is required. A recent measurement by the DELPHI collaboration reported
for this branching fraction Abdallah:2003gn. However, from
heavy quark symmetry, the semileptonic
decay widths for all hadrons are expected to be the same. Therefore,
semileptonic branching fractions of the hadrons, , vary only due to their lifetime differences. Since the
decays to a spin-, contributions from both S and P wave
amplitudes are expected.
A sum of , where the decays to [] correspond to the S(P) wave
amplitudes, yield
.
The number, %, is then scaled by the world average of the
ratio of lifetimes,
(stat+syst) pdg. The is estimated to be
, where the
first uncertainty arises from the propagation of errors and the second is half
of the difference between the above estimate and the DELPHI result whynotDELPHI.
The can be estimated by scaling by the ratio
of phase space area: .
The middle portion of
Table 8 summarizes the branching fractions of the semileptonic decays discussed above. Uncertainties on the observed semileptonic decays and the decay include uncertainties from the
relative branching fraction measurement and uncertainty from the assumed
. A 100 systematic uncertainty is also
assigned to .
The sum of and the branching fractions in the
middle portion of Table 8 is already larger than the inclusive semileptonic branching fraction in the 2008 PDG summary:
The following decays are, therefore, ignored in the central values but will
be included in the systematic uncertainty:
,
(non-resonant),
(non-resonant).
An estimate of these branching fractions is obtained by moving
upward by 1.
The remaining branching fraction is calculated to be:
The % is then attributed to the above decays which are ignored in the
central value. The branching fraction of is
estimated to be twice that of based
on the isospin invariance, and the mode is assumed to have the same
branching fraction as that of the mode.
The bottom portion of Table 8 lists zero central values for
these three decays and uses their estimated branching fractions above
as the systematic uncertainties on the branching fractions.
Figure 9:
The excited--baryon candidates which are associated with a : (a) and , (b) , and (c) .
The curves indicate fit results to the spectra of mass differences.
Table 8: The semileptonic branching fractions for decays
which are included in the central value (middle portion) and those
which are not (bottom portion).
All the numbers in parentheses are estimated uncertainties.
Mode
BR
()
()
()
()
()
()
0
0
0
VII.2 Modification of and estimate of
Equation (9) requires to obtain
the ratio .
Combining the CDF measurement
yile:lblcpi,
the world average of , and the ratio
of production cross-sections
one may express
(10)
The ratio of cross sections, , is calculated from the expression:
(11)
where is the
CDF I result: Affolder:1999iq. The ,
, and are the correction factors to account for
differences between the CDF I result and
this analysis in: the assumed , kinematic acceptance, and
requirements on the minimum of and .
Each correction factor is explained in the text that follows.
The CDF I analysis used electron-charm final states,
such as , ,
and , to measure the ratio of production
cross-sections. The branching fraction, , was
needed and estimated to be
, while this analysis estimates the value to be
. The uncertainty % is dominated
by the difference from the DELPHI result (see Section VII.1).
In order to be consistent within this analysis, a correction to the
branching fraction, , is applied. The value of is
the ratio of 7.94% to % and found to be
.
In the CDF I analysis,
the and spectra measured with fully-reconstructed decays were
not available. In order to extract the signal acceptance and
efficiency, the Nason-Dawson-Ellis (NDE)
-quark spectrum Nason:1989zy followed by the
Peterson fragmentation model Peterson:1982ak was used at CDF I to obtain
the distributions of hadrons in simulation Taylor:1999fh. The
two-track trigger allows CDF II to collect large samples of fully-reconstructed
-hadron decays, such as and , and to compare the distributions in data with those from the NDE+Peterson model.
The and the spectra from the NDE+Peterson model are found to
be harder (more hadrons at higher ) than those measured in data,
which indicates an over-estimate of acceptance in the CDF I analysis,
particularly for the decays.
The acceptance correction factor, , is the ratio of
acceptances using generator-level simulations with inputs from the measured
spectra (identical to those described in Section IV.1)
and from the NDE+Peterson model:
(12)
where is the ratio of the kinematic acceptances of and
.
The value of the correction factor is found to be:
for the CDF I kinematic requirements alpha.
The uncertainty comes from the uncertainties on
the measured shapes of the and distributions in data.
The last correction is due to a difference in the minimum requirements
between the CDF I analysis [] and this analysis
[]. By applying the same requirements to the and
decays reconstructed in the two-track trigger data,
Fig. 10 shows that the spectrum is significantly
softer (more hadrons at lower ) than that of the xsecrec.
Figure 11 illustrates the dependence of the ratio of
cross-sections on the minimum requirements, for a small [(a)] and a large
[(c)] difference between the and spectra; the scenario
in Fig. 11(c) is what has been observed in data.
A correction factor, , is required:
(13)
The is obtained using the generator-level simulation with inputs
from the measured spectra of and
(identical to those described in Section IV.1). The value of the correction factor is found to
be:
where the uncertainty also comes from the uncertainties on
the measured distributions in data.
After applying corrections , , and ,
is calculated to be:
where the uncertainties are from the uncertainty on the CDF I measurement
of , the difference between the estimated for this analysis and that measured by DELPHI,
and the uncertainties on the measured shapes of the and distributions. The value of is also consistent with the result
from Gibson:2006rt. The is then extracted
following Eq. (10),
with the input of the parameters listed in Table 9, and is
found to be:
The “systother” uncertainty includes the uncertainty on the
CDF I measurement, and the uncertainty on which is dominated by the world
average of
whylcpkpi.
This evaluation of differs from that of the Particle Data
Group due to the
differing production spectrum of the relative to the as described
in the previous text whynotlblcpipdg. The estimated value is in good
agreement with the values predicted by
Leibovich et al.Leibovich:2003tw,
, and Cheng Cheng:1996cs,
,
which gives confidence in the procedure described above.
The estimated has been used in Eq. (9) to
estimate (see Section VI.2).
Table 9: Parameters for calculating .
Text in parentheses indicate the sources of uncertainty:
the data sample size, general systematics, shapes of measured distributions, and difference from DELPHI’s
.
Parameter
Value
CDF I
Figure 10: Comparison of the reconstructed and spectra in data. The
negative slope (3–4 away from zero) of the ratio of to
histograms indicates that the distribution is softer
(more hadrons at lower ) than the distribution.
In order to have a fair comparison of spectra, the same requirements
are applied to the and candidates xsecrec, while
Fig. 3 has different selections for the and .
Nevertheless, the spectra, used as inputs for the correction
factors and , have been
corrected for acceptance and efficiency and are identical to those
described in Section IV.1.
Figure 11: Examples of the and spectra [(a), (c)] and the dependence of the
production cross-section ratio on the minimum requirements,
[(b), (d)].
Figures 11(a) and (b) show the case where both hadrons have similar spectra; the
ratio of the integrated areas underneath the spectra, from and above, depends little on the value of .
Figures 11(c) and (d) show that the spectrum
is significantly softer (more hadrons at lower ) than the spectrum; the ratio of the integrated areas depends strongly on the value of
.
VIII Systematic Uncertainties
The relative branching fractions ,
with statistical uncertainty only, can now be extracted from
Eq. (1):
A check of internal consistency is performed by dividing the data
and simulation samples into several groups of independent subsets, according
to the time period, vertex position, and of the candidate, and of the candidate, etc.
Figure 12 shows that the of
each subset for each group is consistent with those of the other subsets in
the same group. The result of this
check also proves that there is no major problem in the detector, trigger,
reconstruction, or simulation which produces bias in the measurement.
Figure 12: Internal-consistency check of the relative branching fractions.
The uncertainty on each point is statistical only.
Each independent group is separated by a horizontal dashed line.
The solid bands indicate the relative branching fractions with their
statistical uncertainties from the complete, undivided samples.
The systematic uncertainties on may be classified as internal and
external. Internal uncertainties are those which affect the final
measurement through their effects on the observed yields, the numbers of false-muon and background events, and the modeling of acceptance
times efficiency. External uncertainties are those from production
fractions and branching ratios which are used in Eqs. (9)
and (14) to determine .
The input value for each systematic source is varied by
where is the uncertainty on the input value.
The resulting difference in from the central value is the systematic
uncertainty. The following text describes how the uncertainty for each
systematic source is obtained.
VIII.1 Internal systematic uncertainties
The signal yields, and , are affected by the
background functions which describe the mass spectra of misidentified or
partially-reconstructed decays of hadrons. The
systematic uncertainty on the fitting model is estimated by
changing the relative fraction of the contributing decays in each background
function. The fragmentation fraction and the branching ratio of every
contributing decay are varied independently according to their uncertainties by uncertainty.
After combining these contributing decays according to their modified
fragmentation fractions and branching ratios and producing a new simulated mass
spectrum, the parameter values for each background function are re-determined.
The spectrum in data is re-fit again using the new background
function and the systematic uncertainty is taken from the deviation of the
yield from the central value.
Correlations between different parameters have been taken into account.
For the fitting of , since no branching ratio assumptions are made,
no systematic uncertainty is assigned.
The uncertainty on the false-muon estimate is driven by: 1) the size of the
sample used to measure the false-muon probability, 2) the fit to the weighted
mass distributions, and 3) the probability of a hadron track being a
, a , or a , which is determined from simulation.
The resulting changes in the number of false-muon events from the three
sources above are added in quadrature and already listed in Table 4.
The size of the / background contribution has a 100
systematic uncertainty, due to a lack of knowledge of the relative
/
production rates between different processes Acosta:2004nj and the
10–50 discrepancy of the inclusive hadron production cross-section
between pythia and data (Appendix C).
The uncertainty on the modeling of acceptance times efficiency for signal
and background processes arises from:
the size of simulation samples, the shapes of the measured and spectra, the efficiency scale factors of the semileptonic decay model/muon reconstruction/XFT trigger (see Section IV), the
amount of material in the detector simulation, the lifetime, the Dalitz structure, and the and polarizations.
The and distributions used as inputs for bgenerator are varied according to the uncertainties on the exponential slopes
of data to MC ratios (shown in Fig. 3). The uncertainties on
the efficiency scale factors for the semileptonic decay model/muon
reconstruction/XFT trigger are listed in Table 2.
The uncertainty from the detector material is obtained by switching off
the hadronic interaction in the detector simulation and multiplying the
efficiency difference from the central value by 25. The 25 is a
quadrature sum of the 15 underestimate in the amount of material and
the 20 difference between the GHEISHA and FLUKA models geant; numi.
The lifetime used as an input for bgenerator is varied according to
the uncertainty on the world average pdg.
The effect of the Dalitz structure is studied by varying branching
fractions of the resonant and non-resonant
decays measured by E791 e791 by their uncertainties.
The unpolarized and simulation samples have been used to obtain
the central values of acceptance times efficiency of decays. For the
systematics study, angular distributions in simulation are re-weighted
according to all combinations of the and polarization
states: , assuming the extreme scenario where the and baryons are 100 polarized. The difference in the kinematic acceptances
between the simulation with re-weighted angular distributions and the
simulation with unpolarized and is used to assign a systematic
uncertainty on .
VIII.2 External systematic uncertainties
There are two types of external systematic uncertainties. The first type
is denoted as the “PDG” uncertainty and includes uncertainties on:
the world average of , the CDF I measurement of
, the CDF measurement of , and the measured branching fractions
of the four new semileptonic decays relative to that of the decay (see Section VII.1). The second type is denoted as the
“EBR” uncertainty and comes from unmeasured
branching fractions estimated from theory. A 5 uncertainty is assigned to
the estimated branching fractions of the excited -hadron decays cerror.
A 100 uncertainty is assigned to the other unobserved -hadron decays to
cover the wide range of theoretical predictions berror.
Note that the uncertainty on the estimated
does not affect the final measurement because it affects the
branching fractions of and other semileptonic decays in the
same way so that any change completely cancels.
VIII.3 Summary
The fractional systematic and statistical uncertainties on the relative
branching fraction are summarized in Table 10. The leading sources
of internal systematic uncertainty are the mass fitting model, the shapes
of the measured spectra, and the semileptonic decay model.
The PDG uncertainty is dominated by the world average of
and the CDF I measurement of which have been used to extract
detail.
The uncertainty on
may be reduced in the near future by more precise measurements
proposed by Dunietz Dunietz:1998uz and
Migliozzi Migliozzi:1999ca. The EBR uncertainty is dominated by
the branching fractions of non-resonant
and decays. The relative branching fraction with
complete uncertainties is found to be:
The uncertainties are from statistics (stat), internal systematics
(syst), world averages of measurements published
by the Particle Data Group or subsidiary measurements in this analysis
, and unmeasured branching
fractions estimated from theory , respectively.
Table 10: Summary of statistical and systematic uncertainties for the
mode. The is the uncertainty on the relative
branching fraction, .
Source
Mass fitting
False
1.0
/ background
0.3
Simulation sample size
2.0
-hadron spectrum
decay model
3.3
XFT/CMU efficiency scale factor
0.4
detector material
1.3
lifetime
0.3
Dalitz
0.4
, polarizations
2.2
Sum of internal
6.3
PDG
Estimated branching fractions
2.1
Statistical
17.8
IX Measurements of the Relative Branching Fractions
The same analysis technique used for the samples is applied to the
decays. This section only describes the difference in the details of
event reconstruction, yield determination, and background estimation and
summarizes the systematic uncertainties.
IX.1 Reconstruction of the candidates
The following decay modes are reconstructed in the data collected with the
two-track trigger:
1.
and , where .
2.
and , where .
The requirements on the and candidates are kept as similar as
possible.
For the reconstruction of decays, the pion mass
is assigned to the two positively charged tracks and the kaon mass to
the negatively charged track. The invariant mass of the three tracks
(), as computed by a three-track kinematic fit, is required to be
in the range 1.74 – 2.00 .
The signals are reconstructed by first looking for
candidates.
A two-track kinematic fit determines the vertex,
and the invariant mass of the two tracks () is required to be
within the range 1.820 – 1.906 . Then, the pion mass is assigned to
an additional positively charged track.
This third track is expected to have a low due to the small four-momentum
transfer in the decay. However, a minimum
requirement of 0.5 is imposed to ensure a good measurement
of the pion track.
For the candidate, the mass difference,
, must be within the range 0.14 – 0.18 .
In order to form a candidate, the and candidates are
then combined with an additional negatively charged track
which satisfies the requirements described in Section III.
After the four-track kinematic fit, the values of for the
and for the must be in the range:
1.8517 – 1.8837 and 0.143 – 0.148 for the hadronic
candidates; 1.74 – 2.00 and 0.14 – 0.18 for the inclusive
semileptonic candidates. The four-track invariant mass, and
, must be within 3.0 – 5.3 for the
semileptonic decays. Selection criteria for the following variables:
of the fourth -candidate track [],
of , of , and combined
of the four-track system,
of the and vertex fits, and
of the four-track kinematic fits,
of the and candidates, and of the candidate, are also optimized using the simulation and data of hadronic modes,
as described
for the sample. Table 11 lists the optimized values.
Table 11: Optimized requirements for reconstructing the
, , , and decays.
2
2
5
5
6
6
14
16
15
17
m
m
200 m
200 m
IX.2 Determination of the yields
Figure 13(a) shows the fit result for the
spectrum.
The yield returned by the fit is .
The signal peak at and the combinatorial
background are described by a Gaussian function and an exponential,
respectively. The ratio of the number of doubly Cabibbo-suppressed decays
relative to that of the signal mode, , is
Gaussian-constrained to the
value for the relative branching ratio from the PDG, convoluted with the
efficiency from the full simulation. The constrained value is
.
Backgrounds from the other -hadron decays consist of the
following decays. The decays,
where ,
and the pion mass is assigned to one of the kaons, appear as a peak at
around 5.31 .
Misreconstructed decays, where and
the pion mass is assigned to the proton, form a broad peak around 5.4
. The backgrounds from the ,
, and decays are combined
and indicated by the black filled region.
The
decays, where and the is not
reconstructed in the event, have a triangular mass distribution which
peaks at . The
decays, where and the is not
reconstructed, have a double-peak structure. This structure is
consistent with the spin-1 being polarized.
This polarization results in the from the decay having a
momentum preferentially parallel or anti-parallel to the momentum of .
The and backgrounds are combined
and indicated by the dark-gray filled region. The
remaining partially-reconstructed decays of hadrons,
, have a monotonically falling distribution (hatched region).
The determination
of the background shapes and the estimation of systematic uncertainty are
similar to those in the system.
Figure 13(b) shows the fit result for the spectrum
for events with muons.
The inclusive yield returned by the fit is .
The signal peak at is described by a
Gaussian function.
The combinatorial background (light-gray filled region) is parameterized by a
first-order polynomial. Misidentified decays
(black filled region), where the mass of at least
one daughter has been misassigned, appear in the mass window of
interest. The dominant contributing decay modes are
,
, and non-resonant .
The function parameters describing the shape of misidentified spectrum
are obtained from the
simulation;
in this simulation, the ’s are forced to decay only to the final
states which can yield misidentified mass in the
window. The number of the background events is
constrained to the estimated number of
events in the data as
described below. First, the following decay mode is reconstructed in the data:
, where
and . The narrow resonance provides a good handle for removing the combinatorial
background of . Second, the fraction from the mode
relative to all contributing decays is
extracted using the world averages of the branching ratios, and the
acceptance times efficiency determined from the full simulation. Then,
is simply the yield of the mode in data divided by
. The value of for the constraint is .
The systematic uncertainty is assigned by independently varying the ratio of
the branching fraction of one specific decay relative to that of the
decay by , since the
branching fractions of all decays have been measured relative to that of
the mode pdg.
Figure 13(c) shows the fit result for the
spectrum.
The yield returned by the fit is .
The analysis of the signal and backgrounds is similar to
that in the mode. The only difference is that extra constraints
are imposed due to the small size of the sample.
The width of the signal Gaussian ,
the ratio , and the
ratio of backgrounds , are constrained to ,
, and , respectively.
The systematic uncertainty is assessed in the same way as
in the and the modes.
Figure 13(d) shows the fit result for the
spectrum for events with muons.
The likelihood fit for the mode is performed in the
mass window whereas
Fig. 13(d) shows a more restricted mass range near the signal
peaks.
The inclusive yield returned by the fit is
.
The signal peak at is modeled by
two Gaussian distributions with a common mean and different widths. The
combinatorial background (light-gray filled region) is parameterized by a
constant, while the background from other -hadron decays with
misidentified -hadron daughters is found to be negligible.
The size of the combinatorial background is very small due to the requirement
that is consistent with the world average mass, the
minimum requirement on the mass , and the minimum requirements on
the and the number of SVX hits for the low-momentum pion from the
decay (Section IX.1).
The fitting function for this spectrum does not use any branching ratios
and no systematic uncertainty is assigned.
Table 12 summarizes the hadronic and inclusive
semileptonic yields and the probability of corresponding fits.
Each model describes the data well, as indicated by the probability.
Table 12: Observed number of events in each decay mode determined from
the unbinned, extended likelihood fit, NDF,
and the corresponding probability computed to indicate
quality of the fit.
Mode
Yield
NDF
Prob
80/91
78.9
47/31
3.40
21/12
5.40
108/93
14.1
Figure 13: Results (curve) of the unbinned, extended likelihood fits for
determining the numbers of candidates: the hadronic modes (a)
and (c) , and inclusive semileptonic modes (b)
and (d) . The filled histograms indicate
various backgrounds.
IX.3 Compositions of the inclusive semileptonic data
The procedures for estimating the backgrounds to the and decays are similar to those described in
Section VI. The following
describes the differences when estimating the feed-in background, , in
the system.
Unlike the system, many decays of and mesons have been measured
by other experiments babar:tdr; belle:tdr; Andrews:1982dp; Albrecht:1988vy,
and serve as inputs to the evtgen decay package. In addition, evtgen also
includes estimates of branching fractions for decay modes which have not yet
been measured. Therefore, all possible decays which may contribute to the
in the control samples are studied using the PDG summary and
the default evtgen decay table pdg; evtgen.
The feed-in backgrounds to the and signals fall
into two categories:
1.
Semileptonic decays of //, which include
either additional particles (e.g.,
) or a higher
mass meson with subsequent decay into the -meson signal
(e.g., , )
2.
Hadronic decays of mesons into two mesons: one meson
decays hadronically in a reconstructed final state, the other meson
decays semileptonically (e.g., ,
).
Branching fractions of the decays relative to the
signal are all below . A generator-level study indicates that they are
further suppressed after a minimum requirement on the four-track invariant
mass, , and therefore, contribute less than to the
signal. Backgrounds from mesons decaying semileptonically to more particles
or higher mass mesons are also reduced or eliminated by the same
minimum mass requirement.
Tables 14–14 summarize the feed-in
backgrounds which contribute to the and the decays. The definition of quantities listed in each column follows
Table 5.
Only these decays are subtracted from the inclusive semileptonic yield.
The leading background to is where
.
The leading background to is
where
.
Combining information compiled in the PDG, backgrounds from
which are not considered in
Tables 14–14 contribute less than
to the signal.
The estimates of and for the are identical to those for
the . Table 15 lists the results.
Figure 14 shows
the and distributions weighted with
muon-misidentification probabilities and the results of the fit.
Table 13: The feed-in backgrounds to the signal.
For the
decay, the from
the PDG is used to obtain
Bs; support.
Numbers in parentheses are estimated uncertainties for the
unmeasured branching fractions b0error.
The definition of quantities listed in each column follows
Table 5.
Mode
1.000
–
–
–
–
–
–
2.17
0.12
3.688
1.000
–
5.16
0.11
2.314
0.627
1340
69
32.30
0.64
0.30
(0.30)
0.185
0.050
107
6
1.00
0.40
0.065
0.018
37
2
0.40
0.07
0.134
0.036
78
4
32.30
0.64
0.37
(0.37)
0.081
0.022
47
2
66.67
(3.33)
32.30
0.64
0.42
0.05
0.259
0.070
150
8
0.30
(0.30)
0.064
0.017
37
2
Table 14: The feed-in backgrounds to the signal.
Mode
0.276
0.013
1.000
–
–
–
–
–
–
5.16
0.11
8.361
1.000
–
0.81
(0.32)
0.341
0.041
36
4
33.33
(1.67)
0.37
(0.37)
0.150
0.018
16
2
33.33
(1.67)
0.10
(0.10)
0.086
0.010
9
1
1.60
0.50
0.137
0.016
14
2
0.40
0.07
0.516
0.062
55
6
0.37
(0.37)
0.314
0.038
33
3
66.67
(3.33)
0.61
0.06
0.534
0.064
57
6
Figure 14: The invariant mass distributions produced from data with a hadron track
and a -meson candidate in the final
state, after weighting the hadron track with an average
muon-misidentification probability
: (a) and (b)
.
The curves indicate the results of the fit.
Table 15:
The estimated sizes of the false-muon, , , and feed-in
background contribution to the and signals and the
observed yields in data. Uncertainties on the , ,
and feed-in backgrounds are statistical only.
230
19
44
3
The compositions of the inclusive and
samples are summarized in Table 16.
The dominant signal contamination is from the feed-in background. The second
largest background arises from false muons. The smallest background source is
from /.
Table 16: The composition of the inclusive and
data sample.
Signal
False muon
/
Feed-in
IX.4 Systematic uncertainties
Figure 15 shows a summary of internal consistency checks.
The fractional systematic and statistical uncertainties on the relative
branching fractions are summarized in Table 17. The leading sources
of internal systematic uncertainties are the mass fitting models and the
shape of the measured spectrum.
The dominant PDG uncertainties come from for the mode, and for the mode.
The dominant uncertainties on the estimated branching fractions come from
for the mode and for the mode.
The relative branching fractions with complete uncertainties
are found to be:
The uncertainties are from statistics (stat), internal systematics
(syst), world averages of measurements published
by the Particle Data Group or subsidiary measurements in this analysis
, and unmeasured branching
fractions estimated from theory , respectively.
Figure 15: Internal-consistency checks of the relative branching
fractions measured in the two control samples:
(a) decays and (b) decays.
The uncertainty on each point is statistical only.
Each independent group is separated by a horizontal dashed line.
The solid bands indicate the relative branching fractions with their
statistical uncertainties from the complete, undivided samples.
Table 17: Summary of statistical and systematic uncertainties for the
modes. The is uncertainty on the relative
branching fraction, .
Source
Mass fitting
4.1
0.1
False
0.7
0.4
/ background
2.9
1.7
Simulation sample size
1.6
1.7
spectrum
3.0
2.4
XFT/CMU efficiency scale factor
0.5
0.4
detector material
1.7
1.3
Sum of internal
6.3
3.7
PDG
4.1
2.8
Estimated branching fractions
4.7
4.9
Statistical
9.7
14.1
X Results
The and relative branching fractions are measured to be:
The uncertainties are from statistics (stat), internal systematics
(syst), world averages of measurements published
by the Particle Data Group or subsidiary measurements in this analysis
, and unmeasured branching
fractions estimated from theory , respectively.
The control sample results are consistent with the ratios published by the 2008
PDG pdg at the and level, respectively (see Table 18).
The measured ratio of branching fractions is compared with
the predicted value based on HQET.
The prediction has a uncertainty and is obtained by combining
the results of Huang et al.Huang:2005me and
Leibovich et al.Leibovich:2003twwhynotcheng.
Figure 16 shows the consistency between this measurement
and the theoretical prediction.
The branching fractions of the four new semileptonic decays relative to
that of are measured to be:
Table 18: The relative branching fractions
measured in this analysis and those published in
the 2008 PDG pdg. The measurements of this analysis include both the statistical
and the systematic uncertainties.
Mode
PDG
This Analysis
Figure 16:
Comparison of the measured
with the theoretical prediction based on HQET
by Huang et al.Huang:2005me and
Leibovich et al.Leibovich:2003tw.
The measurement includes both the statistical
and the systematic uncertainties.
XI Conclusion
Using data from an integrated luminosity of
collected with the CDF II detector,
and signal events are reconstructed.
The large sample enables the measurement of
and the comparison to the predictions of heavy quark effective theory.
The uncertainty is dominated by the size of the data sample, the world average
of , and the CDF I
measurement of .
Ratios for the control modes,
and , are found to be in good agreement with the world averages pdg.
For the first time,
the semileptonic decay has been observed and three
other semileptonic decays, , , and
, have been reconstructed, using data from an integrated luminosity of . Measurements of the ratios
of their branching fractions to the branching fraction of have been
performed. Finally, the transverse-momentum distribution of the baryon
produced in collisions is found to be softer (more
hadrons at lower ) than that of the meson; this results in a
new estimate for in better agreement with the
theory than the PDG evaluation.
Acknowledgments
We thank the Fermilab staff and the technical staffs of the participating institutions for their vital contributions. This work was supported by the U.S. Department of Energy and National Science Foundation; the Italian Istituto Nazionale di Fisica Nucleare; the Ministry of Education, Culture, Sports, Science and Technology of Japan; the Natural Sciences and Engineering Research Council of Canada; the National Science Council of the Republic of China; the Swiss National Science Foundation; the A.P. Sloan Foundation; the Bundesministerium für Bildung und Forschung, Germany; the Korean Science and Engineering Foundation and the Korean Research Foundation; the Science and Technology Facilities Council and the Royal Society, UK; the Institut National de Physique Nucleaire et Physique des Particules/CNRS; the Russian Foundation for Basic Research; the Ministerio de Ciencia e Innovación, and Programa Consolider-Ingenio 2010, Spain; the Slovak R&D Agency; and the Academy of Finland.
Appendix A Semileptonic Decays of Mesons to Baryons
The number of feed-in events from semileptonic decays of mesons to
baryons
is also normalized to the yield
in data and has an
expression similar to that of Eq. (9):
(14)
where and are the production
cross-sections of mesons and baryons for greater than 6 .
A list of -meson decays that may contribute to the
sample is obtained from an inclusive sample of -meson
semi-muonic decays generated using pythia. After applying the trigger and
analysis requirements to the pythia generated events, the maximum
contributing decays are found to be
and
.
While there are measurements of branching ratios of the -meson hadronic
decays to baryons, e.g., ,
there is only an upper limit for the semileptonic decay of :
Assuming the branching fractions of the muon-neutron and muon-proton final
states are the same as that of the proton-electron final state,
the value of this upper limit is then taken for the branching fraction of the
and
the decays.
The ratio , for example, is then given by:
The ratio follows Eq. (15), assuming the production fractions are
the same for the and mesons support.
Table 19 lists the estimated size of the feed-in background
contribution from semileptonic decays of mesons to baryons.
Table 19: Feed-in backgrounds to from mesons. All the numbers in
parentheses are estimated uncertainties.
The definition of quantities listed in each column follows
Table 5.
Mode
1.000
–
–
–
–
–
–
()
6.118
1.000
–
0.15
0.024
0.004
4.3
0.5
0.15
0.025
0.004
4.5
0.5
Appendix B Semileptonic Decays of Other Baryons
In addition to the feed-in backgrounds from the semileptonic decays of
mesons to baryons, contributions are also expected from the semileptonic
decays of other baryons. Until recently :2007rw; :2007un, the was the only baryon which had been observed unambiguously. Therefore, in
order to estimate the number of feed-in background events, the production cross
section of the other baryons and the branching ratio of the feed-in
channel must be estimated. The first step in the estimation is to identify
possible contributions to the feed-in.
Of the lowest lying baryons, the members of triplet are expected
to decay to via the strong interaction and contribute to the signal.
This leaves , , and and they are expected
to decay predominantly to and . However, by vacuum
production of one or more pairs, these baryons can decay
into a , specifically,
,
,
.
Since the decays have a decay topology similar to
and the decay topology is similar to that
of , a branching fraction of , , and
(given in Table 8) are assigned to these three decays,
respectively. CDF reports observing 17
events in data from an integrated luminosity of approximately
:2007un.
Assuming that the branching fraction for is
similar to that reported by the Particle Data Group for
pdg, using a generator-level
simulation to estimate the ratio of acceptances of
relative to that of
(0.2), and scaling by the
ratio of luminosities for this analysis and the analysis (172/1900),
each of the decays is found to contribute approximately % to
the signal. For the decays, a similar calculation is performed
assuming the same production rate as for the . However, because of
the larger number of particles in the decay, the acceptance
for the is an order of magnitude smaller than that of the
. For the , the contribution is %. These
three decays are found to contribute to the signal and may be
ignored Dzero.
Appendix C The / Background
The / background refers to the pairing of a and a
real muon from the decays of two different heavy-flavor hadrons produced by
the fragmentation of or pairs.
In collisions, the and quarks are primarily pair-produced
via the strong interaction; the single-quark production cross-section via the
electroweak process, or , is
more than 20,000 times smaller Acosta:2004uq; wxsec.
Figure 17 shows the Feynman diagrams up to for
the three processes which contribute to the /
production Mangano:1991jk; Halzen:1982iq: flavor creation, flavor
excitation, and gluon splitting. Flavor creation,
referring to gluon fusion and quark anti-quark annihilation, tends to produce
/ pairs with an azimuthal angle distribution
between the two quarks which peaks at .
In contrast, the distribution is more evenly distributed for the
flavor excitation and the low-momentum gluon splitting and peaks at small
angles for the
high-momentum gluon splitting. When is small, daughters of the
two heavy-flavor hadrons from the fragmentation of / may
appear to come from the same decay vertex, as shown in Fig. 18. If one hadron decays semileptonically, and the other hadron decays into a
final state including a decay, the
muon from the semileptonic decay together with the may be misidentified
as the exclusive semileptonic signal, . An estimate using pythia has
shown that this measurement is most sensitive to the /
background from high-momentum gluon splitting.
In the following, the determination of the background contribution
is described. The same procedure is followed for the background.
The ratio is given by:
(17)
The is the production cross-section of pairs;
and are
the probabilities for a and a quark to fragment into a
hadron and a hadron and to decay to a final state including
a and a , respectively.
The is the
acceptance times efficiency for reconstructing the background as the signal. The denominator of Eq. (17) can be re-written using
the CDF measurement yile:lblcpi defined in Eq. (16),
the CDF measurement of Abulencia:2006ps assuming support,
and the world average of :
(18)
The is determined from a signal simulation generated with
the bgenerator program whygen; restrict and
Table 20 lists the parameters for calculating the denominator of
Eq. (18).
In order to determine the numerator of Eq. (18),
inclusive events are first generated with pythia.
The of the hard scattering, i.e. the part of the interaction with the
largest momentum scale, is required to be greater than 5 . At least one
quark must have a greater than 4 and less
than 1.5.
The value of , after applying the kinematic
requirements above, is obtained from pythia,
since the status of the measurements at the Tevatron
is still inconclusive Happacher:2005gx; Tevatron_bb; giromini.
Then, the gluon-splitting events are filtered and the decays are simulated with
evtgen. Only events with a and a which pass the
generator-level trigger and analysis requirements are considered further.
Ancestors of the and the determine whether they originate from
pairs or single hadrons, and are retrieved by tracing the
information from the generator. The number of events satisfying these
criteria divided by
the number of generated events gives the product
.
Table 21 lists the parameters for the determination of the numerator
of Eq. (18).
Table 22
lists the estimated ratios, and ,
based on the values in Tables 20–21.
The is found to be only % of the number of inclusive events.
The production of and pairs in collisions
has not yet been completely
understood Acosta:2004nj; Happacher:2005gx; Tevatron_bb; giromini.
In order to understand how well pythia predicts and
, an indirect cross-check was performed by comparing the
differential cross-sections of inclusive hadrons, , and
in pythia with the
CDF measurements CDF; Abulencia:2006ps; cchen:dxec
(see Appendix C.1). The discrepancy between pythia and the data cross-sections is generally within for
hadrons and for hadrons, which will be included in the systematic
uncertainty in Section VIII. Another cross-check using
the signed impact parameter distributions of the baryons
(see Appendix C.2)
indicates a negligible contribution of promptly produced from ,
which is consistent with the above estimate using pythia.
Figure 17: Representative lowest-order Feynman diagrams that contribute to
the pair production of quarks Mangano:1991jk; Halzen:1982iq.
Figure 18: The hadrons from with (a) small and (b) large
. Unlike Fig. 18(b),
Fig. 18(a) shows that the and
the muon from the semileptonic decay of form
a secondary vertex and are misidentified as the signal.
Table 20: Parameters used to calculate the denominator of
Eq. (18).
CDF (b)
(10-4b)
Table 21: Parameters used to determine the numerator of Eq. (18).
The uncertainties are statistical only.
pythia (b)
49.6
pythia (b)
198.4
Table 22:
The estimated size of the and background
contribution to the signal and the observed yields in data.
C.1 Cross-check of the inclusive hadron, , and cross-sections
In order to understand how well pythia predicts and
, a cross-check was performed indirectly by comparing the
differential cross-sections of inclusive hadrons, , and in
pythia with the CDF measurements CDF; Abulencia:2006ps; cchen:dxec.
The differential cross-section of in pythia (see Fig. 19), for instance, is defined as:
where is the number of in each bin and
is the total number of generated events. The
corresponds to the bin width of each bin, which is the same as that
in CDF; Abulencia:2006ps; cchen:dxec. The discrepancy between the
pythia and the data cross-sections is generally within 10
for hadrons and 50 for hadrons, which is included in the
systematic uncertainty in Section VIII.
Figure 19: The differential cross-sections of (a) inclusive hadrons, (b) ,
and (c) . The upper plot in each figure shows the
differential cross-section for data
(closed circles) CDF; Abulencia:2006ps; cchen:dxec
and pythia (open squares).
The lower plot in each figure shows the data to pythia ratio.
C.2 Cross-check using the signed impact parameter distributions
As an additional cross-check, the signed impact parameter distributions
(signed ) of the baryons with respect to the primary
vertex, in data and the full simulation, are also compared.
The signed impact parameter is defined as ,
where is the charge of the particle and is the distance between the
beam line and the center of the helix describing the track in the transverse
plane. The parameter is the radius of the track helix.
The full simulation includes the signal and feed-in backgrounds, with
relative fractions following the estimates in Section VI.2.
An excess of the signed distribution in the region close to zero would
indicate a significant contribution of the background
in the sample.
Figure 20 shows good agreement between data and simulation,
proving that the promptly produced from is a negligible
contribution to the inclusive semileptonic signals.
Figure 20 also shows the signed distributions of and
.
Figure 20: Comparison of the signed impact parameters between the full simulation and
data for hadrons which are associated with a :
(a) , (b) , and (c) from the .
The good agreement of the full simulation with data indicates that
backgrounds from the promptly produced , , and
are negligible.
References
(1)
N. Cabibbo,
Phys. Rev. Lett. 10, 531 (1963).
(2)
M. Kobayashi and T. Maskawa,
Prog. Theor. Phys. 49, 652 (1973).
(3)
A. V. Manohar and M. B. Wise,
Camb. Monogr. Part. Phys. Nucl. Phys. Cosmol. 10, 1 (2000).
(4)
S. Godfrey and N. Isgur,
Phys. Rev. D 32, 189 (1985).
(5)
N. Isgur, D. Scora, B. Grinstein, and M. B. Wise,
Phys. Rev. D 39, 799 (1989).
(6)
H. Georgi, B. Grinstein, and M. B. Wise,
Phys. Lett. B 252, 456 (1990).
(7)
C. Amsler et al. (Particle Data Group),
Phys. Lett. B 667, 1 (2008).
(8)
Predictions of and are both obtained
by combining the predicted decay widths with the world averages of
and lifetime
ps from the PDG pdg.
(9)
M. Q. Huang, H. Y. Jin, J. G. Korner, and C. Liu,
Phys. Lett. B 629, 27 (2005). In this reference,
the authors calculated .
(10)
A. K. Leibovich, Z. Ligeti, I. W. Stewart, and M. B. Wise,
Phys. Lett. B 586, 337 (2004). In this reference,
the authors calculated .
(11)
H. Y. Cheng,
Phys. Rev. D 56, 2799 (1997). In this reference,
the author calculated .
(12)
T. Affolder et al. (CDF Collaboration),
Phys. Rev. Lett. 84, 1663 (2000).
(13)
D. Acosta et al. (CDF Collaboration),
Phys. Rev. D 71, 032001 (2005).
(14)
The CDF II detector uses a cylindrical coordinate system in which is
the azimuthal angle, is the radius from the nominal beam line, and
points in the proton beam direction, with the origin at the center of
the detector. The transverse , or - plane, is the plane
perpendicular to the axis.
(15)
A. Sill et al.,
Nucl. Instrum. Methods A 447, 1 (2000).
(16)
T. Affolder et al.,
Nucl. Instrum. Methods A 526, 249 (2004).
(17)
The pseudorapidity, , is defined as , where
is the polar angle to the proton beam.
(18)
G. Ascoli et al.,
Nucl. Instrum. Methods A 268, 33 (1988).
(19)
E. J. Thomson et al.,
IEEE Trans. Nucl. Sci. 49, 1063 (2002).
(20)
B. Ashmanskas et al.,
Nucl. Instrum. Methods A 518, 532 (2004).
(21)
The position of the beam line at the second trigger level is
obtained by averaging the detector positions of all the tracks found by
the silicon vertex trigger. The and positions are obtained by fitting
the track impact parameter, , with respect to the detector origin, as a
function of the track azimuthal angle, :
. The fitting is done for each event.
(22)
G. Gomez-Ceballos et al.,
Nucl. Instrum. Methods A 518, 522 (2004).
(23)
The central outer tracker (COT) has 48 axial and 48 stereo sense wire layers.
(24)
A displaced track found by the silicon vertex trigger (SVT) has a
transverse
impact parameter within 120 m– 1000 m and a transverse momentum
greater than 2 .
The transverse impact parameter is computed at the trigger
level using information from the silicon vertex detector (SVX II), while the
transverse momentum is computed by combining the information reconstructed in
the SVX II and in the central outer tracker (COT).
(25)
The matching has one degree of freedom. It is calculated from the
difference between the track and the muon stub positions in the plane
and the expected amount of multiple scattering for a track of given obtained from the geantgeant simulation of CDF detector material.
(26)
The smallness of background is confirmed
independently from the cross-check using the signed impact parameter distributions of the hadrons (Appendix C.2). The uncertainty on
the scale factor for the semileptonic decay model, ,
is % and only affects the relative branching fraction at
the same order of magnitude. The uncertainties on the lifetime, and
polarizations, and Dalitz structure are expected to change the
numerator and the denominator of the relative branching fraction in a
similar way and mostly cancel in the ratio. The CDF I result already
has % uncertainty Affolder:1999iq; the 3% uncertainty from the generator-level MC is relatively insignificant.
(27)
T. Sjostrand et al., Comput. Phys. Commun. 135, 238 (2001).
(28)
The bgenerator is a CDF program which generates a single hadron according to
the input and rapidity spectra.
(29)
D. J. Lange,
Nucl. Instrum. Methods A 462, 152 (2001).
(30)
D. Boutigny et al. (BABAR Collaboration),
SLAC-R-0457, 1995 (unpublished).
(31)
K. Abe et al. (BELLE Collaboration),
Nucl. Instrum. Methods A 479, 117 (2002).
(32)
D. Andrews et al. (CLEO Collaboration),
Nucl. Instrum. Methods 211, 47 (1983).
(33)
H. Albrecht et al. (ARGUS Collaboration),
Nucl. Instrum. Meth. A 275, 1 (1989).
(34)
R. Brun, R. Hagelberg, M. Hansroul, and J.C. Lassalle,
CERN-DD-78-2-REV, 1978 (unpublished).
(35)
The bin-by-bin ratios are derived by taking the ratio of generator-level
histograms from the FF and PHSP simulation samples.
(36)
D. Acosta et al. (CDF Collaboration),
Phys. Rev. Lett. 94, 122001 (2005).
(37)
A. Abulencia et al. (CDF Collaboration),
Phys. Rev. Lett. 98, 122002 (2007);
Y. Le, Ph.D. thesis, Johns Hopkins University, 2003.
(38)
S.-S. Yu, Ph.D. thesis, University of Pennsylvania, 2005,
hep-ex/0504059.
(39)
G. Cowan, Oxford Univ. Press, 1998, ISBN 0198501552.
(40)
D. Acosta et al. (CDF Collaboration),
Phys. Rev. D 68, 091101 (2003).
(41)
K. W. Edwards et al. (CLEO Collaboration),
Phys. Rev. Lett. 74, 3331 (1995).
(42)
H. Albrecht et al. (ARGUS Collaboration),
Phys. Lett. B 402, 207 (1997).
(43)
The uncertainties on the measured branching fractions of -baryon decays are
obtained from the PDG pdg. A 5 uncertainty is assigned to the
estimated branching fractions of those unmeasured decays.
Because the excited baryons decay mainly via the
isospin-conserving strong interaction, their branching fractions can be
inferred from Clebsch-Gordan coefficients. An example of the deviation from
the isospin invariance, in the -meson system, due to additional
electromagnetic decay,
, is found to be of the
branching fraction of the decay.
(44)
The uncertainties on the branching fractions of , ,
, , and include the
uncertainties on the estimated and the measured ratios of
branching fractions. See Section VII for more details.
A 100 uncertainty is assigned to the branching fractions of ,
, , and decays to cover the large
branching fraction uncertainty which arises from the theoretical predictions
using various QCD models Chakraverty:1996sb; Leibovich:1997az; Dosch:1997zx; Cardarelli:1998tq; Guo:2005qa.
(45)
The branching fraction of the decay was measured to be 5.63.1%
by the DELPHI collaboration Abdallah:2003gn. However, given that the
uncertainty is large, the branching fraction is not used in this analysis.
(46)
A. K. Leibovich and I. W. Stewart,
Phys. Rev. D 57, 5620 (1998).
(47)
The contribution of / background may be inferred from
Appendix C; it is expected to be tiny and may be ignored. The
false-muon background is considered. However, this background occurs at the
level of % in both the numerator and denominator
and cancels to first order. If the contribution is ignored in the numerator
or denominator, a 4% fractional uncertainty is still small compared with
the statistical and other systematic uncertainties.
(48)
J. Abdallah et al. (DELPHI Collaboration),
Phys. Lett. B 585, 63 (2004).
(49)
The second uncertainty is conservative since the estimated
is consistent with the
result from Ref. Abdallah:2003gn.
(50)
P. Nason, S. Dawson, and R. K. Ellis,
Nucl. Phys. B 327, 49 (1989).
(51)
C. Peterson, D. Schlatter, I. Schmitt, and P. M. Zerwas,
Phys. Rev. D 27, 105 (1983).
(52)
W. J. Taylor, Ph.D. thesis, University of Toronto, 1999.
(53)
Here, the denominator of kinematic acceptance is the number of events in
which the hadrons have [].
The kinematic requirements include requirements on the , , and
transverse energy of electron, of each daughter track of the hadron,
significance of the decay length and impact parameter of the hadron, and
the four-track invariant mass.
(54)
The ratio of to efficiencies is found to be independent of
when the same requirements are made for both
hadrons yile:lblcpi. Therefore, a comparison of the shapes of
reconstructed distributions is equivalent to a comparison of the shapes
of differential cross-sections .
(55)
T. Aaltonen et al. (CDF Collaboration),
Phys. Rev. D 77, 072003 (2008).
(56)
In Ref. yile:lblcpi, the is reconstructed using
the three-body decay . Therefore,
the branching fraction
is required to extract .
(57)
The PDG calculates
using the ratio of production cross sections, , with the
assumption that the dependence of the and production is the
same. This analysis measures the spectrum to be softer
(more hadrons at lower ) than that of the and estimates the
to be 2.5 times larger than that used by the PDG.
(58)
The uncertainties on the fragmentation fraction and the measured -meson
branching ratios are obtained from the Particle Data Group (PDG) pdg,
while the uncertainties on the unmeasured -meson branching ratios are
assumed to be three times the uncertainties on the closest equivalent measured
decays yile:lblcpi. The unmeasured branching ratios of decays have
asymmetric systematic uncertainties of , yile:lblcpi.
(59)
D. E. Acosta et al. (CDF Collaboration),
Phys. Rev. D 71, 092001 (2005).
(60)
D. Michael, NuMI-NOTE-BEAM-0019, 1994 (unpublished).
(61)
E. M. Aitala et al. (E791 Collaboration),
Phys. Lett. B 471, 449 (2000).
(62)
The PDG uncertainty on the relative branching fraction is dominated
by the following two sources. The uncertainty from the
world average of ,
which is used in the CDF measurement of yile:lblcpi, is
. The
uncertainty from the CDF I measurement of is .
(63)
I. Dunietz,
Phys. Rev. D 58, 094010 (1998).
(64)
P. Migliozzi, G. D’Ambrosio, G. Miele, and P. Santorelli (CHORUS
Collaboration),
Phys. Lett. B 462, 217 (1999).
(65)
The value is used and is derived
assuming .
(66)
Ref. Gibson:2006rt reported , which is consistent
with unity. Ref. Gibson:2006rt also reported , which is consistent
with .
(67)
A 5 uncertainty is assigned to the estimated branching fractions
of the excited -hadron decays while a 100 uncertainty is
assigned to the unobserved -hadron decays to cover the wide range
of theoretical predictions.
(68)
Cheng’s prediction of Cheng:1996cs is not included
for comparison because he uses a non-relativistic quark model (instead of HQET). If his prediction is included, this measurement is still consistent with
the results from theory.
(69)
T. Aaltonen et al. (CDF Collaboration),
Phys. Rev. Lett. 99, 202001 (2007).
(70)
T. Aaltonen et al. (CDF Collaboration),
Phys. Rev. Lett. 99, 052002 (2007).
(71)
The contribution could be cross-checked by using the DØ measurement of
.
Assuming ,
and that the branching fraction and efficiency of are the same as
those of , the contribution of is estimated to be .
(72)
D. Acosta et al. (CDF Collaboration),
Phys. Rev. Lett. 94, 091803 (2005).
(73)
CDF measured pb Acosta:2004uq. Combining the world averages of and , is estimated to be pb. Note that the
dominant electroweak production of quark from the decay will be times smaller () and
is estimated to be pb.
(74)
M. L. Mangano, P. Nason, and G. Ridolfi,
Nucl. Phys. B 373, 295 (1992).
(75)
F. Halzen, W. Y. Keung, and D. M. Scott,
Phys. Rev. D 27, 1631 (1983).
(76)
A. Abulencia et al. (CDF Collaboration),
Phys. Rev. D 75, 012010 (2007).
(77)
Note that simulations for extracting the and the numerator of
Eq. (18) are performed at the generator level. Generator-level
simulations are sufficient because this measurement is only sensitive to the
of background relative to the hadronic signal, not the absolute value.
The results from a generator-level simulation and from a full simulation
differ by only .
Finally, the of the / background is quite
small compared to those of the feed-in and false-muon backgrounds. A
large simulation sample is required to achieve reasonably small
uncertainties. The full simulations are time- and CPU-intensive
and is therefore not used for the estimate of the /
background.
(78)
The CDF measurement Abulencia:2006ps is restricted to the
with greater than 6 and rapidity () less than 1.0. Therefore,
the denominator of the efficiency is the number of events in which
the baryons have and .
(79)
F. Happacher, P. Giromini, and F. Ptohos,
Phys. Rev. D 73, 014026 (2006).
The authors of this reference compare the results of different experiments
as listed in Ref. Tevatron_bb using , the ratio of the
measured to the exact NLO prediction.
These five measurements yield with a 0.8 RMS deviation.
The most recent Tevatron measurement giromini has also found
inconsistency when identifying quarks via secondary vertex
versus via their semileptonic decays.
(80)
F. Abe et al. (CDF Collaboration),
Phys. Rev. D 53, 1051 (1996);
F. Abe et al. (CDF Collaboration),
Phys. Rev. D 55, 2546 (1997);
B. Abbott et al. (DØ Collaboration),
Phys. Lett. B 487, 264 (2000);
D. Acosta et al. (CDF Collaboration),
Phys. Rev. D 69, 072004 (2004);
T. Shears (CDF Collaboration),
PoS HEP2005, 072 (2006).
(81)
T. Aaltonen et al. (CDF Collaboration),
Phys. Rev. D 77, 072004 (2008).
(82)
D. Acosta et al. (CDF Collaboration),
Phys. Rev. Lett. 91, 241804 (2003).
(83)
D. Chakraverty, T. De, B. Dutta-Roy, and K. S. Gupta,
Mod. Phys. Lett. A 12, 195 (1997).
(84)
H. G. Dosch, E. Ferreira, M. Nielsen, and R. Rosenfeld,
Phys. Lett. B 431, 173 (1998).
(85)
F. Cardarelli and S. Simula,
Phys. Rev. D 60, 074018 (1999).
(86)
P. Guo, H. W. Ke, X. Q. Li, C. D. Lu, and Y. M. Wang,
Phys. Rev. D 75, 054017 (2007).