Local control of spin flow in weak magnetic fields
Abstract
We demonstrate that optical illumination strongly influences spin transport in n-type GaAs. Specifically, increasing the power density of optical spin pumping results in a significant expansion of the spin diffusion profile. A further means of manipulation is the application of a weak transverse magnetic field, which strongly increases spin flow out of the excitation spot. These effects are directly monitored in spin imaging experiments and spatially resolved Hanle measurements.
pacs:
72.25.Dc 72.25.Fe 85.75.-d 72.25.RbThe ability to monitor, control and manipulate spin flows in semiconductors is a prerequisite for the functionality of spin-based devices. Because of the spin-selectivity of the selection rules OO , optical spectroscopy has emerged as a powerful tool to locally probe the spin of electrons. Spin diffusion lengths of over ca. in n-GaAs Dzh1 and spin drag over SpinFlow1 enable optical detection of spin injection SpinDrift1 ; SpinDrift2 ; SpinDrift3 ; SpinFlow2 ; SpinInjCross , spin accumulation SpinFlow2 and the spin Hall effect SHE . In this type of experiments, the optical excitation density is kept low in order to minimize a possible perturbation of the spin system, implicitly assuming that using a low optical power density implies that the dilution of the intrinsic electrons in the semiconductor with photo-generated ones can be neglected. Generally, this condition is met when , where is the generation rate (which is proportional to the illumination power density), is the lifetime of the photo-generated carriers and is the concentration of intrinsic electrons. However, for a spin polarized electron system, recombination with photo-generated holes will reduce the spin polarization. This additional effect becomes relevant when , where now is the electron spin relaxation time OO . Therefore, in semiconductors with a very long electron spin memory, i. e., when , this mechanism may lead to enhanced spin decay at quite low pump/probe power densities, and hence should not be neglected a priori. On the plus side, this same mechanism can be used to locally control spin flow even without application of a bias voltage, as we will demonstrate below.
We present results for a Si-doped n-type GaAs layer ( ) of width. It was grown by molecular-beam epitaxy (MBE) on semi-insulating (001) GaAs substrate followed by an undoped 200 nm GaAs buffer, a 5 nm AlAs barrier and an undoped 100 nm GaAs spacer layer. The sample is mounted strain-free and kept at a temperature K. In order to perform optical spin pumping and probing we use a two-color Kerr rotation technique Method_TwoColor . Optical excitation is performed by a solid state laser (785 nm) modulated between and circular polarizations at a frequency of 50 kHz. The net spin polarization along direction is probed using the magneto-optical Kerr effect (MOKE). The photoinduced Kerr rotation of a Ti:sapphire laser (819 nm) which is proportional to the spin polarization () is measured by balanced photodiodes and demodulated by a lock-in amplifier. Scanning Kerr microscopy is used to spatially resolve the net spin polarization SpinFlow1 ; Method_ScanKerr . In this technique, a circularly-polarized pump beam is directed under a angle of incidence to the sample surface. After refraction inside the sample the pump beam generates spins polarized at an angle with respect to the sample normal ( direction). Surface scans in the - plane are performed using a microscope objective (NA = 0.14) mounted on a piezo system. Another microscope objective is used to focus the pump beam.
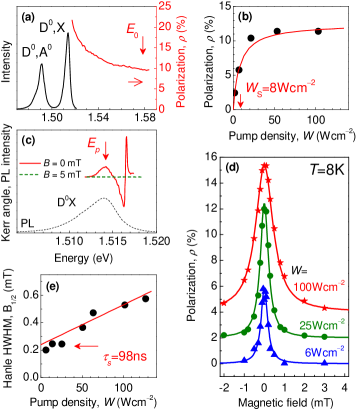
First, we characterize the sample in an excitation configuration where spin diffusion is averaged out (Fig. 1), using two-color Kerr and photoluminescence (PL) measurements. Instead of the microscope objective, we employ two long-focus lenses to provide spot sizes of about , much larger than the typical spin diffusion length. The PL spectrum consists of two bands which we attribute to donor-acceptor () transitions and donor-bound excitonic () recombination [see Fig. 1(a)]. In the same Figure, we plot with the optically induced circular polarization of the PL [detected at () band], as function of the excitation energy. A maximum value of (the theoretical limit is 25% OO ) is achieved for quasi-resonant excitation. The vertical arrow in Fig. 1(a) indicates the pump energy eV which will be used in all further experiments. The PL circular polarization is proportional to the net spin polarization, . Its amplitude depends on pump power; increases linearly for low- and saturates for high pump power density, as shown in Fig. 1(b). This behavior can be well described by OO
| (1) |
using (i.e., ) and a saturation pump power density . The net spin polarization is suppressed in a transverse magnetic field due to the Hanle effect OO . The Hanle curves we obtained for this sample are shown in Fig. 1(d). They are well described by the Lorentzian
| (2) |
Here, is the halfwidth at half maximum (HWHM) of the Hanle curve given by the spin lifetime connected with optical recombination. The Hanle HWHM increases with pump power density as shown in Fig. 1(e). This behavior is well established for n-GaAs OO . Upon increasing , recombination with photogenerated holes provides an additional spin decay channel, resulting in a decrease of the spin lifetime given by Method_TwoColor
| (3) |
Here, defines a characteristic pump power density, and the regime where implies strong spin pumping. In the low power density limit, is equal to the spin relaxation time of electrons , and, using the well-known electron g-factor in GaAs () our Hanle data yield an electron spin lifetime ns [Fig. 1(e)].
The Hanle effect is also clearly observed in MOKE measurements. Figure 1(c) demonstrates the dependence of the Kerr angle on the probe energy in zero magnetic field (solid line). Note that the Kerr angle completely vanishes at mT (in the limit of low pump and probe density, dotted line). In the subsequent experiments, we measure the Kerr angle at a fixed energy of eV (as indicated by the arrow).
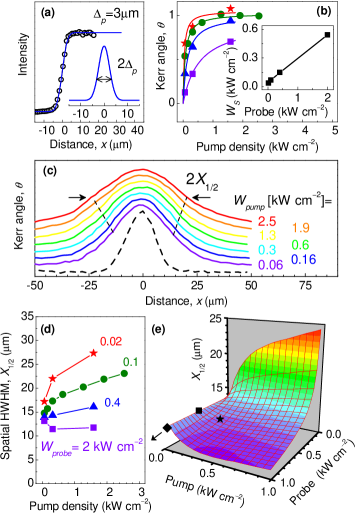
We now describe our results obtained by Kerr microscopy, where the laser beams are focused tight enough to resolve spin diffusion. The spatial resolution of our setup can be inferred from a scan of the transmission of the focused laser beam over a sharp edge, as shown in Fig. 2(a). The derivative of this trace (inset) confirms that the spot profile has the form , with ; we have verified that the profile in the sharp-edge scans is circular. Diffusion of optically injected spins causes the spatial profiles shown in Fig. 2(c). The dotted line in this figure shows the excitation profile as detected by the probe. It corresponds to the convolution of pump and probe spots and yields a net resolution of . The spatial HWHM of the scans in the Figure (and therefore the spin diffusion length ) is not constant, as one might naively anticipate, but rises from 14 for to 23 for . It seems unlikely that the spin relaxation time becomes longer with increasing spin pumping. Hence, we ascribe such a behavior to an increase of the spin diffusion constant . This suggests that optically injected electrons not only provide a local spin source, but also participate in spin transfer over tens of microns. Note that a possible heating effect by light can be ruled out, as we observe a decrease of with rising bath temperature.
This effect is summarized for different probe power densities in Fig. 2(d). As a general trend, the spin diffusion length decreases with increasing probe power density. In order to examine the origin of such a behavior, we plot in Fig. 2(b) the Kerr rotation at the excitation point () as function of pump power density for several probe power densities. These dependencies are well fitted by Eq. (1), where the fitting procedure reveals that also the saturation pump power density depends on the probe power density, following a linear increase [see inset of Fig. 2(b)]. This makes intuitive sense: the faster the spin decay, the stronger spin pumping is required to achieve saturation. The probe beam generates holes, introducing an additional spin decay channel. The efficiency of this channel scales with the ratio of the spin relaxation time and the electron-hole recombination time, and it obviously is efficient even at moderate power density. As a consequence, the spin polarization is destroyed and the spin diffusion is suppressed for increasing probe power density. The overall dependence of the spin diffusion process on the pump and probe power density is summarized in Fig. 2(e). In this plot we have included the actual experimental conditions from various recent papers, labeled by symbols. While the influence of the power level used in these works is not very significant, these data have not been taken in the true low perturbation regime.
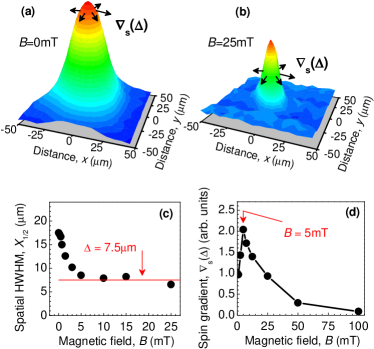
We now demonstrate how the above effect in combination with weak magnetic fields can be used to locally manipulate the spin flow around the excitation spot. A 2D spatial scan in the regime of strong spin pumping ( ) is shown in Fig. 3(a) for zero magnetic field. In order to minimize the influence of the probe light, its power density is reduced to . When an external magnetic field is applied in the sample plane, the spatial spin distribution changes drastically [Fig. 3(b)]. As clearly seen in Fig. 3(c), the HWHM of the spatial profile decreases with increasing magnetic field and saturates for mT at the resolution limit of resulting from the finite sizes of pump and probe spots.
Obviously, also the spin gradient in Fig. 3 depends on the in-plane magnetic field. We now concentrate on the spin gradient at the point . It has a precise physical meaning: is proportional to the spin flow emanating from the injection point due to the diffusion process. Hence, we plot in Fig. 3(d) obtained at as function of the magnetic field. The data are normalized by their value in zero field. The spin gradient shows a non-monotonic behavior. For small magnetic fields it increases until its value has doubled, then it decreases towards zero in stronger fields. The maximum is achieved at mT. This implies that the spin flow from the injection area is enhanced in weak in-plane magnetic fields.
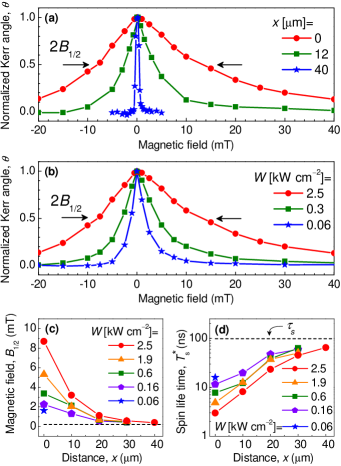
In order to understand the origin of this effect, we have taken Hanle curves at various positions in the diffusion profile. These data are shown in Fig. 4(a). The small asymmetry of these curves results from the orientation of the optically generated spins under an angle with respect to the sample normal (-axis). At the generation point a much higher magnetic field ( mT) is required to suppress the spin polarization than in more distant locations ( mT at and mT at ). This strong spatial dependence of the spin lifetime actually scales with illumination power density. As shown in Fig. 4(b), when the pump power density decreases from to the width of the local Hanle curves detected at also reduces from mT to mT.
The spatial dependencies of for different pump power densities are summarized in Fig. 4(c). Remarkably, when the detection point is far away from the injection point (for ), is nearly independent of the pump power and tends towards mT, as obtained for low pump power densities in Fig. 1(e), where spin diffusion can be neglected.
The experimental results of Fig. 4(c) can be interpreted in terms of an apparent spin lifetime . While the Hanle curves in the diffusive regime are not described by the Lorentzian of Eq. (2) OO ; Dzh1 , also in this limit the width of the Hanle curves scales with the inverse of the spin lifetime SD_theory . Hence, we evaluate this apparent spin lifetime using . The values thus obtained are plotted in Fig. 4(d) as a function of the distance for different pump power densities. These data clearly demonstrate that illumination induces a spatial variation of the spin lifetime.
Based on the results of Fig. 4 we propose the following physical explanation for the increase of spin flow at low magnetic field presented in Fig. 3(d): In zero field the optically generated spins diffuse away to a distance of the order of the spin diffusion length , resulting in a spin gradient . Outside of the injection area, photo-generated holes are absent and the spin lifetime entering Eq. (3) is equal to the electron spin relaxation time, . Therefore, in relatively weak magnetic fields ( mT) the net spin polarization is completely suppressed in this region. Quite the opposite situation prevails inside the injection area when the condition of strong spin pumping () is fulfilled. In this case and much higher magnetic fields are required to suppress the net spin polarization. As a result, the spin gradient increases in weak magnetic fields according to . The enhancement factor can be estimated at . In sufficiently strong magnetic fields the spin polarization inside the injection area is also suppressed () and the spin gradient decreases to zero. For low pump power densities () according to Eq. (3) and the spin gradient decreases spatially uniformly with increasing magnetic field, and the effect disappears.
Summarizing, we used scanning Kerr microscopy to reveal a strong influence of pump and probe on spin transport at the power levels which are frequently assumed to satisfy weak spin pumping conditions. We demonstrate that optical illumination induces spatial variations of the spin lifetime, which in turn can be used to locally control the spin flow when combined with a weak magnetic field. We have shown that the effect can be successfully harnessed to offer a novel possibility to manipulate spin currents.
The authors thank T. Kiessling for valuable discussions. This research was supported by the DFG (SPP 1285).
References
- (1) Optical Orientation, edited by F. Meyer and B. P. Zakharchenya (North-Holland, Amsterdam, 1984).
- (2) R. I. Dzhioev et al., Phys. Solid State 39, 1765 (1997).
- (3) S. A. Crooker and D. L. Smith, Phys. Rev. Lett. 94, 236601 (2005).
- (4) M. Oestreich et al., Appl.Phys. Lett. 74, 1251 (1999).
- (5) R. Fiederling et al., Nature 402, 787 (1999).
- (6) Y. Ohno et al., Nature 402,790 (1999).
- (7) S. A. Crooker et al., Science 309, 2191 (2005).
- (8) P. Kotissek et al. Nature Phys. 3, 872 (2005)
- (9) Y. K. Kato, R. C. Myers, A. C. Gossard, and D. D. Awschalom, Science 306, 1910 (2004).
- (10) H. Hoffmann et al., Phys. Rev. B 74, 073407 (2006).
- (11) S. A. Crooker et al., J. Appl. Phys. 101, 081716 (2007).
- (12) M. I. Dyakonov and V. I. Perel, Fiz. Tekhn. Poluprovodn. 10, 350 (1976).