Broad Absorption Line Quasar catalogues with Supervised Neural Networks
Abstract
We have applied a Learning Vector Quantization (LVQ) algorithm to SDSS DR5 quasar spectra in order to create a large catalogue of broad absorption line quasars (BALQSOs). We first discuss the problems with BALQSO catalogues constructed using the conventional balnicity and/or absorption indices (BI and AI), and then describe the supervised LVQ network we have trained to recognise BALQSOs. The resulting BALQSO catalogue should be substantially more robust and complete than BI- or AI-based ones.
Keywords:
surveys, catalogues, neural networks, quasars: broad absorption line:
95.75.Pq, 95.85.Ls, 95.80.+p1 Introduction
Broad absorption line quasars (BALQSOs) are a sub-class of active galactic nuclei (AGN) exhibiting strong, broad and blue-shifted spectroscopic absorption features (foltz90 ; weymann91 ; reichard03b ; hewett03 ) associated with strong winds of outflowing material reaching 0.1-0.2 korista92 . BALQSOs are predominantly radio-quiet (stocke92 ), and there are subtle differences between their continuum and emission line properties and those of “normal” (non-BAL) QSOs (reichard03b ). However, despite these differences, BALQSOs and non-BALQSOs appear to be drawn from the same parent population (reichard03b ).
The most straightforward explanation for the differences between QSOs and BALQSOs is a simple orientation effect. Thus all QSOs may undergo significant mass loss through winds, but BALs are only observed if the central continuum and/or emission line source is viewed directly through the outflowing material. Viewed in this context, BALQSOs may be the only available tracers of a key physical process common to all AGN. Moreover, the fraction of QSOs displaying BAL features () may provide a direct estimate of the opening angle of these outflows.
Historically, most BALQSO samples were selected on the basis of the so-called balnicity index (BI; weymann91 ) or similar metrics. These samples consistently yielded BALQSO fraction estimates in the range (weymann91 ; Tolea ; hewett03 ; reichard03a ). In a previous paper (knigge08 ; Paper I), we showed that the BI and a recently defined metric, the absorption index (AI; trump06 ), are to strict or relaxed respectively when selecting BALQSOs.
Here we will use the hybrid-LVQ approach from Paper I using a combination of the classic BI, a simple neural network and visual inspection to produce BALQSO samples that are more robust than AI-based ones, but more complete than purely BI-based ones using the QSO sample associated with Data Release 5 (DR5) of the Sloan Digital Sky Survey (SDSS; BIG_dr5 ; dr5 ). Our catalogue contains 3505 BALQSOs selected from 28,421 objects in the SDSS DR5 QSO sample in the redshift range .
2 The Input QSO Sample
The SDSS DR5 QSO catalogue contains over 77,000 objects in total dr5 . However, for the purpose of constructing a uniform BALQSO catalogue, we only consider objects whose spectra fully cover the C iv 1550 Å resonance line, which displays a particularly deep and well-defined absorption through in the spectra of most BALQSOs. Given the wavelength range covered by the SDSS spectra, this implies an effective redshift window of for our QSO parent sample, which contains spectra of 28,421 objects.
Our BALQSO classification method works on continuum-normalised spectra covering the wavelength range 1401 - 1700 Å with 1 Å dispersion. It also uses the associated BIs for training the neural network and to flag borderline cases requiring visual inspection. We therefore normalise all QSO spectra using the method described in knigge08 ; north06 , in which each spectrum is fit with a modified DR5 QSO composite allowing for object-to-object differences in reddening and overall spectral slope vanden01 . We then interpolate each spectrum onto the new wavelength grid and estimate the BI in the same way as weymann91 .
3 Hybrid-LVQ Selection of BALQSOs
The method we use to classify BALQSOs has already been described in detail in knigge08 , so we only provide an overview of the key points here. Briefly, our method is a hybrid of BI-based, neural network and visual classifications. It is designed to produce a more complete BALQSO sample than a pure BI selection without significantly increasing the number of false positives. Starting with a BI-based classification, we use a simple neural network-based machine learning algorithm called “learning vector quantization” (LVQ, kohonen01 ) to identify objects that might have been misclassified by the BI. All such objects are then inspected and classified visually. The way in which we train our LVQ network to recognize BALQSOs has been described in detail in Paper I. Note that redshift uncertainties are explicitly taken into account by our network. Below, we will sometimes refer to the full hybrid method as “LVQ-based”, but it is always worth keeping in mind that LVQ is only one part of a process also involving the BI and visual inspection.
4 Properties of the Final BALQSO Catalogue
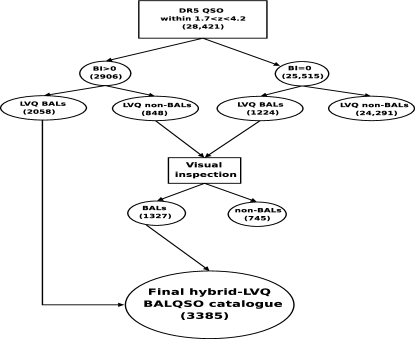
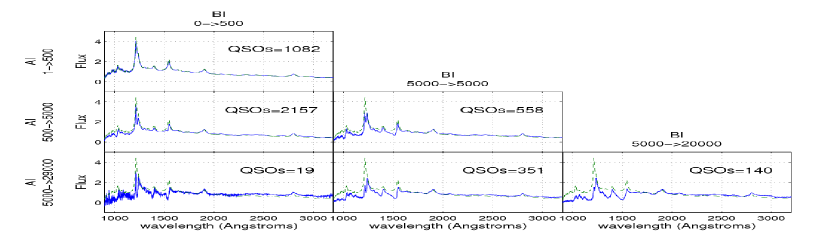
Fig. 1 shows a flow diagram of the steps involved in creating the final DR5 BALQSO catalogue using the hybrid-LVQ network. Our LVQ-based method classifies 3,385 of the 28,421 QSOs () in our DR5 parent sample as BALQSOs and the catalogue can be found online111http://www.astro.soton.ac.uk/simo. It is reassuring to note that the LVQ classifications and the BI ones tend to agree for over of the objects. The ones which the methods disagree on are visually inspected for their classifications. Overall we find that of the objects require visual inspection (848), whilst only (1224) of the do. At first one might think that this is quite a high fraction for the objects. Fig. 2 shows composites in various AI and BI bins. The top-left panel in the figure shows a composite made from 1082 objects with and . For comparison a composite produced with and has been overplotted with the dashed line. No signs of absorption are present, showing that QSOs with a are not necessarily BALs (for more examples see knigge08 ). The other panels in Fig. 2 show composites created for higher and . The composite containing the most QSOs is the middle-left, which could also be considered as being the region in AI-BI space including the most borderline cases. This again helps explain the high fraction of objects which the BI and LVQ disagree.
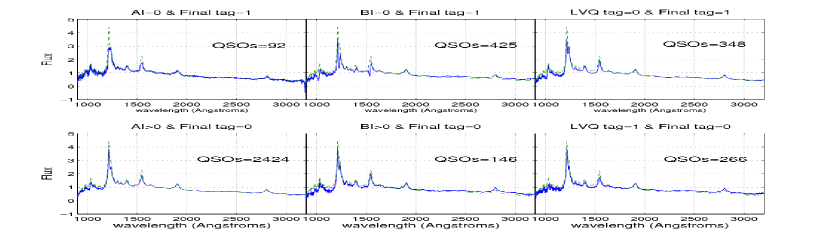
In order to explore our results in more detail we present the composites in Fig. 3. The top row of panels show composites produced with QSOs which were finally tagged as BALQSOs, whilst the bottom row with non-BALQSO objects. As expected the top-centre composite displays a very narrow absorption, which will be missed by the BI calculation due to it’s conservative definition. Next we consider the bottom-centre panel displaying the composite of objects with but a non-BALQSO final tag. The spectrum is redder compared to the non-BALQSO composite, but has no clear signs of line absorption.
5 Conclusions
Compiling BAL quasar catalogues and determining the observed BALQSO fraction is a challenging task. Most of the problem resides in the ambiguity one encounters when attempting to classify individual absorption features. After all, it is in the human nature to be subjective, even if one tries the opposite. The judgment will be based on previous examples of what is and what is not a BAL. This is why we have used a hybrid method consisting of a simplified neural network together with visual inspection to create a hopefully near-optimal BALQSO catalogue.
In knigge08 and this work we have shed light on many classification problems when dealing with BALQSOs taken from contemporary surveys. We showed that when the recently introduced “absorption index” (AI) is used to classify BALQSOs, the resulting log AI distribution is clearly bimodal. Both modes containing comparable amount of objects, but only the high-AI mode clearly being associated with genuine BALQSOs. Moreover, in our previous paper, we showed how even the traditional “balnicity index” (BI) produces incomplete BALQSO samples. It is likely that due to the diverse nature of observed BAL throughs, conventional metrics are no longer appropriate given the large data volume increase in observed QSO samples. Also it seems even more unfeasible to define new metrics in order to deal with problems caused by the old ones. Here we have shown how a hybrid algorithm can overcome these problems, taking into account the increasing data volume gathered by contemporary astronomical surveys.
The observed fraction is, however, still subject to serious selection effects. In knigge08 we have explored these and corrected for colour-, magnitude- and redshift-dependent selection biases on the DR3 dataset. After applying the corrections we reached the conclusion that there is no compelling evidence for redshift evolution in the intrinsic BALQSO fraction.
References
- (1) C. B. Foltz et al., “The Third IBIS/ISGRI Soft Gamma-Ray Survey Catalog”, Bulletin of the American Astronomical Society, 22, pp. 806 (1990)
- (2) R. J. Weymann et al., “Continuum and Emission-Line Properties of Broad Absorption Line Quasars”, The Astrophysical Journal, 373, pp. 23–53 (1991)
- (3) T. A. Reichard et al., “Comparisons of the emission-line and continuum properties of broad absorption line and normal quasi-stellar objects”, The Astronomical Journal, 126, pp. 2594–2607 (2003)
- (4) P. C. Hewett and C. B. Foltz., “The Frequency and Radio Properties of Broad Absorption Line Quasars”, The Astronomical Journal, 125, pp. 1784–1794 (2003)
- (5) K. T. Korista et al., “Hubble Space Telescope Faint Object Spectrograph and ground-based observations of the broad absorption line quasar 0226-1024”, The Astrophysical Journal, 401, pp. 529–542 (1992)
- (6) J. T. Stocke et al., “The radio properties of the broad-absorption-line QSOs”, The Astrophysical Journal, 396, pp. 487-503 (1992)
- (7) A. Tolea et al., “Broad Absorption Line Quasars in the Early Data Release from the Sloan Digital Sky Survey”, The Astrophysical Journal, 578, pp. 31–35 (2002)
- (8) T. A. Reichard et al., “A Catalog of Broad Absorption Line Quasars from the Sloan Digital Sky Survey Early Data Release”, The Astronomical Journal, 125, pp. 1711–1728 (2003)
- (9) C. Knigge et al., “The Intrinsic Fraction of Broad Absorption Line Quasars”, Monthly Notices of the Royal Astronomical Society, 386, pp. 1426–1435 (2008)
- (10) J. R. Trump et al., “A Catalog of Broad Absorption Line Quasars from the Sloan Digital Sky Survey Third Data Release”, The Astrophysical Journal Supplement Series, 165, pp. 1–18 (2006)
- (11) J. K. Adelman-McCarthy et al., “The Fifth Data Release of the Sloan Digital Sky Survey”, The Astrophysical Journal Supplement Series, 172, pp. 634–644 (2007)
- (12) D. P. Schneider et al., “The Sloan Digital Sky Survey Quasar Catalog. IV. Fifth Data Release”, The Astronomical Journal, 134, pp. 102–117 (2007)
- (13) M. North et al., “A new sample of broad absorption-line quasars exhibiting the ghost of Lyman ”, Monthly Notices of the Royal Astronomical Society, 365, pp. 1057–1066 (2006)
- (14) D. E. Vanden Berk et al., “Composite Quasar Spectra from the Sloan Digital Sky Survey”, The Astronomical Journal, 122, pp. 549–564 (2001)
- (15) T. Kohonen, “Self-organizing maps”, Springer series in information sciences, Berlin, Germany, 2001