Ultra High Energy Cosmic Rays from earth-based observatories
Sergio Petrera
INFN and Physics Department, L’Aquila University
I-67010 L’Aquila, ITALY
1 Introduction
The origin of the highest energy cosmic rays is one of the most exciting questions of astroparticle physics. Even though a general concept linking magnetic field and size of possible sources (the so called “Hillas plot” [1]) is the basis of our current understanding, up to now there are no generally accepted source candidates known to be able to produce particles of such extreme energies.
At these energies cosmic rays are expected to exhibit a suppression in the energy spectrum because of their interaction with the microwave background radiation (CMB). This feature, known as the Greisen-Zatsepin-Kuz’min (GZK) effect [2], is at about eV for protons. It limits the horizon from which these particles can be observed to a distance below about 100 Mpc (depending on the primary mass). The non-observation of the GZK effect in the data of the AGASA experiment [3] has motivated several theoretical and phenomenological models trying to explain the absence of the GZK effect. More recently both HiRes [4] and Auger [5] have shown evidence of a suppression such as expected from the GZK effect with high statistical significance. The recent observation of directional correlations of the most energetic Auger events with the positions of nearby Active Galactic Nuclei [6] complements the observation of the GZK effect very nicely.
Mass composition is another important key to discriminate among different models about the origin of high-energy cosmic rays. Such measurements are difficult due to their strong dependence on hadronic interaction models. Only primary photons can be discriminated safely from protons and nuclei and recent upper limits to their flux largely constrain existing top-down models.
In this paper, prepared for the Physics in Collisions 2008 Conference, each of these topics are exposed and reviewed.
2 UHECR Experiments
In the UHE region two detection methods are effective for extensive air showers (EAS): arrays of surface detectors and air fluorescence detectors. A comprehensive review of these experimental methods can be found in [7]. In this Section recent experiments dedicated to the detection of cosmic rays are briefly described.
AGASA. The Akeno Giant Air Shower Array, located in Japan at the latitude of about 35∘ N and altitude of 900 m above sea level was in operation from 1990 until 2004. It was a large surface array [8], designed to measure the front of the cosmic ray showers as they reach ground. The array consisted of 111 plastic scintillators with size of 2.2 m2 deployed with separation of 1 km and covering an area of 100 km2. The array was complemented by 27 muon detectors consisting of proportional counters placed below absorbers.
HiRes. It is the new and sophisticated version of the pioneering Fly’s Eye instrument of the Utah group based on the detection of the fluorescence light from the nitrogen molecules excited by the charged particles of the cosmic ray showers. It was in operation from 1997 until 2006. The HiRes instrument [9] consists of two sites 12.6 km apart located at Dugway in Utah (USA) hosting 22 telescopes at HiRes I and 42 at HiRes II. The telescopes cover the full 360∘ azimuth and in elevation from 3∘ up to 17∘ (HiRes I) and from 3∘ up to 31∘ (HiRes II). The main components of each telescope are a spherical mirror of about 4 m2 size and an array of 256 photomultipliers as sensitive element. UV filters to cut light outside the 300-400 nm interval of the nitrogen fluorescence were also used.
Auger. Two observatories, one in the Northern and one in the Southern hemisphere are foreseen for the Pierre Auger Observatory project, to achieve a full exploration of the sky. The Southern Auger Observatory [10] is located near the small town of Malargüe in the province of Mendoza (Argentina) at the latitude of about 35∘ S and altitude of 1400 above see level. The Observatory is a hybrid system, a combination of a large surface array and a fluorescence detector. The surface detector (SD) is a large array of 1600 water Cherenkov counters spaced at a distance of 1.5 km and covering a total area of 3000 km2. Each counter is a plastic tank of cylindrical shape with size 10 m m filled with purified water. The SD tanks activated by the event record the particle number and the time of arrival. From the times, the direction of each event is determined with an accuracy of about 1∘. The fluorescence detector (FD) consists of 24 telescopes located in four stations which are built on the top of small elevations on the perimeter of the site. The telescopes measure the shower development in the air by observing the fluorescence light. Each telescope has a 12 m2 spherical mirror with curvature radius of 3.4 m and a camera with 440 photomultipliers. The field of view of each telescope is 30. UV filters were used as in HiRes. The Southern Auger Observatory started to collect data in 2004. The Observatory and has been completed in Summer 2008. The Northern Auger Observatory which is now being designed will be located in Colorado (USA). We note that the present Auger Observatory is the only detector exploring the Southern hemisphere.
Telescope Array (TA). It is being built by a US - Japan - Korea collaboration in Millard County, Utah, USA. Like the Auger Observatory, the TA is a hybrid detector [11]. It covers an area of 860 km2 and comprises 576 scintillator stations and three FD sites on a triangle with about 35 km separation each equipped with 12 fluorescence telescopes.
Fig. 1 shows a comparison of the exposures accumulated by various experiments at the end of 2007. More details about the exposure calculations can be found in [12, 13]. It can be seen that the largest exposure has been achieved with the Auger Observatory and it will continue to deliver more than about 7000 km2 sr for each year of operation. TA is not shown in the figure since it started full operation since March 2008.
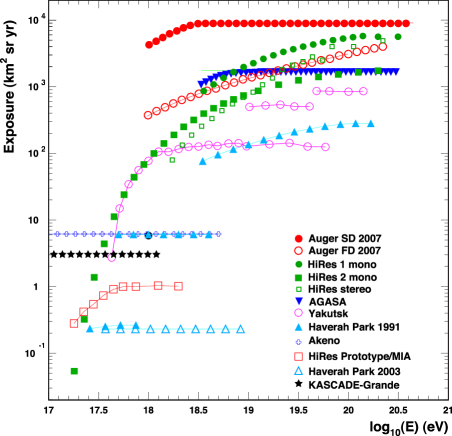
It is important to notice the different behaviour with energy of the apertures for arrays of surface detectors and fluorescence detectors. In case of arrays of detectors with a regular pattern, the aperture can be calculated in a straight forward and model independent way, once the energy threshold for CR detection and reconstruction is exceeded. The situation is different for fluorescence telescopes. Here, the maximum distance out to which showers can be observed increases with increasing fluorescence light and thereby increasing energy. This condition makes the aperture calculation dependent on Monte Carlo simulation and then on primary mass and on the hadronic interaction models employed. This dependence can be considerably reduced by applying quality cuts to geometry parameters (e.g. the distance of the shower), but this is possible only if geometry is well determined as in the cases of hybrid or stereo detection.
3 The Energy Spectrum
Most of the energy spectrum data available today111 Spectrum data from instruments with exposure less than 1000 km2 sr yr have not been considered in this review. at UHE are provided by AGASA, HiRes and Auger (see Fig. 2). The two last experiments recently published spectrum analyses [4, 5] showing evidence of a flux suppression as expected by the GZK effect with significances of about 5 and 6 respectively at slightly different energies (5.6 and 4 eV). Shifting the energy scale by about +15% for Auger and about -25% for AGASA with respect to HiRes the three spectra agree rather well up to about 5 eV. At higher energies the AGASA data do not exhibit any flux suppression and thus are inconsistent with the other data.
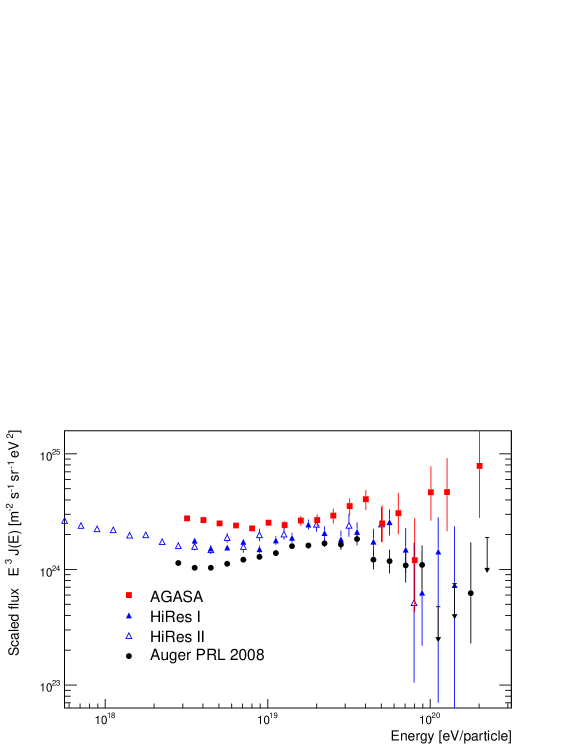
Typical uncertainties of the energy scale are on the order of 20 25%. Ground arrays like AGASA rely entirely on EAS simulations with their uncertainties originating from the limited knowledge of hadronic interactions. Fluorescence telescopes, such as operated by HiRes and Auger, observe the longitudinal shower development in the atmosphere. In this way, the atmosphere is employed as a homogenous calorimeter. Nonetheless possible differences in their energy recostruction are still present because of different assumptions (e.g. fluorescence yield, event reconstruction, analysis cuts).
Even though the Auger spectrum in [5] is based on surface data, the energy calibration is quite new. In fact the method used by Auger to measure the energy spectrum exploits the hybrid nature of the experiment with the aim of using the data itself rather than simulations. For each event the tanks of the SD measure the particle density expressed in units of VEM (Vertical Equivalent Muons) and the times of arrival which are used to determine the axis of the shower. The dependence of the particle density on the distance from the shower axis is fitted by a lateral distribution function (LDF). The LDF fit allows determining the particle density S(1000), expressed in units of VEM, at the distance of 1000 m from the axis. This quantity is a good energy estimator [14] in the sense that it is strongly correlated with the energy of the cosmic ray and almost independent of the mass. The energy estimator S(1000) depends on the zenith angle because of the atmosphere attenuation. The value of S(1000) corresponding to the median zenith angle of 38∘ (S38) is used as reference and the zenith angle dependence of the energy estimator is determined assuming that the arrival directions are isotropically distributed. This procedure is traditionally called Constant Intensity Cut.
| \begin{overpic}[width=164.77771pt]{figures/figure1.eps} \put(13.8,50.5){\includegraphics[width=78.04842pt,clip={}]{figures/figure2.eps}} \end{overpic} | 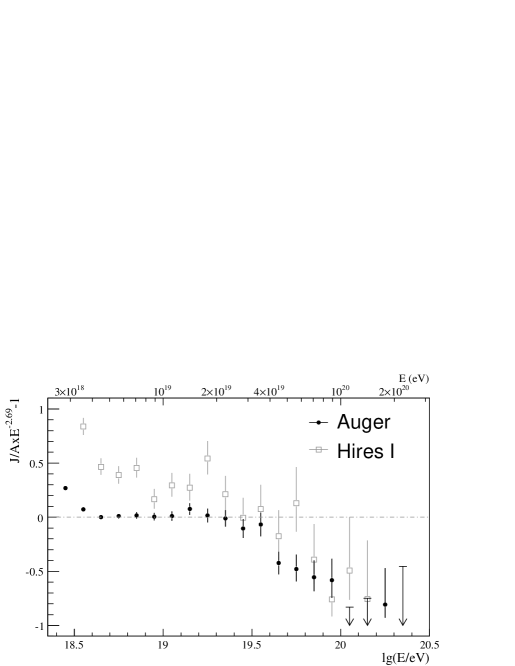 |
The absolute calibration of S38 is derived from the hybrid events using the calorimetric energy measured by the FD which is then corrected for the missing energy using the mean value between proton and iron (uncertainty about 4% at 1019 eV). This absolute calibration, which defines the energy scale, is at present affected by a systematic error of about 20%, mainly due to uncertainties on the fluorescence yield and on the calibration of the FD telescopes. The energy calibration, obtained from the subset of hybrid events (see Fig. 3) is then used for the full set of events with higher statistics measured by the SD.
The flux suppression in Auger and HiRes as well as the possible difference in their energy scales is evident when plotting the fractional difference with respect to a power law spectrum. Fig. 3, right panel, shows this fact for a spectral index of 2.69 which is the one fitted by Auger below 4 eV.
4 Primary Composition
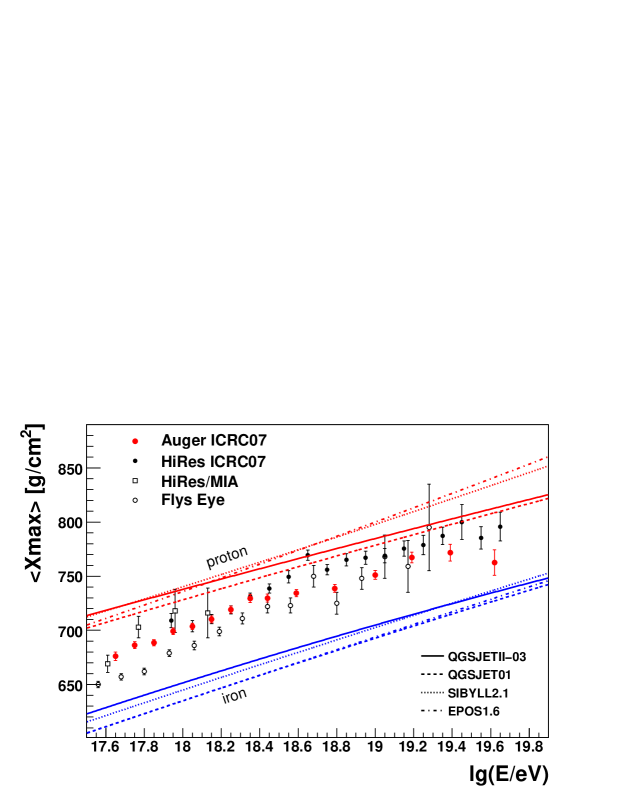
Measuring the composition of cosmic rays is crucial to obtain a full understanding of their acceleration processes, propagation and relation with galactic particles. The atmospheric depth denotes the longitudinal position of the shower maximum, which is directly accessible with the FD. It grows logarithmically with the energy of the primary particle. The behaviour of for different primary particles like photons, protons and heavier nuclei can be conceptually understood in the framework of the Heitler and superposition models [15], which provides good agreement with detailed Monte Carlo simulations. New results based on HiRes-Stereo and Auger hybrid data at the ICRC [16, 17] are reported in Fig. 4. Both data sets agree very well up to eV but differ slightly at higher energies. The differences between the two experiments are within the differences observed between p- and Fe-predictions for different hadronic interaction models. With these caveat kept in mind, both experiments observe an increasingly lighter composition towards the ankle. At higher energies, the HiRes measurement yields a lighter composition than Auger.
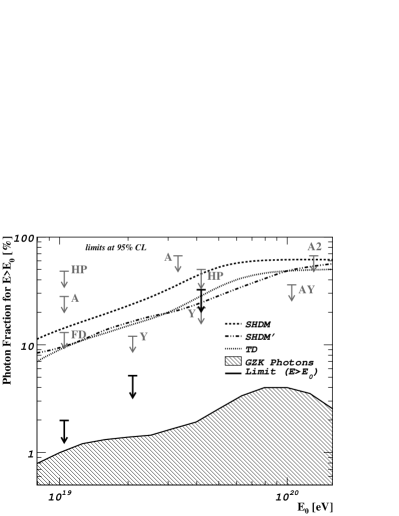
Another important issue concerning the primary composition is the search for photons and neutrinos in EAS. The Auger Observatory has set new photon limits with both the hybrid and SD detection methods [18, 19]. The new limits are compared to previous results and to theoretical predictions in Fig. 5 for the photon fraction. In terms of the photon fraction, the current bound at 10 EeV approaches the percent level while previous bounds were at the 10 percent level. A discovery of a substantial photon flux could have been interpreted as a signature of top-down (TD) models. In turn, the experimental limits now put strong constraints on these models. For instance, certain SHDM (Super Heavy Dark Matter) or TD models discussed in the literature [20] predict fluxes that exceed the limits by a factor 10.
 |
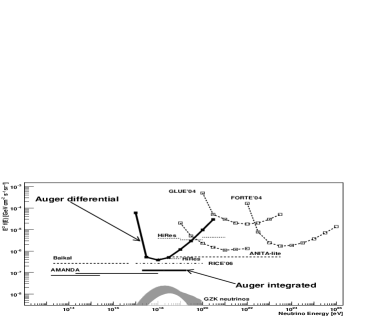 |
Neutrino induced showers can be also identified if they occur deep in the atmosphere under large zenith angles, or by their special topology in the case of Earth-skimming tau neutrinos. Identification criteria have been developed to find EAS that are generated by tau neutrinos emerging from the Earth. Auger has searched for tau neutrinos in the data collected up to August 2007. No candidates have been found and an upper limit on the diffuse tau neutrino flux has been set. In Fig. 5 this result [21] is shown.
5 Arrival Directions
Most of the recent results are from the Auger Collaboration who have started a detailed investigation of the angular directions of the cosmic rays. While no excess has been found from the Galactic Centre in the EeV energy range, evidence for anisotropy has been found in the extreme energy region.
Observation of an excess from the region of the Galactic Centre in the EeV energy region were reported by AGASA [22] and SUGAR [23]. The Auger Observatory is suitable for this study because the Galactic Centre (constellation of Sagittarius) lies well in the field of view of the experiment. The angular resolution of the SD of Auger depends on the number of tanks activated by the shower and it is better than one degree at high-energy. However, with statistics much greater than previous data, the Auger search [24] does not show abnormally over-dense regions around the GC.
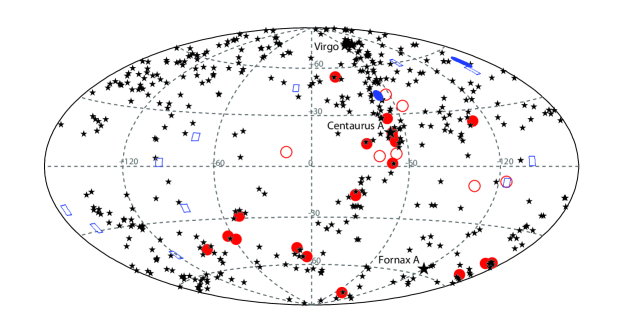
A big step towards the discovery of the UHECR sources has been recently made by the Pierre Auger Collaboration [6, 25]. The highest energy events recorded so far were scanned for correlations with relatively nearby AGNs ( corresponding to Mpc) listed in the Véron-Cetty/Véron catalogue [27]. AGNs where used only up to a maximal redshift , which was a free parameter in the correlation scan. Two other free parameters were the minimal energy of the cosmic ray events Ethr and the maximum separation between reconstructed cosmic ray direction and the AGN position . The scan was performed over data taken during the first two years of stable operation (01/2004 - 05/2006) and a significant minimum of the chance probability calculated assuming isotropic arrival directions was observed. After the parameters of this explorative scan (, E, ) were fixed, the consecutive data set (06/2006-08/2007) was used to verify the correlation signal and the hypothesis of an isotropic source distribution could be rejected at more then 99% confidence level. A sky map of the events above the energy threshold of E together with the selected AGN is shown in Fig. 6. Also shown are the events selected during a follow-up analysis of stereo data from the HiRes Collaboration [26], which do not show a significant correlation.
The interpretation of the observed anisotropy is ongoing and a much larger event statistics will be needed to investigate, for example, whether the AGNs act only as tracers for the underlying true sources and whether the angular separation between AGN and UHECR can be related to magnetic deflections.
6 Conclusion and outlook
In recent years UHECRs have shown a variety of exciting features: the flux suppression at energies as the one expected for the GZK cutoff and possible correlations with sources are the most attactive. The two phenomena are strictly related one to each other. In particular the correlation scenario is compatible with suitable spectrum shapes and mass compositions in the GZK region. This because cosmic ray propagation through galactic fields and their interactions with the photon background affect not only directions, but also the energy and type of particles observed on Earth.
Coming years are expected to be fruitful. New data will come from the Northern Hemisphere: Telescope Array, now, and Auger North, in a few years, will join this fascinating exploration.
References
- [1] A. M. Hillas, Annu. Rev. Astron. Astrophys., 22, 425 (1984).
- [2] K. Greisen, Phys. Rev. Lett. 16, 748 (1966) and G.T. Zatsepin and V.A. Kuz’min, Sov. Phys. JETP Lett. (Engl. Transl.), 4, 78 (1966).
- [3] M. Takeda et al. [AGASA Collaboration], Astropart. Phys. 19, 447 (2003).
- [4] R.U. Abbasi et al. [HiRes Collaboration], Phys. Rev. Lett. 100, 101101 (2008).
- [5] J. Abraham et al. [Pierre Auger Collaboration], Phys. Rev. Lett. 101, 061101 (2008).
- [6] J. Abraham et al. [Pierre Auger Collaboration], Science 318, 938 (2007).
- [7] M. Nagano and A. A. Watson, Rev. Mod. Phys. 72, 689 (2000).
- [8] N. Chiba et al., Nucl. Instrum. Meth., A311, 338 (1992).
- [9] T. Abu-Zayyad et al., Nucl. Instrum. Meth. A450, 253 (2000).
- [10] J. Abraham et al., Nucl. Instrum. Meth. A523, 50 (2004).
- [11] M. Fukushima et al. [Telescope Array Collaboration], Proc. 30th ICRC, Mérida, p. 955 (2007).
- [12] K.-H. Kampert, J. Phys. Conf. Ser., 120, 062002 (2008).
- [13] D. G. Bergman and J. W. Belz, J. Phys. G, 34 R359 (2007).
- [14] D. Newton et al., Astropart. Phys. 26, 414 (2007).
- [15] J. Matthews, Astropart. Phys. 22, 387 (2005)
- [16] Y. Fedorova et al. [HiRes Collaboration], Proc. 30th ICRC, Mérida, p.1236 (2007).
- [17] M. Unger et al. [Pierre Auger Collaboration], Proc. 30th ICRC, Mérida, p.594 (2007).
- [18] J. Abraham et al. [Pierre Auger Collaboration], Astropart. Phys. 27, 155 (2007)
- [19] J. Abraham et al. [Pierre Auger Collaboration], Astropart. Phys. 29, 243 (2008).
- [20] References to theoretical models can be found e.g. in [19].
- [21] J. Abraham et al. [Pierre Auger Collaboration], Phys. Rev. Lett. 100, 211101 (2008).
- [22] M. Teshima et al., Proc. 27th ICRC, Hamburg, vol. 1, p. 337 (2001).
- [23] J.A. Bellido et al., Astropart. Phys. 15, 167 (2001).
- [24] J. Abraham et al. [Pierre Auger Collaboration], Astropart. Phys. 27, 244 (2007).
- [25] J. Abraham et al. [Pierre Auger Collaboration], Astropart. Phys. 29, 288 (2008).
- [26] R.U. Abbasi et al. [HiRes Collaboration], arXiv eprints: 0804.0382v1 (2008).
- [27] M.-P. Véron-Cetty, P. Véron, Astron. Astrophys. 455, 773 (2006).