Powering the jets in NGC 1052
Abstract
We have studied the inner regions of the LINER galaxy NGC 1052 since the mid 1990s at high resolution with 15 GHz very-long-baseline interferometry observations. A compact, two-sided jet structure is revealed, with multiple sub-parsec scale features moving outward from the central region with typical speeds of 0.26 . Complementary to this, since early 2005 we are performing a multi-mission campaign of observations of this source, including X-ray spectroscopy, X-ray, and radio flux density monitoring, and VLBA observations at 22 GHz and 43 GHz. X-ray variability is present at time scales of weeks, comparable with the structural changes observed by VLBI. Here we present first results of the high-resolution imaging observations and discuss these findings in the context of the multi-band campaign.
1 High-resolution and the AGN engines
The highest resolution observations in astronomy are possible via very-long-baseline interferometry (VLBI), which can be conducted routinely up to frequencies of 86 GHz, yielding sharp images of the brightest objects in the Universe resolved up to some tens of microarcseconds (as; see, e.g., the latest pioneering results by Doeleman et al 2008 at even higher frequencies). Typical resolutions are of the order of 0.5–3 mas at the frequencies where atmospheric and ionospheric effects do not severely affect the performance of the observations. High resolution observations of active galactic nuclei (AGN) provide access to the regions close to the central engine, believed to be a super-massive black hole (e.g., Zensus 1995). Those are complemented by single-dish flux density monitoring to follow the changes in the innermost part also from the spectra, which reveal variations of the optically-thin (synchrotron) and optically thick regions (closer to the self-absorbed jet base). Additionally, radio spectra turnover frequency imaging yields information on the jet physics, particle density, composition, etc. (e.g., Lobanov 1998). Polarisation observations at the higher frequencies can also reveal the direction and nature of the magnetic fields in the inner jet.
Following the standard model (e.g., Marscher 2006) the emission of a radio loud AGN at different radio wavelengths originates at different distances from the base of the jet. At higher frequencies, the bulk emission comes from closer to the central engine, since the synchrotron-self-absorption of the inner part of the jet is reduced at shorter wavelengths. Assuming a central black hole surrounded by an accretion disk, and perpendicularly to this, a jet with superluminal plasma accelerated, the radio emission is produced by synchrotron at a region where no self-absorption is present.
High-resolution radio observations are complemented by other regions of the spectra. AGN broadband spectra show absorption, reflection and emission lines as well as a power-law continuum radiation which can be studied by analyzing the spectral energy distribution. Their spectra show radio variability. In the X-rays, the observations of the iron K line at 6.4 keV (the most prominent fluorescent line) probes the AGN circumnuclear environment, from its variability and profile.
The combination of radio and X-ray has been successful, i.e., in the case of 3C 120 (Marscher et al 2002), where X-ray flux density “dips” precede VLBI jet ejections. The time delays are of the order of weeks to months caused by the offset of the core from the central engine and by the core shift between the observation frequency and the self-absorption turnover frequency. These “dips” can be put in the context of the discoveries in X-ray binaries (see Fender & Belloni 2004).
2 NGC 1052: the bridge between Type 1 and Type 2 sources
Flux-density selected samples of radio-loud AGN are usually dominated by Type 1 sources, with a one-sided jet morphology in high resolution radio images and the counter-jet usually not seen due to Doppler relativistic boosting (see e.g., Ros, these proceedings). Type 1 sources have an accretion disk which is seen face-on, and no absorption is seen in the soft region of the X-ray spectrum. Type 2 sources have an edge-on accretion disk, detected by strong absorption in the soft X-rays (Fabian et al 2000), and free-free absorption is observed at the multi-wavelength radio structure imaging close to the central engine.
NGC 1052 (B0238084, J02410815), classified as low-ionization nuclear emission-line region object (LINER), is a key source between both types, since it is radio loud, oriented in the plane of the sky, and emits in X-rays. Due to its closeness (with a redshift of =0.0049 (Knapp et al 1978), NGC 1052, despite of its relatively low radio luminosity, is still very bright in radio wavelengths and can be detected at all observing VLBI bands in jet and counter-jet (see, e.g., Lee et al 2008 for 86 GHz for the highest available VLBI frequency results published, with just one bright component). At arcsecond scales (Kadler et al 2004a; Cooper et al 2008) it presents an east-west faint emission (of 30′′ in extension) with a dominating core, which is also seen on mas-scales with a double-sided radio with a position angle of 65∘. The jet axis is considered to be nearly parallel to the plane of the sky, with values between a lower limit of 57∘ and 72∘ (Vermeulen et al 2003; Kadler et al 2004b). Sawada-Satoh et al (2008) determine values around 76∘–80∘. High opacities are measured toward the innermost component of the western jet (Kadler et al 2004b; Kameno et al 2001; Vermeulen et al 2003), and also at the inner edge of the eastern jet at centimetre wavelengths (Kadler et al 2004b; Sawada-Satoh et al 2008). Millimetre observations can see through this screen and reveal some structure at the innermost region. Emission from H2O spots has been detected both at jet and counter-jet (Sawada-Satoh et al 2008 and references therein), redshifted by 50–350 km s-1 with respect to the systemic velocity of the galaxy. This water emission is interpreted to be located at the region where opacity dominates due to the thermal plasma in the obscuring torus via free-free absorption. X-ray spectra further support the presence of a dense gas torus (Guainazzi & Antonelli 1999; Weaver et al 1999; Kadler et al 2004a) toward the nuclear X-ray source.
We started in 2005 a multi-mission campaign to track the ejection of new features at the base of the jet and counter-jets and compare with brightness monitoring and spectral studies in X-rays and radio, with the goal of establishing a relationship between changes in the high energy and the jet production in AGN. First results of the campaign were presented in Kadler et al (2006) and Ros et al (2007).
2.1 Observations
2.1.1 2 cm VLBA observations
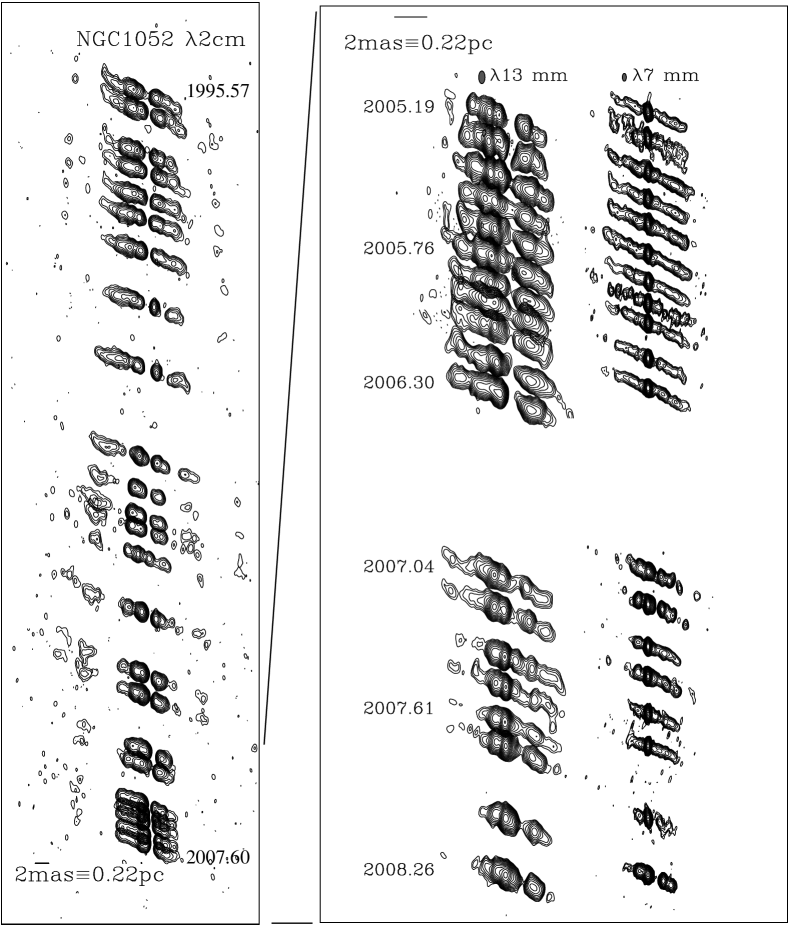
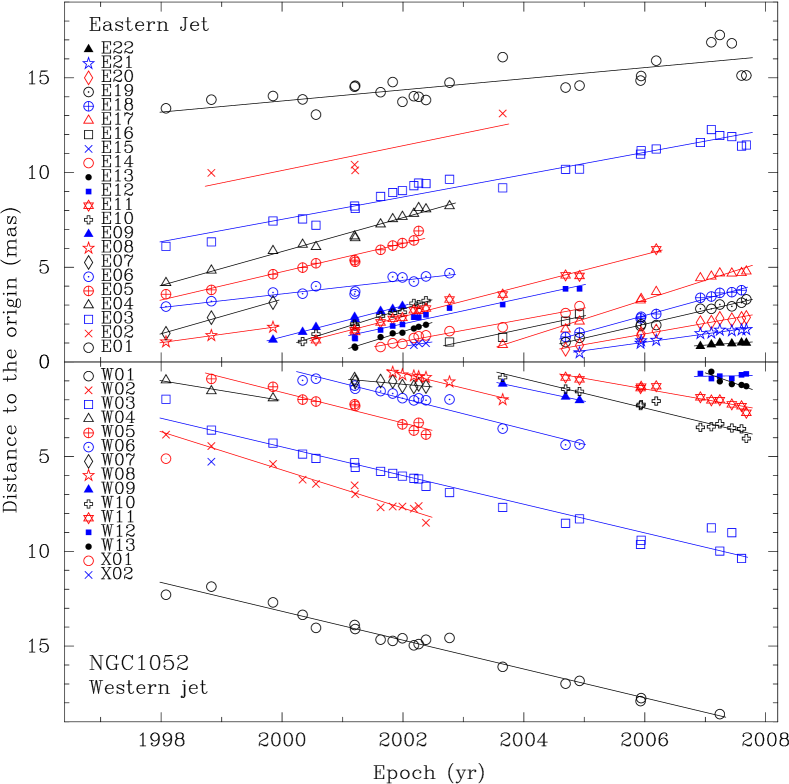
NGC 1052 has been observed with the VLBA by the 2 cm Survey/MOJAVE programme since 1995, with typical resolutions of 10.5 mas in P.A. 0∘. The images resulting from these measurements are shown in the left panel of Fig. 1. To reproduced the structural variations in the jets of NGC 1052, we modelled the observed radio visibilities with Gaussian circular functions. We cross-identified the modelled features from epoch to epoch by criteria of continuity in the positions and flux densities. A complex data base of functions results, with over 30 components along the more than 10 years of observations. In Fig. 2 we show the proper motions of these model-fitted features (the observations and results are part of the complete kinematic analysis of the MOJAVE/2 cm Survey program (M L Lister et al, in preparation; Ros, these proceedings). The reference origin to align the images has been chosen as the middle point between the two innermost components, although we note that the opacity effects can shift this position. This sets the question of the ejection epoch for the emerging components, since we can extrapolate the linear fit to be zero, but this can be considered as a lower limit. Notice that when computing kinematic epoch ejections for one-sided radio sources, the origin values are usually extrapolated to the core position ( surface). We show the speeds and maximum flux densities for selected components in Table 1. A more detailed analysis on the ejection, possible acceleration of components, non-linear motions, etc., is going to be presented in M Kadler et al (in preparation) and elsewhere.
| \br | No of | ||||||
|---|---|---|---|---|---|---|---|
| ID | Epochs | epoch | |||||
| [as yr-1] | [yr] | ||||||
| \mrE01 | 25 | 447 | 174 | 0.15 | 0.06 | 1971 | 13 |
| E03 | 26 | 595 | 26 | 0.196 | 0.009 | 1987.4 | 0.7 |
| E11 | 14 | 824 | 27 | 0.272 | 0.009 | 1999.1 | 0.1 |
| E17 | 12 | 1038 | 34 | 0.34 | 0.01 | 2002.8 | 0.1 |
| E18 | 10 | 889 | 27 | 0.294 | 0.09 | 2003.2 | 0.1 |
| \mrW11 | 11 | 536 | 46 | 0.18 | 0.02 | 2003.3 | 0.3 |
| W06 | 14 | 813 | 53 | 0.27 | 0.02 | 1999.6 | 0.2 |
| W03 | 23 | 757 | 36 | 0.25 | 0.01 | 1994.1 | 0.1 |
| W01 | 20 | 763 | 30 | 0.25 | 0.01 | 1982.8 | 0.8 |
| \br | |||||||
2.1.2 1.3 cm and 0.7 cm VLBA Observations
We have been monitoring the structure of NGC 1052 at 22 GHz and 43 GHz using the VLBA every six weeks (with some larger gaps in the time sampling due to scheduling reasons) since early 2005. The observations at these frequencies have different dynamic ranges and beams due to the different constraints during the observing epochs (e.g., weather constraints or failure of one or two stations of the VLBA). We present contour plots of the preliminary images convolved with a common beam in the right panel of Fig. 1. A detailed model fitting of the observed features is in progress, as well as the astrometric registration of the images, since they were observed in phase-referencing mode, including scans on the calibrator J02430550.
The imaging results show the free-free absorption screen to be still present at 22 GHz and getting transparent at 43 GHz. New components can be traced when being ejected from the innermost part of the jet. The light curves of the single-dish telescope measurements show a decay from 2005 to early 2008, with some hints of a rising flux density for the latest months (H Aller and M Aller, private communication).
3 Results
Our long-term 15 GHz results confirm the morphology and kinematics reported in Vermeulen et al (2003), with prominent jet and counter-jet features moving downstream with mildly relativistic speeds of 0.25 . The source has experienced a decrease in flux density at all frequencies since 2005. This is caused by the fading out of the features travelling outward the jet, which is not compensated by new, strong components at the base of the jet. There are some hints that this situation is beginning to change from the early 2008 observations.
The results of the multi-band campaign, including RXTE light curves and spectra, XMM-Newton, Suzaku, and Chandra observations, will be published elsewhere. Our imaging campaign at the highest frequencies is planned to last at least until early 2009. The MOJAVE program will be also continued beyond that and at least until 2010, providing observations of NGC 1052 at 15 GHz every several months.
The VLBA is operated by the National Radio Astronomy Observatory, which is a facility of the USA National Science Foundation operated under cooperative agreement with Associated Universities, Inc.
References
Cooper N J, Lister M L and Kochanczyk M D 2008 ApJS 171 376–388
Doeleman S D et al 2008 Nature 455 78–80
Fabian A C, Iwasawa K, Reynolds C S and Young A 2000 PASP 112 1145–1161
Fender R and Belloni T 2004 ARA&A 42 317
Guainazzi M A and Antonelli L A 1999 MNRAS 304 L15–L19
Kadler M, Kerp J, Ros E, Falcke H, Pogge R W and Zensus J A 2004a A&A 420 467–
Kadler M, Ros E, Lobanov A P, Falcke H and Zensus J A 2004b A&A 426 481–493
Kadler M et al 2006 Challenges of Relativistic Jets http://www.oa.uj.edu.pl/2006jets/posters/Kadler/Kadler.pdf
Kameno S, Sawada-Satoh S, Inoue M, Shen Z Q and Wajima K PASJ 53 169–178
Lee S S, Lobanov A P, Krichbaum T P, Witzel A, Zensus J A, Bremer M, Greve A and Grewing M 2008 AJ 136 159–180
Lobanov A P A&A 330 79–89
Marscher A P, Jorstad S G, Gómez J L, Aller M F, Terästranta H, Lister M L and Stirling A M 2002 Nature 417 625–
Marscher A P 2006 Relativistic Jets ed P A Hughes and J N Bregman, (New York: American Institute of Physics) pp 1–22
Ros E, Kadler M, Kaufmann S, Kovalev Y Y, Tueller J and Weaver K A 2007 Highlights of Spanish Astrophysics IV ed F Figueras et al (Dordrecht: Springer) p 165
Sawada-Satoh S, Kameno S, Nakamura K, Namikawa D, Shibata K M and Inoue M 2008 ApJ 680 191–199
Vermeulen R C, Ros E, Kellermann K I, Cohen M H, Zensus J A and van Langevelde H J 2003 A&A 401 113-127
Weaver K A, Wilson A S, Henkel C and Braatz J A 1999 ApJ 520 130–
Zensus J A 1995 AR&A 35 607