Measurement Induced Quantum Coherence Recovery
Abstract
We show that measurement can recover the quantum coherence of a qubit in a non-Markovian environment. The experimental demonstration in an optical system is provided by comparing the visibilities (and fidelities) of the final states with and without measurement. This method can be extended to other two-level quantum systems and entangled states in a non-Markovian evolution environment. It may also be used to implement other quantum information processing.
pacs:
03.65.Ta, 42.50.Xa, 42.50.Dv1 Introduction
At the beginning of the development of quantum mechanics, measuring problem is treated with the project measurement model given by Von Neumann [1]. In this model, measuring process leads to the irrevocable collapse of the quantum system into eigenstates and the coherence is destroyed. During the last decades, with the development of quantum information theory, quantum measurement has been understood in the framework of quantum decoherence theory [2] and has been used to construct some quantum information processes, such as the Knill, Laflamme, and Milburn (KLM) scheme [3] and one way quantum computation [4], etc. Specially, quantum Zeno effect with continuous measurement can be used to preserve the coherence of specific states [5, 6]. Recently, it has been shown that weak measurement can erase the collapse effect induced by a previous weak measurement and the initial quantum state can be recovered [7]. Katz et alhave experimentally verified this idea using superconducting phase qubits [8].
In this paper, we show that measurement can recover quantum coherence of a single qubit evolved in a non-Markovian environment which has the memory effect. A theoretical description of this method which predicts that the visibility of the qubit can be recovered from 0 to 50% is given. Then we demonstrate this phenomenon experimentally in an optical system with photons produced by the process of spontaneous parametric down-conversion. The recovery can be seen clearly by comparing the visibilities (and fidelities) of the final states with and without measurement. We also provide a simplified picture to understand this phenomenon.
2 Theoretical description
The polarization of a single photon is used as the information carrier and birefringent elements, which can couple the photon’s frequency with its polarization, are adopted as the adjustable non-Markovian environment. Consider an arbitrary input pure polarization state
| (1) |
where and are complex numbers which obey . and represent the horizontal and vertical polarization states, respectively. As a result, the output after interaction time in the birefringent crystal can be written as
| (2) |
when the optic axis of the birefringent crystal is set to be horizontal. The parameter is proportional to , which is the difference between the indexes of refraction of ordinary () and extraordinary () light. Because , different frequency will introduce different phase shift in the output state. Considering the contributions of all the frequencies, the relative phase between the information carrier bases and may become truly uncorrelated, which will destroy the coherence of the qubit [9].
This phenomenon is quite similar to the Rabi oscillation of a qubit in an external field. For a Rydberg atom in a cavity [10], the overall Rabi oscillation should be integrated over the photon number distribution which corresponds to the frequency distribution of the photon in our case. Therefore, the polarization state of the photon can be written as the following reduced density operator [11]
| (3) |
The final total probability for us to detect after interaction time is
| (4) |
tends to , when the interaction time is sufficiently large 111For the continuous frequency distribution , .. It can be seen that when the fidelity tends to and the visibility , which means that the qubit loses its coherence completely [11]. However, the coherence will be restored by measuring the qubit during its evolution, as can be seen below.
We insert measurement apparatus with the measurement basis setting at polarization (), where the two projected states are separated into two paths 1 and 2 without disturbing the photon’s subsequent dynamics. It should be noticed that the frequency distributions of the projected states after measurement are different from that of the initial state and the Pauli operation is employed to reverse and of the final output state. If the interaction time is before measurement while the residual interaction time is after measurement, the output density operator of the polarization reads as (the subscripts represent the paths 1 and 2)
| (5) |
where and are the probabilities of projecting into and polarization states, respectively. is the relative phase between and of the initial state. and are the residual evolution states in paths 1 and 2, respectively. As a result, the total probability for us to find is
| (6) |
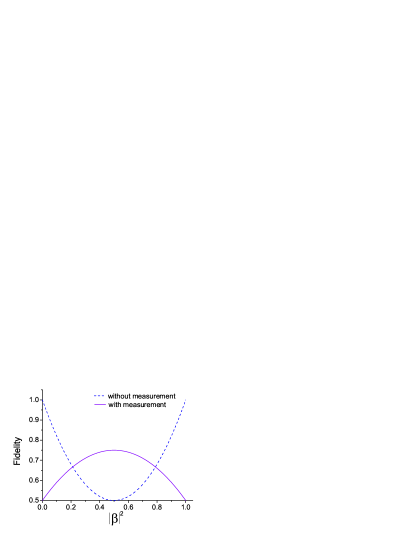
At the limit of long enough interaction time and with , tends to and we can get coherence recovery for a set of pure states, which can be seen from figure 1. At the area the fidelity with measurement is larger than the one without measurement and it reaches its maximal recovery at where the fidelity restores to 75%. The states which close to the eigenstates of the decoherence environment are less decohered and measuring the qubit can not improve the fidelity. For the set of maximally recovered states with the form , the recovered fidelity 75% is larger than the classical limit 66.7% 222The projective probability of any orthorgnal measurement basis of the subspace spanned by these maximally recovered states distributes on [0,1]. Therefore the fidelity allowed by classical optics is 66.7%, see [12]., which shows their quantum effect.
3 Experimental demonstration and discussion
In order to experimentally demonstrate this phenomenon, we choose the initial state from the set of maximally recovered states. The setup of the experiment is shown schematically in figure 2. The second harmonic ultraviolet (UV) pulses are frequency doubled from a mode-locked Ti:sapphire laser with the center wavelength mode locked to 0.78 m (with 130 fs pulse width and 76 MHz repetition rate). These UV pulses are focused into a beamlike cut beta-barium-borate (BBO) crystal [13, 14] to produce highly bright spontaneous parametric down-conversion (SPDC) photons with special polarizations. We get about 28000 coincidence events per second and the integral time is 10 s for each measurement. One of the SPDC photons (path ) is prepared into to demonstrate the coherence recovery while the other (path ) is used as a trigger.
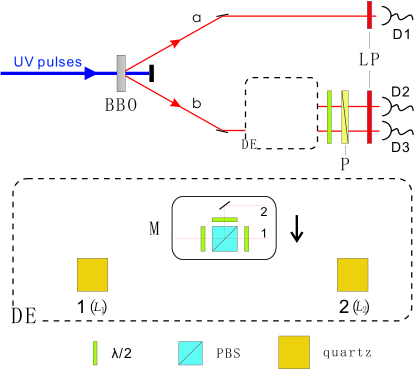
The decoherence evolution of the signal photon in path is the controllable birefringent “environment” using quartz plates with thickness which are distributed into two sets (set 1 with thickness and set 2 with thickness ). Measurement apparatus (M), which contains three half-wave plates () with optic axes setting at the same angle of according to the axis of quartz and a polarization beam splitter (PBS), can project a photon state onto or linear polarization which is corresponding to the path 1 or 2, respectively. We use a polarizer (P) in path to choose the final detecting polarization of the signal photon. Both photons are then coupled by multi-mode fibers to single-photon avalanche detectors which are equipped with long pass filters (LP) to minimize the influence of the pump light. Any successful detection is given by the coincidence of the trigger photon (D1) and the concerned photon (D2 or D3).
The frequency spectrum of the photon is considered as a Gaussian amplitude function with frequency spread and it is peaked at the central frequency corresponding to the central wavelength m. 333Deduced from the Gauss-like pulse pumping laser. According to equation (4) which is the case without measurement, the total probability of detecting is
| (7) |
where and represents the velocity of the photon in the vacuum. In our experiment, we can treat as a constant of 0.01 for the small frequency distribution and the thickness of quartz plates is represented by the corresponding retardation , which obeys the equation . The visibility of the final state without measurement can be calculated as . We can see that it will tend to zero with the increasing of the thickness of quartz crystals.
However, if we measure the photon by inserting M between and , we can obtain certain coherence recovery. According to equation (6), we get the final total probability of detecting (for )
| (8) |
where .
It can be seen that for large and , we still have the probability of to detect compared to in the case without measurement. The visibility in this case is , which can finally tend to 0.5 with the increasing of .
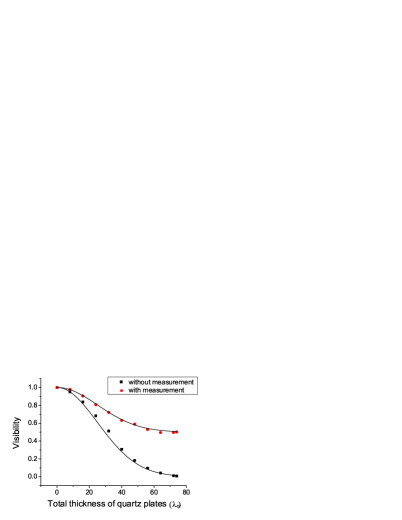
The visibility of the final state as a function of thickness is presented in figure 3, where the dots represent the data employing measurement during the decoherence evolution and the squares represent the data without measurement. For each thickness we let to get the corresponding visibility in the case with measurement. We tilt the quartz plates with optic axes set to horizontal so that the relative phase is the integral multiple of [9]. The solid lines are the theoretical fittings using the equations (without measurement) and (with measurment) mentioned above. In our experiment, the frequency spread is about Hz. It is shown that when the total thickness of quartz plates is increased to 74, the visibility with measurement reaches 0.501 while it will drop close to zero without measurement. Good fittings between theoretical predictions and experimental data are found.
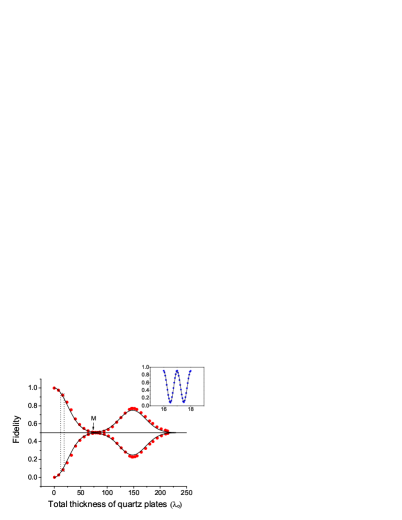
We further demonstrate this phenomenon in a visualized way by measuring the fidelity of the state in the whole evolution. As shown in figure 4, we insert measurement apparatus (M) and when increases to 74. While increases to 74 too, we obtain the highest probability 0.773 to get corresponding to the theory prediction of 0.75. This error is mainly due to the limitation of precision when we calibrate the axes of the quartz plates. We also show the oscillation between the maximal and minimal probability of getting by tilting a quartz plate to get the required angles. It can be seen from the inset in figure 4 that the oscillation is similar to a cosine curve in a small distribution of which agrees well with the theory prediction. As a result, we have experimentally demonstrated the coherence recovery by measuring the photon in the evolution.
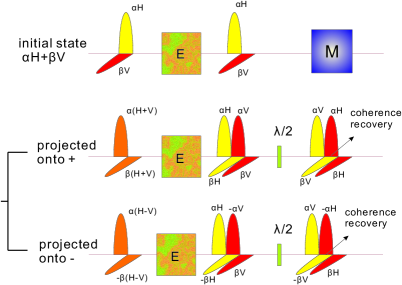
As measurement preserves the frequency distributions and the relative phases of the two projected states in the non-Markovian environment, we can choose a suitable interaction time after measurement to erase some of the unwanted effects of the environmental interaction. We may understand this phenomenon in a simplified picture as shown in figure 5 in time domain. The coherent superposition of the initial state of the photon comes from the overlap in temporal modes of the two eigenstates and . The first set of quartz plates with enough thickness which represented by E in figure 5 destroys the overlap completely. The projected states in the basis after measurement will preserve their relative phases. After passing through the second set of quartz plates with the same thickness some of the eigenstate components will overlap and then get the coherence recovery. We should only insert a half-wave plate to transfer the state of recovered part into the initial state acting as a operation. Figure 5 also implies that it is possible to get perfect coherence recovery by employing the time bin technology [15] to select only the recovered part.
4 Conclusion
In conclusion, we have demonstrated that by measuring a photon qubit during its evolution in a non Markovian environment, the destroyed coherence can be recovered. It can be deduced from the theoretical mode we give that this kind of measurement may be also realized in other two-level systems such as a Rydberg atom coupled to a microcavity [16] and an electronic spin coupled to nuclear spins [17, 18]. This technology is also useful to demonstrate entanglement recovering, Leggett-Garg inequality [19] and some kinds of Bell-like inequalities [20].
Acknowledgments
This work was supported by National Fundamental Research Program, the Innovation funds from Chinese Academy of Sciences, National Natural Science Foundation of China (Grant No.60121503) and Chinese Academy of Sciences International Partnership Project.
References
References
- [1] Von Neumann J 1955 Mathematical Foundations of Quantum mechanics (Princeton, NJ: Princeton University Press).
- [2] Wheeler J A and Zurek W H (eds) 1983 Quantum theory and measurement (Princeton, NJ: Princeton University Press)
- [3] Knill E, Laflamme R and Milburn G J 2001 Nature 409, 46
- [4] Raussendorf R and Briegel H J 2001 Phys. Rev. Lett. 86, 5188
- [5] Misra B and Sudarshan E C G 1977 J. Math. Phys. 18, 756
- [6] Nakanishi T, Yamane K and Kitano M 2001 Phys. Rev. A 65, 013404
- [7] Korotkov A N and Jordan A N 2006 Phys. Rev. Lett. 97, 166805
- [8] Katz N et al2008 Uncollapsing of a quantum state in a superconducting phase qubit Preprint arXiv:0806.3547
- [9] Kwiat P G, Berglund A J, Altepeter J B and White A G 2000 Science 290, 498
- [10] Auffeves A, Maioli P, Meunier T, Gleyzes S, Nogues G, Brune M, Raimond J M and Haroche S 2003 Phys. Rev. Lett. 91, 230405
- [11] Berglund A J 2000 Quantum coherence and control in one- and two-photon optical systems Preprint arXiv:quant-ph/0010001
- [12] Preskill J, 1998 Lecture Notes Chapter 2 (http://www.theory.caltech.edu/people/preskill/ph229/)
- [13] Kurtsiefer C, Oberparleiter M and Weinfurter H 2000 J. Mod. Opt. 48, 1997
- [14] Takeuchi S 2001 Opt. Lett. 26, 843
- [15] Brendel J, Gisin N, Tittel W and Zbinden H 1999 Phys. Rev. Lett. 82, 2594
- [16] Meunier T, Gleyzes S, Maioli P, Auffeves A, Nogues G, Brune M, Raimond J M and Haroche S 2005 Phys. Rev. Lett. 94, 010401
- [17] Yao W, Liu R B and Sham L J 2007 Phys. Rev. Lett. 98, 077602
- [18] Witzel W M, De Sousa R and Das Sarma S 2005 Phys. Rev. B 72, 161306(R)
- [19] Leggett A J and Garg A 1985 Phys. Rev. Lett. 54, 857
- [20] De Zela F 2007 Phys. Rev. A 76, 042119