DESY 08-159
Edinburgh
2008/44
LTH 810
Extracting the resonance from lattice QCD simulations at small
quark masses
Abstract:
Using established relations between the scattering matrix in infinite volume and the two-particle spectrum in a periodic box, we compute the mass and width of the meson from simulations of flavors of dynamical clover fermions at small pion masses .
1 Introduction
Lattice simulations of QCD with dynamical fermions have reached the point now where the masses of up and down quarks are light enough to allow the low-lying resonances, such as the and , to decay via the strong interactions. The problem of extracting masses and widths of unstable particles from the lattice data is complicated by the fact that resonance states cannot be identified with a single energy level of the lattice Hamiltonian. For elastic two-body resonances the method of choice, originally proposed by Lüscher [1] and Wiese [2], is to compute the phase shift in the infinite volume from the volume dependence of the energy spectrum, and from that the mass and width of the resonance. In this talk we shall present first results of an attempt to compute mass and width of the meson from simulations at realistic quark masses.
The meson is practically a two-pion resonance. It has isospin 1, and the two pions form a -wave state. We denote the pion momentum in the center-of-mass frame by . Phenomenologically, the scattering phase shift is very well described by the effective range formula
| (1) |
where and . The width of the is given by
| (2) |
Experimentally , which translates into . The phase shift passes through at the physical mass, i.e. or .
In the case of noninteracting pions, the possible energy levels in a periodic box of length are given by
| (3) |
where , being a vector with components . In the interacting case, the energy levels are still given by (3), but now is the solution of [1]
| (4) |
where is a generalized zeta function [3]. That is to say, each energy value , computed on the periodic lattice at some fixed value of , gives rise to a certain momentum . The scattering phase at this momentum and pion mass is given by (4). Fitting to the effective range formula (1) then allows us to estimate the mass and width of the meson.
In Fig. 1 we show the expected energy spectrum at the physical pion mass. The lowest energy level lies significantly below the physical (indicated by the dashed line), and should not be mistaken for the mass. In Fig. 2 we show the same plot, but for , corresponding to a pion mass of . In this case the lowest energy level differs only little from .


2 Lattice simulation and results
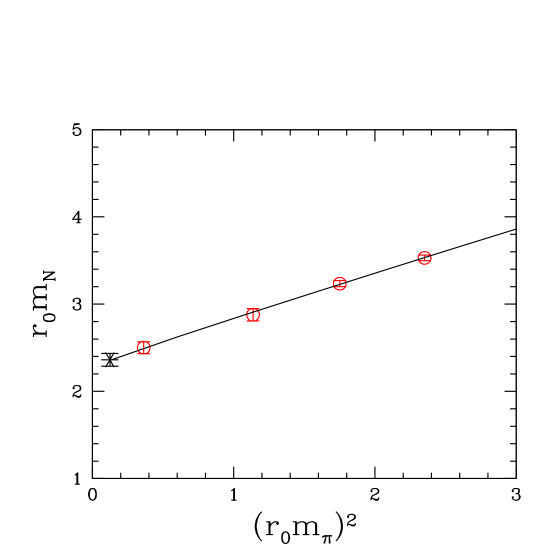
The simulations reported here use nonperturbatively improved Wilson fermions with degenerate flavors of dynamical quarks. The parameters of our current data sample are listed in Table 1. In five cases the pions are light enough so that the can decay. These data sets are marked by a . We use the nucleon mass to set the scale. In Fig. 3 we show the chiral extrapolation of to the physical pion mass for our finest lattice at . A fit [4] to the physical nucleon mass, which now includes pion masses below , gives . We shall use this number throughout this paper. We do not see any scaling violations outside the error bars.
We restrict the analysis to the lowest energy level. To compute , we use Jacobi-smeared sources and sinks, as well as wall sources and smeared sinks, and employ the lattice dispersion relation
| (5) |
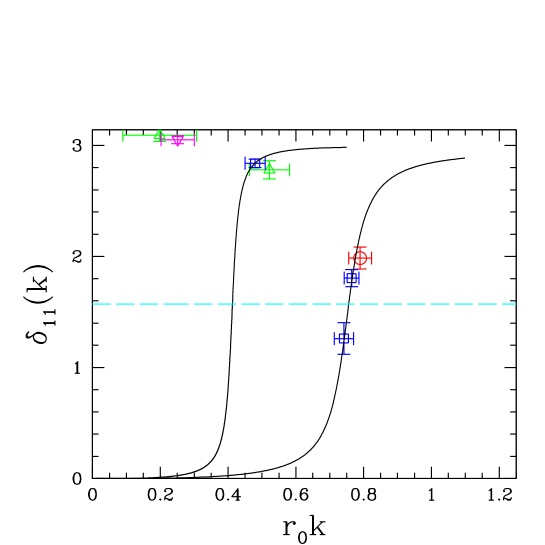
to determine . The phase shift is then readily obtained from (4). In Fig. 4 we show as a function of . We also include two data points from [5] ( and ) on the lattice at . These authors use the same action as ours. The scale parameter at this value has been obtained by interpolation. The phase shift clearly depends on the mass of the pion. In the following we shall combine the three data points at our lowest pion masses, , to a single data set and treat the remaining data points separately.
| Volume | [fm] | [MeV] | ||
| 5.25 | 0.13575 | 0.084 | 600 | |
| 5.25 | 0.13600 | 0.084 | 430 | |
| 5.29 | 0.13550 | 0.080 | 810 | |
| 5.29 | 0.13590 | 0.080 | 590 | |
| 5.29 | 0.13620 | 0.080 | 390 | |
| 5.29 | 0.13632 | 0.080 | 250 | |
| 5.29 | 0.13632 | 0.080 | 250 | |
| 5.40 | 0.13500 | 0.072 | 810 | |
| 5.40 | 0.13560 | 0.072 | 770 | |
| 5.40 | 0.13610 | 0.072 | 610 | |
| 5.40 | 0.13625 | 0.072 | 530 | |
| 5.40 | 0.13640 | 0.072 | 420 | |
| 5.40 | 0.13640 | 0.072 | 420 | |
| 5.40 | 0.13660 | 0.072 | 240 |
To obtain and , we fit the data to the effective range formula (1). This is done in two steps. We first fit the three data points in the lowest mass bin. This gives and at the corresponding pion mass. Assuming that does not depend on the pion mass,
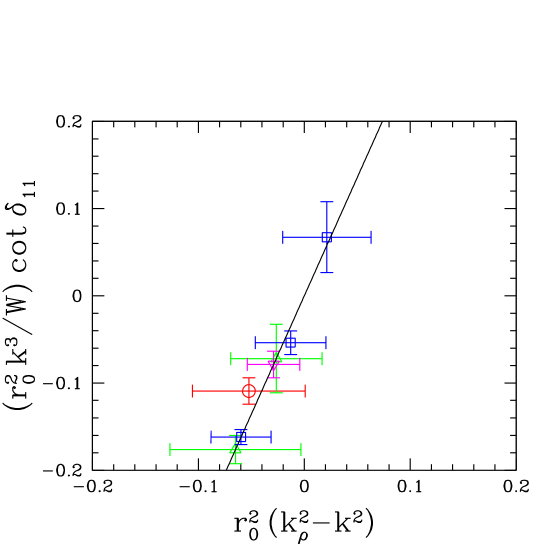
we subsequently fit the remaining data points. In Fig. 5 we show the result of the fit, and in Fig. 4 we comparethe resulting phase shift with the original data. For the coupling we obtain
| (6) |
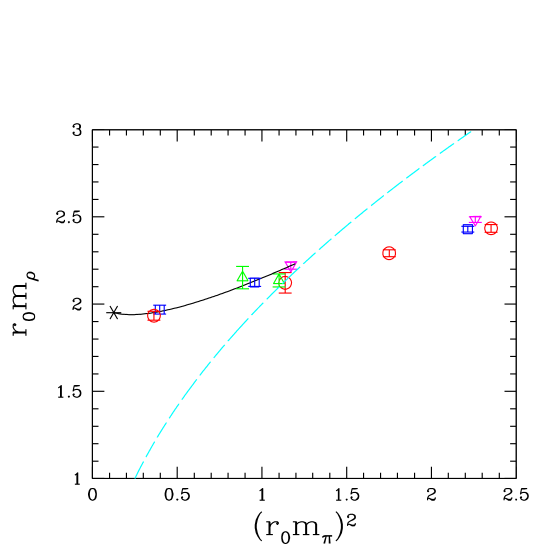
which is in broad agreement with the phenomenological value. The masses obtained from the fit are plotted in Fig. 6, together with the rest of the masses lying above the two-pion threshold. The solid curve is a fit through the experimental mass. It appears that cannot be analytically continued across the two-pion threshold.
3 Conclusions and outlook
So far we have concentrated on the lowest energy level only. To compute the energies of states with higher relative momenta, we need to extend the basis of operators to operators which especially project onto two-pion scattering states [7, 8]. With this information it should be possible to trace out the phase shift over the entire elastic region [7] . At present we are performing simulations at lighter pion masses. Altogether, this should enable us to present a more precise calculation of , including an extrapolation to the chiral limit.
In the conference presentation an attempt was made to compute the mass and width [9] of the resonance. It was found that this requires pion masses close to the physical value, as the threshold is only reached at , as opposed to in case of (see Fig. 6). We hope to return to that in due course.
Acknowledgment
The numerical simulations have been performed on the Altix at LRZ (Munich), the BlueGeneLs at EPCC (Edinbugh) and NIC (Jülich), as well as on the APEmille and apeNEXT at NIC (Zeuthen). This work is supported by the EU Integrated Infrastructure Initiative Hadron Physics (I3HP) under contract RII3-CT-2004-506078 and by the DFG under contracts FOR 465 (Forschergruppe Gitter-Hadronen-Phänomenologie) and SFB/TR 55 (Hadron Physics from Lattice QCD).
References
- [1] M. Lüscher, Commun. Math. Phys. 105 (1986) 153; Nucl. Phys. B 364, 237 (1991).
- [2] U.-J. Wiese, Nucl. Phys. Proc. Suppl. 9, 609 (1989).
- [3] M. Lüscher, Nucl. Phys. B 354, 531 (1991).
- [4] A. Ali Khan et al., Nucl. Phys. B 689, 175 (2004) [arXiv:hep-lat/0312030].
- [5] L. Del Debbio et al., JHEP 0702, 082 (2007) [arXiv:hep-lat/0701009].
- [6] P. C. Bruns and U. G. Meissner, Eur. Phys. J. C 40, 97 (2005) [arXiv:hep-ph/0411223].
- [7] M. Göckeler et al., Nucl. Phys. B 425, 413 (1994) [arXiv:hep-lat/9402011].
- [8] S. Aoki et al., Phys. Rev. D 76, 094506 (2007) [arXiv:0708.3705 [hep-lat]].
- [9] V. Bernard et al., Eur. Phys. J. A 35, 281 (2008).