The evolution of two stellar populations in globular clusters
Abstract
Aims. We investigate the long-term dynamical evolution of two distinct stellar populations of low-mass stars in globular clusters in order to study whether the energy equipartition process can explain the high number of stars harbouring abundance anomalies seen in globular clusters.
Methods. We analyse N-body models by artificially dividing the low-mass stars ( ) into two populations: a small number of stars (second generation) consistent with an invariant IMF and with low specific energies initially concentrated towards the cluster-centre mimic stars with abundance anomalies. These stars form from the slow winds of fast-rotating massive stars. The main part of low-mass (first generation) stars has the pristine composition of the cluster. We study in detail how the two populations evolve under the influence of two-body relaxation and the tidal forces due to the host galaxy.
Results. Stars with low specific energy initially concentrated toward the cluster centre need about two relaxation times to achieve a complete homogenisation throughout the cluster. For realistic globular clusters, the number ratio between the two populations increases only by a factor 2.5 due to the preferential evaporation of the population of outlying first generation stars. We also find that the loss of information on the stellar orbital angular momentum occurs on the same timescale as spatial homogenisation.
Conclusions. To reproduce the high number of chemically anomalous stars in globular clusters by preserving an invariant IMF, more efficient mechanisms such as primordial gas expulsion are needed to expel the stars in the outer cluster parts on a short timescale.
Key Words.:
globular clusters: general - stellar dynamics - Methods: N-body simulationsemail: decressin@astro.uni-bonn.de
1 Introduction
In a given globular cluster (GC), low-mass stars are known to display a homogeneous composition in Fe and other heavy elements (with the noticeable exception of Cen). However, in each individual GC some pronounced star-to-star variations in light element abundances (Li to Al) are found, leading to the well-known C-N, O-Na, Li-Na and Mg-Al anticorrelations (for a review see Gratton et al. 2004; Charbonnel 2005). They are the direct results of H-burning nucleosynthesis at high temperatures (Denisenkov & Denisenkova 1989, 1990; Langer & Hoffman 1995; Prantzos et al. 2007). In addition, since such abundance patterns are not detected in population II halo fields stars, they are expected to be related to the evolution of the GCs. Since the low-mass stars still on the main sequence or on the red giant branch display such abundance variations and since these stars do not produce in their interior the high temperatures needed to create the abundance anomalies, it is expected that low-mass stars have inherited this chemical pattern at birth.
Massive stars as possible sources to contaminate the metal abundances in the GCs have first been proposed by Pilachowski et al. (1982) and Wallerstein et al. (1987) and then studied by Prantzos & Charbonnel (2006) and Smith (2006). Recently Decressin et al. (2007b) explore the role of a high initial rotation in such stars, finding that abundance anomalies in GCs can result from an early pollution by fast-rotating massive stars. Indeed during main sequence evolution, angular momentum is transported from the centre to the stellar surface, and for stars heavier than 20 with a high initial rotational velocity, their surface can reach the break-up velocity limit at the equator (i.e. the centrifugal equatorial force balances gravity). In such a situation, a slow mechanical wind develops at the equator and forms a disc around the stars similar to what happens to Be stars (Townsend et al. 2004; Ekström et al. 2008). The second effect of rotation is to transport elements from the convective H-burning core to the stellar surface, which enriches the disc with H-burning material. While matter in discs has a slow outward velocity and hence will stay in the potential well of the cluster, matter released during the main part of the He-burning phase and during SN explosions has a very high radial velocity and will be lost from the cluster. Therefore, new stars can only form from the matter available in discs and can become the stars with abundance anomalies we observe today. Thus GCs can contain two distinct populations of low-mass stars: a first generation that has the chemical composition of the material out of which the cluster formed (similar to field stars with a similar metallicity); and a second generation of stars harbouring the abundance anomalies born from the ejecta of fast-rotating massive stars.
Based on the determination of the composition of giant stars in NGC 6752 by Carretta et al. (2007), Decressin et al. (2007a) determined that around 85% of stars (of the sample of 120 stars) display abundance anomalies. Prantzos & Charbonnel (2006) find similar results for NGC 2808 with their analysis of the data of Carretta et al. (2006): 70% of the cluster stars present abundance anomalies.
A main problem is that by assuming a Salpeter (1955) IMF, the accumulated mass of the slow winds ejected by the fast-rotating massive stars would only represent 2.5% of the mass of the whole population of first generation stars (see Fig. 5 in Decressin et al. 2007a). This number is only a lower limit since some mixing between the slow wind and the gas of the interstellar medium left after the formation of first generation stars needs to be taken into account so that more matter will be available to form second generation stars. Taking this dilution process into account, Decressin et al. (2007a) found that the initial mass of the second generation stars is 5% of the cluster mass. As the whole population of low-mass stars represents half of the cluster stellar mass, this leads to a number ratio of about 0.1 between the second and the first generation of low-mass stars. This dilution process of the slow wind in the ISM is also mandatory to explain the Li detected in stars with abundance anomalies. Indeed in NGC 6752, Pasquini et al. (2005) found that turn-off stars with abundance anomalies display a noticeable abundance variation in Li. Similar results are found for 47 Tuc (Bonifacio et al. 2007). However in the hot interior of massive stars, all the Li initially present is consumed and no Li is ejected into the disc. Thus the Li in stars with abundance anomalies can only come from the ISM.
To reconcile the high fraction of second generation stars with the observations Decressin et al. (2007a) suggest that we need either (a) a flat IMF for the massive stars, or (b) that 96% of the low-mass stars of the first generation have escaped the cluster. The second case could be achieved if the following scheme happens: we assume that the fast-rotating massive stars are born near the cluster centre or migrate rapidly toward the centre (i.e. , that the cluster is initially mass segregated). In such a case, the slow winds ejected by these massive stars are also concentrated near the centre. As the second generation stars need to be formed on a short timescale to avoid the ensuring supernovae pushing the slow wind material, from which second generation stars are to form, out of the cluster, we can expect that second generation stars will form with the same radial distribution as the massive stars.
Primordial mass segregation is observed in young star clusters in the Milky Way and the Magellanic Clouds (Bonnell & Davies 1998; Gouliermis et al. 2004; Chen et al. 2007). Thus we could reasonably expect that GCs were also mass segregated at birth. It should be noted that the recent correlation between the slope of the mass function and the concentration parameter (, where and are the tidal and core radius respectively) discovered by De Marchi et al. (2007), can be explained naturally if the GCs started mass segregated (Marks et al. 2008; Baumgardt et al. 2008a).
Empirical evidence for the presence of gas in the cluster centre at the same time as massive stars are still evolving is provided by Galliano et al. (2008). They investigated extremely massive young clusters, which are believed to be nascent GCs (around 6-8 Myr old), in the spiral Galaxy NGC 1365, and found an optically thick component in addition to a thin one. These authors argue that this thick component could be related to a subsequent or on-going episode of star formation.
We expect that the slow winds of fast-rotating massive stars dilute the ISM locally around each massive star, so second generation stars will be born only in the central part of the cluster while the outer regions are populated exclusively by first generation stars. If some dynamical process unbinds the external parts most of the first generation stars may be lost while the second generation stars are retained in the cluster. In the present paper we investigate if the tidal interactions with the host Galaxy can produce such an effect.
The time needed for the second generation of stars to spread throughout the cluster is expected to scale with the two-body relaxation time at the half-mass radius, , of the cluster given by Spitzer (1987),
| (1) |
where , and are the number of stars and their mean mass while , and represent the total mass and the half-mass radius of the cluster respectively. The two-body relaxation time is an estimate of the timescale over which the cluster rearranges itself significantly due to its evolution towards energy equipartition as driven by the many encounters between two stars within the cluster potential. At the same time, the tidal forces of the host galaxy remove stars from the outer cluster parts. Current observations of GCs suggest that most of them are several relaxation times old, so that we would expect that stars in these clusters are thoroughly mixed and therefore homogeneous at the present time.
In this paper, we study more quantitatively the interplay between the effect of internal dynamics and the external potential of the host galaxy on the evolution of two stellar populations in GCs. In § 2, we describe the dynamical models we used. Then our analysis is presented in § 3. Finally, our results are discussed and our conclusions are drawn in § 4.
2 Dynamical models
2.1 Used models
The analysis presented here is based on the calculations of Baumgardt & Makino (2003), which consist of a set of models containing 8k to 128k stars111In this paper we use the computer unit 1k = 1024. initially, carried out with the collisional Aarseth N-body code nbody4 (Aarseth 1999). It uses a Hermite scheme with individual time-steps for the integration and treats close encounters between stars by KS (Kustaanheimo & Stiefel 1965) and chain regularization (Mikkola & Aarseth 1990, 1993).
Here we restrain the analysis to clusters moving on circular orbits (with orbits 8500 pc away from the Galactic centre) through a host galaxy modelled as a logarithmic potential. The clusters follow King profiles initially with central concentrations . The cluster initial radii are adjusted such that the tidal radius of the King model was equal to the tidal radius given by the host Galactic tidal field. The clusters are computed until complete dissolution. The initial mass function of stars in the cluster is given by a canonical two-part power-law mass function (Kroupa 2001) with upper and lower mass limits of 15 and 0.1 respectively. This leads to an initial mean mass of . Stellar evolution is modelled by the fitting formulae of Hurley et al. (2000) with an assumed metallicity of (, the mean value of GC metallicities) for the cluster stars. Mass lost from the stars in the course of their evolution is assumed to be immediately lost by the cluster. The clusters contained no initial binaries.
2.2 Selection by specific energy
Although the models of Baumgardt & Makino (2003) have been computed for a single stellar population, we apply a process which could mimic the formation of a cluster with two dynamically distinct populations. Decressin et al. (2007a) have shown that the slow equatorial winds of fast-rotating massive stars create slowly expanding discs which stay in the potential well of the GCs. If we assume a radial velocity for these winds between 1 and 10 km s-1, and that the gas travels for about yr before starting to form new stars, it will travel for a distance of about 0.1 to 1 pc. As the initial tidal radius of the cluster is a few 10 pc, we expect that second-generation stars have the same initial spatial distribution as their massive progenitors. Since we assume here that the massive stars are born in the centre of the cluster, the second generation stars will also be located near its centre.
In order to select stars in the cluster centre we sort all the low-mass stars ( ) according to their specific energy defined as the energy per unit mass. We define the second stellar generation as the stars with smallest specific energies, (i.e. those stars which are most tightly bound to the cluster due to their small central distance and low velocity). The number of second generation stars is given by having their total mass represent 5% of the initial mass of the cluster. For the models with initially 128k stars, we have 104691 first generation stars and 10327 second generation stars; the remaining stars are more massive than 0.9 .
2.3 Possible issues
It should be noted that the upper-limit for the IMF in the models of Baumgardt & Makino (2003) is 15 . However the pollution by massive stars would involve stars more massive than 20 (see Decressin et al. 2007b). The evolution of such high mass stars takes a few million years. So if the delay for the formation of the second generation stars is short, the two populations will be nearly coeval. However the direct dynamical effects of the fast-rotating massive stars (more massive than 20 ), like the lowering of the cluster potential well by the ejection of their fast polar winds and SN, or the creation of a second generation of stars with the matter released in their slow winds, are not taken into account in this paper.
With the scheme presented in § 2.2, we implicitly assume that the lifetime of the first and second generation of low-mass stars are identical. In real clusters this would not be valid if a noticeable fraction of second generation stars shows a large overabundance in He. Indeed as He is the main product of H-burning in stars, abundance anomalies are also expected to come with He overabundance. Although He abundance cannot be directly determined, several indirect observations push toward this finding. First, the GCs Cen and NGC 2808 display multiple main sequences (Piotto et al. 2005, 2007); a double sub-giant branch is also found in NGC 1851 (Milone et al. 2008). Such features can only be understood if the stars present various He contents. He enrichment is also a possible explanation for the appearance of extreme horizontal branches seen for several GCs (Caloi & D’Antona 2005, 2007).
For our paper, the different initial He content between the two populations needs to be properly taken into account as stars with higher initial He content have a shorter lifetime due to faster stellar evolution. Therefore to be consistent with the evolution of the second generation of stars requires custom-made models. However the value of (instead of 0.25) is often cited as needed to properly explain the observations (Norris 2004; Piotto et al. 2005) while Decressin et al. (2007a) find that fast-rotating massive stars could even create low-mass stars with a He mass fraction up to . For 12 Gyr old clusters, D’Antona & Ventura (2007) show that the turn-off mass decreases from 0.8 to 0.64 when the initial He content raises from 0.24 to 0.4. It could even be as low as 0.35 if the initial He content is 0.7 (Decressin et al., in prep.). Unfortunately the N-body computations of Baumgardt & Makino (2003) use only standard He abundance for the stellar evolution models, so this effect cannot be investigated in the present paper. However we expect that the global findings of this paper on the dynamical timescales will not be changed by this He-rich population. Nevertheless a forthcoming paper will address this issue.
3 Analysis
3.1 Dynamical evolution: radial distribution
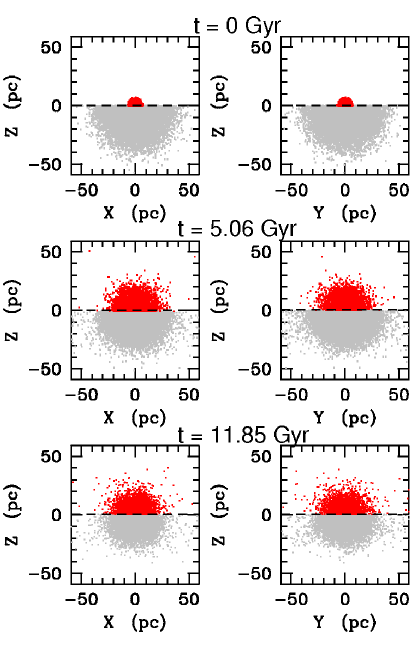
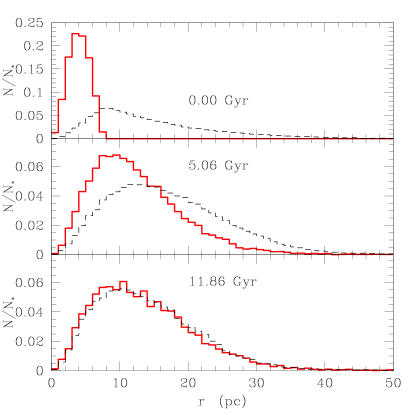
Fig. 1 illustrates the evolution of two selected stellar populations in a cluster with initially 128k particles in a circular orbit around the Galaxy at three different times. In Fig. 2 one can see the radial distribution of the two populations at the same epochs. Initially, the second generation stars with low specific energy are concentrated within 6 pc around the centre of the cluster while stars of the first generation show a more extended distribution up to 40 pc.
Progressively the second generation stars spread out due to dynamical encounters so their radial distribution extends. The middle panels in Fig. 1 and 2 show that even after 5 Gyr of evolution the two populations still retain different distributions. At this time, which corresponds roughly to one initial relaxation time for the whole cluster, the extent of the second generation stars reaches 35 pc, but they are still more strongly concentrated to the central part.
3.2 Number of escaping stars
As already stated in the introduction, two competitive processes act in the clusters: the loss of stars from the outer cluster parts will first reduce the number of bound first generation stars; and the dynamical spread of the initially more concentrated second generation stars will stop this differential loss when the two populations are dynamically mixed. We now describe the operation of this interplay.
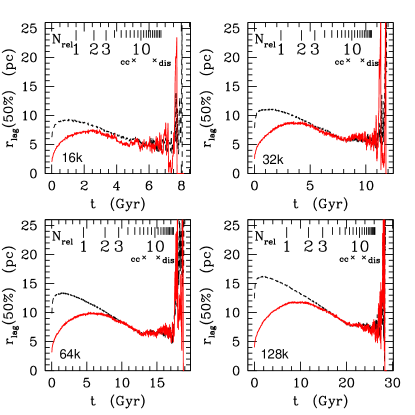
The time evolution of the half-mass radii of the two populations is displayed in Fig. 3 for clusters with different initial numbers of particles. Stars which have already been lost by the clusters are not taken into account, so this radius reflects only bound stars. Initially, stars of the first generation have a larger half-mass radius as expected by our selection scheme (e.g. 5 and 12 pc respectively for the case with k stars). The fast initial increase of the half-mass radius is due to the evolution of the massive stars which lose a large part of their mass (Fig. 1 in Baumgardt & Makino 2003). Winds from these stars are not retained so the potential well of the cluster is lowered and the outer regions expand. Later the tidal forces of the host galaxy remove outer stars and the half-mass radius decreases until the final disruption of the cluster. The strong variation at the end of the evolution is due to the small number of low-mass stars still remaining in the cluster. They are also more pronounced in the smaller clusters.
On the other hand, the second generation stars have initially a smaller half-mass radius as a result of their lower specific energy. The initial expansion due to the evolution of massive stars has a smaller effect on the half-mass radius of the second generation stars compared to first generation stars as second generation stars populate the centre and hence the deeper and less perturbed parts of the potential well. Later the half-mass radius increases continuously with time following the spread of the radial distribution as the cluster tries to achieve energy equipartition. After some time the two radii are similar and the further evolution of the two populations is identical.
Fig. 3 also shows the number of passed two-body relaxation times, , defined as:
| (2) |
where is the current relaxation time given by Eq. (1) and is the integration variable. The relaxation time, , decreases with time as both and N decrease (see Eq. (1)). For each cluster we also indicate the time at which core-collapse occurs and the time at which dissolution of the cluster happens (i.e. when 95% of the initial mass has been lost by the cluster) as computed by Baumgardt & Makino (2003). These two times are labelled by “cc” and “dis”, respectively. Cluster homogenisation needs around 2 relaxation times nearly independently of the initial number of stars. However there is still a weak dependence with the initial number of stars since the effect of mass loss does not scale with N in the same way as the relaxation time (Baumgardt 2001). Other radial properties, like the mean radius and the radial distribution of stars, are also similar in both populations when . Since GCs are several relaxation times old, they have lost all information on their initial radial distribution. The case of Cen, which is dynamically younger, will be discussed in § 3.4
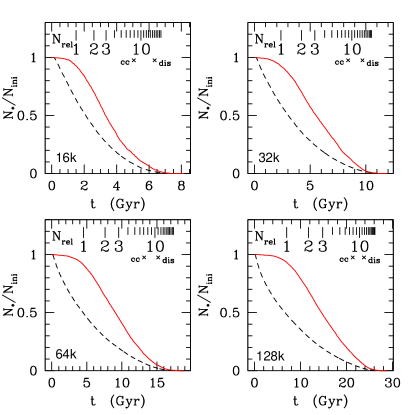
As previously seen, the effect of the external potential of the Galaxy on the cluster is to strip away stars with high specific energy. Fig. 4 shows the evolution of the fraction of stars in each population that still remains in the cluster as a function of time for different initial numbers of stars. Initially, only stars of the first generation populate the outer part of the cluster owing to their high specific energy. Therefore only first generation stars are lost in the beginning. This lasts until the second generation stars migrate into the outer part of the cluster. Depending on the cluster mass, it takes between 1 to 4 Gyr to start a loss of second generation stars. This timescale scales roughly with the relaxation time (see also § 3.3 for more details). Indeed, as shown before, more massive clusters have a more extended initial radial distribution so the migration of the second generation stars lasts longer. Besides, these clusters also have a deeper potential well and the erosion by the tidal forces of the Galaxy is reduced.
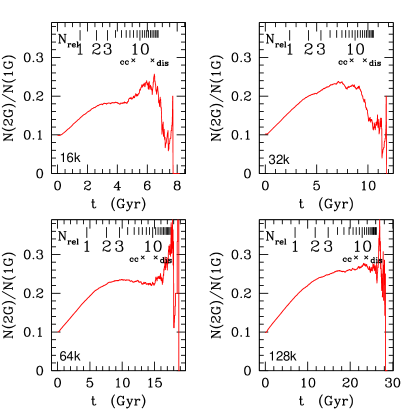
Due to the time-delay to lose second generation stars, their remaining fraction in the cluster is always higher than that of the first generation stars except during the final stage of cluster dissolution. Fig. 5 quantifies this point by showing the time evolution of the number ratio of second to first generation stars. As a direct consequence of our selection procedure, the initial ratio is about 0.1; and it then increases gradually with time. It tends to stay nearly constant as soon as the two distributions are similar. Finally, at the time of cluster dissolution, large variations occur due to the low number of low-mass stars present in the cluster.
Over the cluster history, the fraction of second generation stars relative to first generation ones increases by a factor of 2.5. Therefore, when the two populations have the same radial distribution, these stars represent 25% of the low-mass stars present in the clusters. Presently, observed ratios have been derived only spectroscopically for NGC 2808 (70%) and NGC 6752 (85%), since a large number of stars needs to be analysed. Thus, the internal dynamical evolution and the dissolution due to the tidal forces of the host Galaxy are not efficient enough to produce the high observed value. An additional mechanism is thus needed to expel the first generation stars more effectively.
3.3 Influence of the Initial number ratio
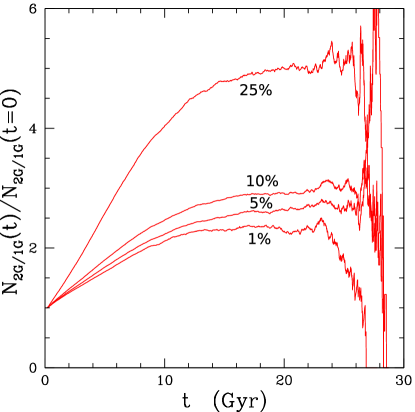
The next point we want to investigate is how our results depend on the number of stars selected to be first or second generation stars. Fig. 6 addresses this issue: for the computation with initially 128k stars, we select different number of second-generation stars which represent 1, 5, 10, and 25% of the initial mass of the cluster and follow how the ratio of second to first generation of stars evolves with time. For the 5% case, we retrieve our previous results: the ratio increases by a factor of 2.5 and then flattens until cluster dissolution. The more numerous the second generation stars are, the stronger the increase is. In the case of 25% of stars selected, the ratio increases by a factor of 5. This trend can be understood as a result of the selection process which selects mainly those stars which remain bound to the cluster until the end. However this case can only be achieved if the IMF slope for the massive stars is around 1.7 (when Salpeter value is 2.35).
For a standard IMF we expect only a limited number of low-mass stars to be second generation stars. Thus the models above with a low fraction of second generation stars are more realistic to what happens in real GCs and all of them predict only a modest increase of the fraction of the second generation stars.
3.4 Angular-momentum-selected sub-populations


In the previous sections we have only considered the case of two populations which initially differ by their spatial distribution as we expect such differences if a second generation of stars are born from the ejecta of massive stars. In this context, the GC Cen is an exceptional case as it not only shows variations in light elements but also a wide spread in metallicity from to (Norris & Da Costa 1995). Additionally, a close inspection of the color-magnitude diagram of Cen shows that several populations exist at all the evolutionary stages, from the RGB (Lee et al. 1999; Pancino et al. 2000; Sollima et al. 2005a) to the sub-giant (Ferraro et al. 2004; Sollima et al. 2005b; Villanova et al. 2007) branches and main sequences (Bedin et al. 2004; Piotto et al. 2005). Interestingly, Norris et al. (1996) found the more metal-rich stars to be more spatially concentrated. Evidence for significant differences in the kinematics and the spatial distribution between the metal-rich and other stars have been collected (Norris et al. 1997; Jurcsik 1998). However these findings have been challenged by Pancino et al. (2007) on the basis of an analysis of a larger sample.
Therefore in this section we want to determine if the time needed for a cluster to lose its initial kinematic properties is the same as for the initial radial distribution. In particular we want to test how quickly the kinematic differences are erased since differences are observed in Cen whereas other GCs do not show such strong observational evidences. To assert this timescale for achieving kinematic homogenisation, we setup the initial conditions for the analysis in another way: we divide the low-mass stars according to their angular momentum about the cluster centre along the z-axis (the cluster orbital motion occurs in the x-y plane with positive angular momentum).
First, Fig. 7 shows the evolution of the number ratio between stars having negative and positive orbital angular momentum. Initially half of the low-mass stars populate the groups with prograde () and retrograde () motion. A rapid drop of the ratio of the number of stars with retrograde motion (from 1 to 0.95) occurs due to the preferential loss of stars with negative during the evolution of the massive stars, followed by a very slow decline during the cluster evolution. At the time of core collapse, this ratio is around 0.9. This fast initial change can be explained by the mass-loss of massive stars which lowers the potential well of the cluster leading to the expulsion of the stars in the outer parts as we have seen before. This ejection is more pronounced for the stars with retrograde motion () relative to the cluster orbit than those with prograde motion (). This finding seems to contradict previous works which found that retrograde orbits are more stable than prograde ones if the cluster is on a prograde orbit in a steady external potential (see e.g. Fukushige & Heggie 2000). The difference can be explained by the different coordinate systems used in these studies: Baumgardt & Makino (2003) applied an accelerated and non-rotating coordinate system (the Galaxy rotates about the cluster) while an accelerated and rotating one is used by the computations of Fukushige & Heggie (2000, in the cluster centric frame the Galaxy is fixed; the cluster-centric frame is therefore non-inertial). Retrograde orbits in a rotating frame (Fukushige & Heggie 2000) are found to be the stable ones, and a few of them shift to prograde orbits if we consider them in a non-rotating frame. This effect leads to the inversion of the dominant population and explains the discrepancy of Baumgardt & Makino (2003) with the older study. We conclude that stars on retrograde orbits with respect to their cluster centre are preferably lost from the cluster, where prograde orbits are in the same sense as the cluster orbit about the Galaxy. So an initially non-rotating cluster begins to rotate in a prograde manner after the massive stars have evolved. But the effect remains small (see Fig. 7). Similar results have been obtained by Yim & Lee (2002) who state that clusters with no initial rotation can gain a slight positive angular momentum (i.e. that the cluster rotates in the same direction that the orbital motion.).
To measure the time needed to lose the initial angular momentum distribution, we need to look more carefully at each population, as due to stellar encounters stars can change their orbital parameters and hence invert their orbital angular momentum. Initially only two populations exist: stars with and . As time proceeds, stellar interactions induce changes to the orbits of stars and some stars show an inversion in . Hence the cluster splits into four populations depending on their initial and current angular momentum. Fig. 8 shows the evolution of the fraction of stars which have kept their initial orbital angular momentum for the population of stars with negative and positive . Here homogenisation will be obtained when 50% of the stars have inverted their orbital angular momentum. Fig. 8 displays the fraction of stars keeping their initial AM sign rapidly decreases to 70-80%, thus 20 to 30% of stars suffer such an inversion during the early radial expansion following the evolution of the massive stars. Then the inversion rate decreases slowly and homogenisation fully occurs after around 2-3 relaxation times. Thus the loss of information about orbital angular momentum follows the same timescale as the radial distribution.
Therefore if there is any dynamical (radial or kinematic) property which differs initially between different cluster sub-populations, most clusters would have erased them during their evolution as they are several relaxation times old. Cen has the longest relaxation time which spans a range from several yr at the centre to yr at the half-mass radius (van de Ven et al. 2006). Thus it has evolved only for about one relaxation time and we should indeed see differences, at least at a low level, if the cluster was born with dynamically distinct populations. Thus if the results of Pancino et al. (2007) are confirmed we would have to conclude that the different populations observed in the CMD were born with the same radial and kinematic properties.
3.5 Timescale for early processes
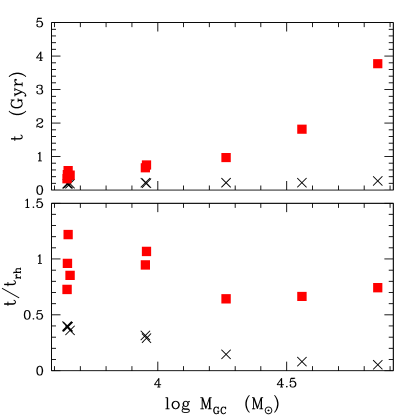
Fig. 9 gives the timescales for a cluster to lose 1% of both generations of low-mass stars as a function of the mass of the cluster. This time corresponds to the end of the initial plateau seen in Fig. 4 for the second generation. Since Baumgardt & Makino (2003) computed several N-body models with 8k and 16k stars, we have included all the data points.
In these models, the first generation stars are the first to be noticeably lost after around 100 Myr and this is nearly independent of the cluster mass. On the other hand, the time until 1% of the second generation evaporates increases with the cluster mass because these stars have to travel to a larger radius before being lost. For the heaviest clusters this happens only after 4 Gyr (this time scales as 0.7–0.8 times the relaxation time, see bottom panel of Fig. 9). It should be noted that the lightest clusters show a strong statistical effect due to the small number of second generation stars initially present. As heavier clusters show an almost identical time relative to their relaxation timescale, we can quite confidently extrapolate our results to more massive clusters.
As already explained, we need to find an additional mechanism which would more vigorously eject first generation stars and at the same time keep the second generation stars. Several processes can play this role. First, disk or bulge shocking has been argued to heat up the outer part of the cluster when it passes through the Galactic plane. This effect increases the loss of stars. As the timescale between two passages in the Galactic plane is around yr and the appearance of second generation stars in the outer regions needs a few yr, a high number of shocks affecting nearly exclusively the first generation should have happened. Such process can also lead to the destruction of many GCs over the Galactic history (Shin et al. 2008). However old GCs formed about 12 Gyr ago whereas the Galactic disc formed continuously from 10 Gyr ago to the present. As we need an efficient physical mechanism which can act at the early time of GC evolution, disc shocking can be discarded to remove preferentially first generation stars.
Initial gas expulsion by massive stars operates early in the cluster history (a Myr after cluster formation or earlier, Baumgardt et al. 2008b). As the residual gas still present after star formation is removed, the potential well of the cluster can be strongly reduced and the outer parts of the cluster can become unbound. This process has already been used successfully by Marks et al. (2008) to explain the challenging correlation between the central concentration and the mass function of GCs as found by De Marchi et al. (2007).
Gas expulsion is expected to proceed on a short timescale similar to the evolution-timescale of massive stars, and will take place well before any changes due to the internal dynamics or the tidal interaction with the host Galaxy, the two processes investigated in this paper. However the results presented in the previous sections only apply for the limiting hypothetical case of a 100% star formation efficiency.
Gas expulsion can occur at two different times: the intra-cluster gas can be washed out by the ionising radiation of OB stars, or later by the energy released by supernovae explosions. As these massive stars are also expected to eject the slowly escaping matter from which the second generation stars form, we have two different chronologies to form a cluster with two chemically distinct populations of low-mass stars depending on the efficiency of the UV radiation to eject the intra-cluster gas. Indeed, in the first case the slow winds of massive stars will accumulate in the cluster centre where no pristine matter will be left while some dilution is expected to occur if the ionising radiation is inefficient to expel the gas from the cluster. This latter case would occur in clusters at the high-mass scale (Baumgardt et al. 2008b). In both cases the second generation stars have to be formed before the supernovae explode.
However the anticorrelation observed between Li and Na (Pasquini et al. 2005) can help us to discriminate between these two possibilities. Indeed some Li is present in stars with abundance anomalies and this has to come from the intra-cluster gas itself as noted above. Therefore gas expulsion in GC that have abundance anomalies is more likely to be due to the supernovae than the UV radiation of massive stars. Such models have been studied by Goodwin (1997). It should also be noted that the slow winds of massive stars will be released at the same time as the ionising flux from O stars, so that it would be difficult to expel the intra-cluster gas while leaving their slow winds untouched. We have thus found a physical reason as to why typically more-massive GCs show more pronounced abundance anomalies (see Fig. 12 in Carretta 2006) as these clusters are more able to keep their residual gas until removal though supernovae (see Fig. 3 in Baumgardt et al. 2008b).
4 Conclusions
We have analysed the dynamical models of Baumgardt & Makino (2003) by selecting two stellar populations according to their specific energies with the aim to explain the high number of stars harbouring abundance anomalies in GCs. The basic idea that we followed is that stars with abundance anomalies stem from a second generation which formed centrally concentrated out of the slow winds of rapidly rotating O stars. We find the following results:
-
•
Stars with low specific energy are initially concentrated toward the cluster centre and progressively diffuse into the outer parts of the cluster as a result of the system attempting to evolve to energy equipartition. About two relaxation times are needed to achieve a complete homogenisation between the two populations corresponding to several Gyr of evolution.
-
•
At early times, stars with high specific energy are preferentially lost from the cluster due to the tidal forces of the host galaxy. Second generation stars are only lost after several Gyr when they have diffused into the outer cluster parts.
-
•
Any radial or dynamical differences between different stellar populations would be erased over the dynamical history of old GCs. Even with strongly different radial distributions, as we assumed in this paper, GCs would today present homogeneous distributions. This finding could be in sharp contrast with other explanations for the chemical enrichment of GCs. A scenario which relies on the encounters between red giant stars and main sequence ones (Suda et al. 2007; Yamada et al. 2008) should produce more second generation stars in the cluster centre due to the high central density. Unfortunately, we presently do not know the true radial distribution of stars with abundance anomalies in GCs.
-
•
The typical timescale for a cluster to lose information of its initial conditions on the angular momentum of stars is similar to the time needed for radial homogenisation. Thus all initial radial and kinematic properties of GCs are lost after about two relaxation times.
-
•
The number ratio between the second and first stellar generation increases by a factor 2.5 during the cluster evolution (see also the results of D’Ercole et al. 2008). The resulting ratio at old age would be too low to explain the ratio of anomalous to standard stars observed in GCs if we assume a standard IMF for the first generation stars.
-
•
The observed ratio would be achieved if the IMF of the first generation were top-heavy. This however would raise the problem of cluster survival (Bekki & Norris 2006).
-
•
To reproduce the observed ratio for an invariant IMF, a more powerful mass-loss mechanism is needed. Residual gas expulsion due to stellar feedback from OB stars is the prime physical candidate occurring on a short enough timescale and mainly removing the outer part of the cluster (Marks et al. 2008). Further investigations in this direction will be addressed in a forthcoming paper.
Acknowledgements.
We thank an anonymous referee for comments that have improved this paper. T. D. acknowledges financial support from swiss FNS.References
- Aarseth (1999) Aarseth, S. J. 1999, PASP, 111, 1333
- Baumgardt (2001) Baumgardt, H. 2001, MNRAS, 325, 1323
- Baumgardt et al. (2008a) Baumgardt, H., de Marchi, G., & Kroupa, P. 2008a, ArXiv e-prints, 806
- Baumgardt et al. (2008b) Baumgardt, H., Kroupa, P., & Parmentier, G. 2008b, MNRAS, 384, 1231
- Baumgardt & Makino (2003) Baumgardt, H. & Makino, J. 2003, MNRAS, 340, 227
- Bedin et al. (2004) Bedin, L. R., Piotto, G., Anderson, J., et al. 2004, ApJ, 605, L125
- Bekki & Norris (2006) Bekki, K. & Norris, J. E. 2006, ApJ, 637, L109
- Bonifacio et al. (2007) Bonifacio, P., Pasquini, L., Molaro, P., et al. 2007, A&A, 470, 153
- Bonnell & Davies (1998) Bonnell, I. A. & Davies, M. B. 1998, MNRAS, 295, 691
- Caloi & D’Antona (2005) Caloi, V. & D’Antona, F. 2005, A&A, 435, 987
- Caloi & D’Antona (2007) Caloi, V. & D’Antona, F. 2007, A&A, 463, 949
- Carretta (2006) Carretta, E. 2006, AJ, 131, 1766
- Carretta et al. (2006) Carretta, E., Bragaglia, A., Gratton, R. G., et al. 2006, A&A, 450, 523
- Carretta et al. (2007) Carretta, E., Bragaglia, A., Gratton, R. G., Lucatello, S., & Momany, Y. 2007, A&A, 464, 927
- Charbonnel (2005) Charbonnel, C. 2005, in IAU Symposium, ed. V. Hill, P. François, & F. Primas, 347–356
- Chen et al. (2007) Chen, L., de Grijs, R., & Zhao, J. L. 2007, AJ, 134, 1368
- D’Antona & Ventura (2007) D’Antona, F. & Ventura, P. 2007, MNRAS, 379, 1431
- De Marchi et al. (2007) De Marchi, G., Paresce, F., & Pulone, L. 2007, ApJ, 656, L65
- Decressin et al. (2007a) Decressin, T., Charbonnel, C., & Meynet, G. 2007a, A&A, 475, 859
- Decressin et al. (2007b) Decressin, T., Meynet, G., Charbonnel, C., Prantzos, N., & Ekström, S. 2007b, A&A, 464, 1029
- Denisenkov & Denisenkova (1989) Denisenkov, P. A. & Denisenkova, S. N. 1989, Astronomicheskij Tsirkulyar, 1538, 11
- Denisenkov & Denisenkova (1990) Denisenkov, P. A. & Denisenkova, S. N. 1990, Soviet Astronomy Letters, 16, 275
- D’Ercole et al. (2008) D’Ercole, A., Vesperini, E., D’Antona, F., McMillan, S. L. W., & Recchi, S. 2008, MNRAS, 1228
- Ekström et al. (2008) Ekström, S., Meynet, G., Maeder, A., & Barblan, F. 2008, A&A, 478, 467
- Ferraro et al. (2004) Ferraro, F. R., Sollima, A., Pancino, E., et al. 2004, ApJ, 603, L81
- Fukushige & Heggie (2000) Fukushige, T. & Heggie, D. C. 2000, MNRAS, 318, 753
- Galliano et al. (2008) Galliano, E., Alloin, D., Pantin, E., et al. 2008, ArXiv e-prints, 807
- Goodwin (1997) Goodwin, S. P. 1997, MNRAS, 286, 669
- Gouliermis et al. (2004) Gouliermis, D., Keller, S. C., Kontizas, M., Kontizas, E., & Bellas-Velidis, I. 2004, A&A, 416, 137
- Gratton et al. (2004) Gratton, R., Sneden, C., & Carretta, E. 2004, ARA&A, 42, 385
- Hurley et al. (2000) Hurley, J. R., Pols, O. R., & Tout, C. A. 2000, MNRAS, 315, 543
- Jurcsik (1998) Jurcsik, J. 1998, ApJ, 506, L113
- Kroupa (2001) Kroupa, P. 2001, MNRAS, 322, 231
- Kustaanheimo & Stiefel (1965) Kustaanheimo, P. & Stiefel, E. L. 1965, J. Reine Angew. Math., 218, 204
- Langer & Hoffman (1995) Langer, G. E. & Hoffman, R. D. 1995, PASP, 107, 1177
- Lee et al. (1999) Lee, Y.-W., Joo, J.-M., Sohn, Y.-J., et al. 1999, Nature, 402, 55
- Marks et al. (2008) Marks, M., Kroupa, P., & Baumgardt, H. 2008, ArXiv e-prints, 803
- Mikkola & Aarseth (1990) Mikkola, S. & Aarseth, S. J. 1990, Celestial Mechanics and Dynamical Astronomy, 47, 375
- Mikkola & Aarseth (1993) Mikkola, S. & Aarseth, S. J. 1993, Celestial Mechanics and Dynamical Astronomy, 57, 439
- Milone et al. (2008) Milone, A. P., Bedin, L. R., Piotto, G., et al. 2008, ApJ, 673, 241
- Norris (2004) Norris, J. E. 2004, ApJ, 612, L25
- Norris & Da Costa (1995) Norris, J. E. & Da Costa, G. S. 1995, ApJ, 447, 680
- Norris et al. (1997) Norris, J. E., Freeman, K. C., Mayor, M., & Seitzer, P. 1997, ApJ, 487, L187+
- Norris et al. (1996) Norris, J. E., Freeman, K. C., & Mighell, K. J. 1996, ApJ, 462, 241
- Pancino et al. (2000) Pancino, E., Ferraro, F. R., Bellazzini, M., Piotto, G., & Zoccali, M. 2000, ApJ, 534, L83
- Pancino et al. (2007) Pancino, E., Galfo, A., Ferraro, F. R., & Bellazzini, M. 2007, ApJ, 661, L155
- Pasquini et al. (2005) Pasquini, L., Bonifacio, P., Molaro, P., et al. 2005, A&A, 441, 549
- Pilachowski et al. (1982) Pilachowski, C., Leep, E. M., Wallerstein, G., & Peterson, R. C. 1982, ApJ, 263, 187
- Piotto et al. (2007) Piotto, G., Bedin, L. R., Anderson, J., et al. 2007, ApJ, 661, L53
- Piotto et al. (2005) Piotto, G., Villanova, S., Bedin, L. R., et al. 2005, ApJ, 621, 777
- Prantzos & Charbonnel (2006) Prantzos, N. & Charbonnel, C. 2006, A&A, 458, 135
- Prantzos et al. (2007) Prantzos, N., Charbonnel, C., & Iliadis, C. 2007, A&A, 470, 179
- Salpeter (1955) Salpeter, E. E. 1955, ApJ, 121, 161
- Shin et al. (2008) Shin, J., Kim, S. S., & Takahashi, K. 2008, MNRAS, 386, L67
- Smith (2006) Smith, G. H. 2006, PASP, 118, 1225
- Sollima et al. (2005a) Sollima, A., Ferraro, F. R., Pancino, E., & Bellazzini, M. 2005a, MNRAS, 357, 265
- Sollima et al. (2005b) Sollima, A., Pancino, E., Ferraro, F. R., et al. 2005b, ApJ, 634, 332
- Spitzer (1987) Spitzer, L. 1987, Dynamical evolution of globular clusters (Princeton, NJ, Princeton University Press, 1987, 191 p.)
- Suda et al. (2007) Suda, T., Tsujimoto, T., Shigeyama, T., & Fujimoto, M. Y. 2007, ApJ, 671, L129
- Townsend et al. (2004) Townsend, R. H. D., Owocki, S. P., & Howarth, I. D. 2004, MNRAS, 350, 189
- van de Ven et al. (2006) van de Ven, G., van den Bosch, R. C. E., Verolme, E. K., & de Zeeuw, P. T. 2006, A&A, 445, 513
- Villanova et al. (2007) Villanova, S., Piotto, G., King, I. R., et al. 2007, ApJ, 663, 296
- Wallerstein et al. (1987) Wallerstein, G., Leep, E. M., & Oke, J. B. 1987, AJ, 93, 1137
- Yamada et al. (2008) Yamada, S., Okazaki, A. T., & Fujimoto, M. Y. 2008, ArXiv e-prints, 801
- Yim & Lee (2002) Yim, K.-J. & Lee, H. M. 2002, Journal of Korean Astronomical Society, 35, 75