Chandra measurements of non-thermal-like X-ray emission from massive, merging, radio-halo clusters
Abstract
We report the discovery of spatially-extended, non-thermal-like emission components in Chandra X-ray spectra for five of a sample of seven massive, merging galaxy clusters with powerful radio halos. The emission components can be fitted by power-law models with mean photon indices in the range . A control sample of regular, dynamically relaxed clusters, without radio halos but with comparable mean thermal temperatures and luminosities, shows no compelling evidence for similar components. Detailed X-ray spectral mapping reveals the complex thermodynamic states of the radio halo clusters. Our deepest observations, of the Bullet Cluster 1E 0657-56, demonstrate a spatial correlation between the strongest power-law X-ray emission, highest thermal pressure, and brightest 1.34GHz radio halo emission in this cluster. We confirm the presence of a shock front in the 1E 0657-56 and report the discovery of a new, large-scale shock front in Abell 2219. We explore possible origins for the power-law X-ray components. These include inverse Compton scattering of cosmic microwave background photons by relativistic electrons in the clusters; bremsstrahlung from supra-thermal electrons energized by Coulomb collisions with an energetic, non-thermal proton population; and synchrotron emission associated with ultra-relativistic electrons. Interestingly, we show that the power-law signatures may also be due to complex temperature and/or metallicity structure in clusters particularly in the presence of metallicity gradients. In this case, an important distinguishing characteristic between the radio halo clusters and control sample of predominantly cool-core clusters is the relatively low central X-ray surface brightness of the former. Our results have implications for previous discussions of soft excess X-ray emission from clusters and highlight the importance of further deep X-ray and radio mapping, coupled with new hard X-ray, -ray and TeV observations, for improving our understanding of the non-thermal particle populations in these systems.
keywords:
X-rays: galaxies: clusters – galaxies: clusters: individual: 1E 0657-56, A665, A2163, A2255, A2319, A2744, A2219, A576, A1795, A2204, A478, A2029 – radiation mechanisms: non-thermal – intergalactic medium – magnetic fields1 Introduction
Combined X-ray, optical and radio studies of massive, X-ray luminous galaxy clusters demonstrate a clear correlation between the presence of spatially extended radio halo emission and strong, recent merger activity (eg. Buote 2001; Schuecker et al. 2001; Govoni et al. 2001; Giovannini & Feretti 2002). The observed radio halo emission is synchrotron radiation from relativistic electrons, thought to have been re-accelerated by turbulence and/or shocks resulting from merger activity (eg. Ensslin et al. 1998; Bykov et al. 2000; Brunetti et al. 2001; Ensslin & Brüggen 2002; Petrosian 2003; Brunetti et al. 2004; Brunetti & Blasi 2005; Feretti 2005; Cassano, Brunetti & Setti 2006; Cassano et al. 2007; Brunetti & Lazarian 2007; Pfrommer 2008; Pfrommer, Ensslin & Springel 2008; Wolfe & Melia 2008; Petrosian & Bykov 2008). The surface brightness of the radio halo emission is typically low (of order Jy per arcsec2) but can span regions of a Mpc or more in size (eg. Feretti 2005; Feretti et al. 2005).
The same population of relativistic electrons responsible for the radio halo emission is also expected to produce non-thermal X-ray emission via Inverse Compton (IC) scattering of the Cosmic Microwave Background (CMB). In principle, the combination of radio and IC X-ray flux measurements can then be used to determine, or even map, the magnetic field strength in merging clusters (eg. Rephaeli 1979; Fusco-Femiano et al. 1999; Eckert et al. 2008). However, other processes can also contribute to a non-thermal-like X-ray emission signature,000 By non-thermal-like X-ray emission, we mean emission over and above that expected from the diffuse, ambient cluster gas that can be approximated by a power-law. including shocks (which can temporarily heat regions of massive, merging clusters to temperatures of tens of keV e.g. Markevitch & Vikhlinin 2007 and references therein; see also Komatsu et al. 2001; Allen et al. 2002), a range of non-thermal bremsstrahlung processes (eg. Ensslin, Lieu & Biermann 1999; Sarazin & Kempner 2000; Petrosian 2001; Liang et al. 2002; Dogiel et al. 2007; Wolfe & Melia 2008) and synchrotron emission by ultra-relativistic electrons and positrons (Timokhin, Aharonian & Neronov 2004; Inoue, Aharonian & Sugiyama 2005). Distinguishing such emission components in the presence of potentially complicated astrophysical and instrumental backgrounds, and the luminous, diffuse, ambient thermal X-ray emission from clusters, is challenging.
At hard X-ray wavelengths, a detection of non-thermal X-ray emission from the nearby Coma Cluster has been reported by Fusco-Femiano et al. (1999; see also Fusco-Femiano et al. 2004) using BeppoSAX Phoswich Detection System (PDS) observations. The Coma cluster contains a powerful, extended radio halo and, being one of the nearest, X-ray brightest clusters, is an excellent candidate for the detection of IC X-ray emission. However, complexities associated with modelling the PDS data have led Rossetti & Molendi 2004 (see also Rossetti & Molendi 2007) to question the significance of this detection (but see also Fusco-Femiano, Landi & Orlandini 2007). Rephaeli, Gruber & Blanco (1999) and Rephaeli & Gruber (2002) also report a detection of non-thermal X-ray emission from the Coma cluster, based on Rossi X-ray Timing Explorer (RXTE) data. However, the large angular beam of the RXTE instruments also makes it difficult to disentangle true non-thermal emission components from spatial variations in the spectrum of the diffuse intracluster gas. More recent observations of the Coma Cluster with , /BAT and Suzaku, argue that there is no significant non-thermal X-ray emission at high energies in the Coma cluster (see Renaud et al. 2006; Ajello et al. 2009; Wik et al. 2009). Eckert et al. (2008) report a detection of hard X-ray emission from the Ophiuchus cluster using observations made with the satellite. However, more recent /BAT and Suzaku analyses of the cluster do not confirm this result (Ajello et al. 2009; Fujita et al. 2008). Clearly the situation with regard to hard X-ray emission from clusters remains uncertain and more and better data are required.
Soft X-ray (energy keV) and far ultraviolet observations offer another avenue to search for non-thermal X-ray emission. However, measurements at these wavelengths require precise background modelling and detailed knowledge of the thermal emission spectrum and Galactic column density along the line of sight (eg. Fabian 1996). Although strong arguments have been made for the presence of excess UV/soft X-ray emission in the Coma Cluster (eg. Lieu et al. 1996; Bowyer, Berghöfer & Korpela 1999; Arabadjis & Bregman 2000; Bonamente et al. 2001a; Bonamente et al. 2003; Finoguenov et al. 2003; Bowyer et al. 2004), for other systems, claims of diffuse UV emission over and above that expected from the intracluster plasma, remain controversial (see eg. Bregman & Lloyd-Davies 2006; see also Durret et al. 2008).
New and forthcoming -ray and hard X-ray missions such as the Fermi Gamma-ray Space Telescope (Fermi) and the Nuclear Spectroscopic Telescope Array (NuSTAR) should shed much light on the non-thermal and quasi-thermal particle populations in galaxy clusters. However, at present, arguably the best waveband in which to search for non-thermal and quasi-thermal emission signatures in galaxy clusters remains the keV energy range covered by major X-ray observatories such as Chandra and XMM-Newton. In particular, the Chandra X-ray Observatory offers excellent spatial resolution, good spectral resolution, is well calibrated and has a well understood instrumental background. The Chandra observing band extends down to energies soft enough to allow Galactic column densities to be measured precisely, and is wide enough that ‘non-thermal’ X-ray emission (be it true power-law-like emission or complexities in the thermal emission spectrum) can, in principle, be detected. In particular, detailed spatially-resolved X-ray spectroscopy with Chandra minimizes systematic uncertainties associated with spatial variations in the thermal spectrum of the diffuse cluster gas (although, as we show here, does not eliminate them). Such considerations have motivated the present study, in which we have used Chandra to carry out detailed spatially-resolved spectral mapping of the most X-ray luminous merging, radio halo clusters known, with the goal of searching for quasi-thermal and/or non-thermal X-ray emission.
The structure of this paper is as follows. In Section 2, we describe the target selection, data reduction, region selection, and spectral analysis. Section 3 summarizes the evidence for complex non-thermal-like X-ray emission components in the radio-halo clusters. Section 4 reports results from detailed thermodynamic mapping of the clusters, with particular emphasis paid to the two deepest observations, of the Bullet Cluster, 1E 0657-56, and the relaxed, control cluster Abell 2029. Section 5 discusses the possible origins of the observed complex X-ray components. Section 6 summarizes our conclusions. A CDM cosmological model with km s-1 Mpc-1, , and is assumed throughout.
2 X-Ray Observations and Analysis
| Name | z | Obs. ID | Detector | Mode | Exposure (ks) | Observation Date | ||
| RADIO HALO CLUSTERS | ||||||||
| Abell 2319 | 0.056 | 3231 | ACIS-I | VFAINT | 14.4 | Mar. 14 2002 | ||
| Abell 2255 | 0.0809 | 894 | ACIS-I | FAINT | 38.2 | Oct. 20 2000 | ||
| Abell 665 | 0.182 | 3586 | ACIS-I | VFAINT | 15.9 | Dec. 28 2002 | ||
| Abell 2163 | 0.203 | 1653 | ACIS-I | VFAINT | 62.4 | Jun. 16 2001 | ||
| Abell 2219 | 0.228 | 896 | ACIS-S | FAINT | 41.3 | Mar. 31 2000 | ||
| 1E 0657-56 (1) | 0.297 | 5356 | ACIS-I | VFAINT | 96.2 | Aug. 11 2004 | ||
| 1E 0657-56 (2) | ” | 3184 | ACIS-I | VFAINT | 82.4 | Jul. 12 2002 | ||
| 1E 0657-56 (3) | ” | 5361 | ACIS-I | VFAINT | 82.1 | Aug. 17 2004 | ||
| 1E 0657-56 (4) | ” | 5357 | ACIS-I | VFAINT | 78.3 | Aug. 14 2004 | ||
| 1E 0657-56 (5) | ” | 4984 | ACIS-I | VFAINT | 75.9 | Aug. 19 2004 | ||
| 1E 0657-56 (6) | ” | 4986 | ACIS-I | VFAINT | 40.7 | Aug. 25 2004 | ||
| 1E 0657-56 (7) | ” | 5358 | ACIS-I | VFAINT | 31.7 | Aug. 15 2004 | ||
| 1E 0657-56 (8) | ” | 4985 | ACIS-I | VFAINT | 24.0 | Aug. 23 2004 | ||
| 1E 0657-56 (9) | ” | 5355 | ACIS-I | VFAINT | 22.3 | Aug. 10 2004 | ||
| Abell 2744 | 0.308 | 2212 | ACIS-S | VFAINT | 20.8 | Sep. 3 2001 | ||
| Abell 2744 | ” | 7915 | ACIS-I | VFAINT | 14.5 | Nov. 11 2006 | ||
| Abell 2744 | ” | 8477 | ACIS-I | VFAINT | 42.3 | Jun. 10 2007 | ||
| Abell 2744 | ” | 8557 | ACIS-I | VFAINT | 23.5 | Jun. 14 2007 | ||
| NON-RADIO HALO CLUSTERS | ||||||||
| Abell 576 | 0.0381 | 3289 | ACIS-S | VFAINT | 24.7 | Oct. 27 2002 | ||
| Abell 1795 (1) | 0.0634 | 3666 | ACIS-S | VFAINT | 13.2 | Jan. 18 2004 | ||
| Abell 1795 (2) | ” | 5287 | ACIS-S | VFAINT | 14.3 | Jun. 10 2002 | ||
| Abell 1795 (3) | ” | 5289 | ACIS-I | VFAINT | 9.6 | Jan. 14 2004 | ||
| Abell 2029 (1) | 0.0779 | 891 | ACIS-S | FAINT | 18.7 | Apr. 12 2000 | ||
| Abell 2029 (2) | ” | 4977 | ACIS-S | FAINT | 74.8 | Jan. 8 2004 | ||
| Abell 2029 (3) | ” | 6101 | ACIS-I | VFAINT | 8.2 | Dec. 17 2004 | ||
| Abell 478 (1) | 0.088 | 1669 | ACIS-S | FAINT | 39.9 | Jan. 27 2001 | ||
| Abell 478 (2) | ” | 6102 | ACIS-I | VFAINT | 9.2 | Sep. 13 2004 | ||
| Abell 2204 (1) | 0.152 | 499 | ACIS-S | FAINT | 10.0 | Jul. 29 2000 | ||
| Abell 2204 (2) | ” | 6104 | ACIS-I | VFAINT | 9.6 | Sep. 20 2004 | ||
2.1 Sample Selection
Our targets are drawn from the sample of X-ray luminous clusters with large, extended radio halos discussed by Feretti & Giovannini (2007). These clusters have high quality X-ray data available on the Chandra archive. All of the clusters show clear evidence for recent, major merger activity and none of the clusters exhibits a cooling core (Feretti & Giovannini 2007). In order to minimize systematic uncertainties associated with modelling the background in the Chandra observations, we have imposed a lower redshift limit ; this excludes the Coma Cluster from our study. We also require at least net counts, which excludes CL 0016+1609. Our target list of radio halo clusters includes Abell 665, 2163, 2219, 2255, 2319, 2744, and the Bullet Cluster 1E 0657-56.
As a control, we have also observed five comparably X-ray luminous clusters that are known to contain radio halos: Abell 478, 576, 1795, 2029 and 2204 (Feretti & Giovannini 2007). Most are highly relaxed and contain central cooling cores, although Abell 576 exhibits a more active dynamical state (eg. Dupke et al. 2007; Kempner & David 2004a).
2.2 Data Reduction
The Chandra observations were carried out using the Advanced CCD Imaging Spectrometer (ACIS) between March 2000 and June 2007. The standard level-1 event lists produced by the Chandra pipeline processing were reprocessed using the (version 4.1.1) software package, including the appropriate gain maps and updated calibration products.000Our analysis uses the latest calibration products released in January 2009 as incorporated into version 4.1.1. The results are robust to residual systematic uncertainties in the calibration (see section 3.1). Bad pixels were removed and standard grade selections applied. Where possible, the extra information available in VFAINT mode was used to improve the rejection of cosmic ray events. The data were cleaned to remove periods of anomalously high background using the standard energy ranges and binning methods recommended by the Chandra X-ray Center. The net exposure times after cleaning are summarized in Table 1. Separate photon-weighted response matrices and effective area files were constructed for each region analyzed.
2.3 Spatially-resolved spectroscopy
2.3.1 Contour binning
The individual regions for the spectral analysis were determined using the contour binning method of Sanders (2006), which groups neighboring pixels of similar surface brightness until a desired signal-to-noise threshold is met. For data of the quality discussed here, regions are frequently small enough that the X-ray emission from each can be approximated usefully by a single temperature plasma model. We consider only those regions of the clusters within which the spectra are determined reliably, with conservative allowances for systematic uncertainties in the background subtraction. In detail, we set the outermost radius to be the radius at which the ratio of background-to-total counts in the keV energy range rises to 20 per cent. At this surface brightness threshold, a 10 per cent shift in the background normalization will result in an approximately 10 per cent shift in the temperature of an isothermal plasma model, for both the ACIS-S and ACIS-I detectors. The total number of spectral regions per cluster ranges from three to almost 100. Regions vary in size from a few hundred to approximately ten thousand square arcsec.
For our standard analysis described in Section 3, each independent spectral region contains approximately counts. This is sufficient to determine both the metallicity of the cluster gas and the photon index of a power-law component, where present, to approximately 10 per cent accuracy. The temperature and density of the cluster gas are always determined to higher precision.
In order to generate the detailed thermodynamic maps of temperature, pressure and entropy discussed in Section 4, we have also carried out a second analysis using a finer binning of counts/region. For this second analysis, no variable power-law emission components were included and the metallicity was fixed at the appropriate emission-weighted mean values determined from the counts-per-bin results. The analysis with the finer regions is sufficient to determine the temperature to 10 per cent accuracy for 10 keV gas, or per cent accuracy for the coolest regions in the cores of the dynamically relaxed, non-radio halo clusters.
2.3.2 Background modelling
Searching for non-thermal emission signatures in Chandra spectra requires careful modelling of the astrophysical and instrumental background emission. We have taken care to account for spatial and temporal variations in these components.
Background spectra for the appropriate detector regions were extracted from the blank-sky fields available from the Chandra X-ray Center. These were normalized by the ratio of the observed and blank-sky count rates in the 9.5-12 keV band (the statistical uncertainty in the observed keV flux is less than 5 per cent in all cases).
To enable further refinement of the background models, for each ACIS-S observation, additional spectra were extracted from source-free regions of Chip 5; for ACIS-I observations, additional spectra were extracted from regions of Chips 0-3, as far as possible from the cluster. These spectra were compared with the blank-sky fields in order to check for consistency and, in particular, to identify the presence of additional soft X-ray emission components along the line of sight, and/or scattered solar X-rays. Where excess soft background emission was detected, this was modelled and appropriate additional components included in the spectral analysis described below. Additional soft background emission components were required in the analysis of the July 2002 observation of 1E 0657-56 and for each observation of Abell 2029, 2163, and 2204. Abell 2029 in particular lies behind the North Polar Spur and has clear excess soft background emission visible in the Chandra spectra.
2.3.3 Basic Spectral Analysis
| Model | A | B | C | D |
|---|---|---|---|---|
| A2319 | (10 regions) | |||
| C | - | 18.5 | 75.6 | 61.8 |
| - | 1 | 10 | 11 | |
| 8.09 | 6.8 | 8.09 | 8.09 | |
| - | - | 2.0 | - | |
| - | - | - | ||
| P | - | 4.8 | ||
| A2255 | (4 regions) | |||
| C | - | 10.1 | 25.9 | 28.3 |
| - | 1 | 4 | 5 | |
| 2.50 | 1.1 | 2.50 | 2.50 | |
| - | - | 2.0 | - | |
| - | - | - | ||
| P | - | |||
| A665 | (3 regions) | |||
| C | - | 21.5 | 25.5 | 14.3 |
| - | 1 | 3 | 4 | |
| 4.33 | 0.6 | 4.33 | 4.33 | |
| - | - | 2.0 | - | |
| - | - | - | ||
| P | - | 3.9 | 1.4 | |
| A2163 | (17 regions) | |||
| C | - | - | 54.1 | 22.2 |
| - | - | 17 | 18 | |
| - | 15.0 | 18.3 | ||
| - | - | 2.0 | - | |
| - | - | - | ||
| P | - | - |
The spectra have been analyzed using XSPEC (version 11.3; Arnaud 1996), the MEKAL plasma emission code (Kaastra & Mewe 1993), and the photoelectric absorption models of Balucinska-Church & McCammon (1992). All spectral fits were carried out in the keV energy band. The extended C-statistic available in XSPEC, which allows for background subtraction, was used for all fitting.
The default spectral model (model A) applied to each spatial region consists of a MEKAL plasma model at the redshift of the cluster with the absorbing column density along the line of sight fixed at the Galactic value determined from HI studies (Kalberla et al. 2005).000A comparison of the line-of-sight Galactic column densities to the target clusters determined by the HI study of Kalberla et al. (2005) with the earlier work of Dickey & Lockman (1990) shows good overall agreement, with one notable exception: the Galactic column density for 1E 0657-56 is atom cm-2 in the Dickey & Lockman (1990) study, whereas it is atom cm-2 in the later Kalberla et al. (2005) work. We have adopted the Kalberla et al. (2005) result as the more accurate value. The normalization and temperature in each spatial region are included as free parameters in the fits. For the initial analysis with counts per bin, the metallicity is also allowed to vary independently in each region.
A series of more sophisticated spectral models were also examined and the results compared to those obtained with model A: model B is the same as model A but with the line-of-sight absorption allowed to vary as a single, additional free parameter (linked to a common value across all regions). Model C has Galactic absorption but introduces an additional power-law component into each spectral region: this approximates the spectrum of a range of possible non-thermal or quasi-thermal emission components. The normalization of the power-law component in each region is a separate free parameter. The photon index of the power-law component is initially fixed to a canonical value of . (We later examined models in which the photon index of the power-law component was allowed to vary, either in unison across all regions or in each spatial region independently, see section 3.2).
Finally, model D builds on model A, but introduces a second MEKAL component in each region, with the temperature of the second emission component linked to vary in unison across all regions. For computational reasons, an upper limit on the temperature of this component of 80 keV was imposed. Model D also has the column density fixed at the Galactic value.
Due to degeneracies between parameters for models C and D, we constrain the metallicity in each region to remain within per cent of the values determined with model A. By doing this and keeping the absorbing column density fixed at the Galactic value, we limit the impact of unphysical model solutions.
For Abell 478 and Abell 2163, the line-of-sight absorbing column density is known to differ substantially from the radio HI values of atom cm-2and atom cm-2, respectively (Johnstone et al. 1992; Allen et al. 1993; Pointecouteau et al. 2004; Elbaz et al. 1995). For these clusters, model B is therefore adopted as the default model and models C and D also have the column density included as a free parameter. We caution that for Abell 478, the column density is also known to vary as a function of position (Allen et al. 1993). For this reason and for this cluster alone, the column density was allowed to vary independently in each region studied.
3 Results
3.1 The statistical evidence for non-thermal-like components
| Model | A | B | C | D |
|---|---|---|---|---|
| A2219 | (8 regions) | |||
| C | - | 0.02 | 3.3 | 3.9 |
| - | 1 | 8 | 9 | |
| 1.76 | 1.8 | 1.76 | 1.76 | |
| - | - | 2.0 | - | |
| - | - | - | ||
| P | - | 0.89 | 0.91 | 0.92 |
| 1E 0657-56 | (55 regions) | |||
| C | - | 10.3 | 107.6 | 88.8 |
| - | 1 | 55 | 56 | |
| 4.89 | 4.44 | 4.89 | 4.89 | |
| - | - | 2.0 | - | |
| - | - | - | ||
| P | - | |||
| A2744 | (6 regions) | |||
| C | - | 0.3 | 7.1 | 17.0 |
| - | 1 | 6 | 7 | |
| 1.39 | 1.4 | 1.39 | 1.39 | |
| - | - | 2.0 | - | |
| - | - | - | ||
| P | - | 0.58 | 0.31 | 0.017 |
| Model | A | B | C | D |
|---|---|---|---|---|
| A576 | (4 regions) | (4 regions) | ||
| C | - | 0.6 | 7.5 | 4.5 |
| - | 1 | 4 | 5 | |
| 5.50 | 5.5 | 5.50 | 5.50 | |
| - | - | 2.0 | - | |
| - | - | - | ||
| P | - | 0.44 | 0.11 | 0.48 |
| A1795 | (24 regions) | (8 regions) | ||
| C | - | 0.08 | 31.4 | 24.5 |
| - | 1 | 24 | 9 | |
| 1.19 | 1.19 | 1.19 | ||
| - | - | 2.0 | - | |
| - | - | - | ||
| P | - | 0.77 | 0.14 | |
| A2029 | (90 regions) | (40 regions) | ||
| C | - | 9.1 | 113.0 | 68.8 |
| - | 1 | 90 | 41 | |
| 3.26 | 3.03 | 3.26 | 3.26 | |
| - | - | 2.0 | - | |
| - | - | - | ||
| P | - | 0.051 | ||
| A478 | (37 regions) | (21 regions) | ||
| C | - | - | 45.7 | 28.3 |
| - | - | 37 | 22 | |
| - | ||||
| - | - | 2.0 | - | |
| - | - | - | ||
| P | - | - | 0.15 | 0.17 |
| A2204 | (7 regions) | (3 regions) | ||
| C | - | 6.6 | 1.5 | 5.2 |
| - | 1 | 7 | 4 | |
| 5.67 | 6.4 | 5.67 | 5.67 | |
| - | - | 2.0 | - | |
| - | - | - | ||
| P | - | 0.01 | 0.98 | 0.27 |
Tables 2 and 3 summarize the results from the fits with spectral models A-D for the radio halo clusters and the control sample of non-radio halo systems, respectively. The tables list the total decrease in C-statistic () summed across all regions in each cluster, and the increase in the number of degrees of freedom () for each model with respect to the default model (typically model A, but model B for Abell 478 and 2163), together with the approximate probability, , that such an improvement could be obtained randomly.000To estimate the probability that the improvements to the fits could be obtained by random chance, we have calculated a pseudo statistic, formed by the ratio . This is similar to the usual statistic formed with the chi-square estimator (eg. Bevington 1969), and is expected to provide useful estimates of the probability for cases where the spectral model provides a reasonable description of the data. The tables also list the best-fitting absorbing column density for cases where this is included as a free parameter.
Comparing the results for the simplest single-temperature models, A and B, we see that for four out of six radio halo clusters for which both models were examined, allowing the absorbing column to fit freely leads to a significant improvement in the fit ( for 1 additional degree of freedom). The most significant improvement, , is obtained for Abell 665. In all four of these six cases, however, the best-fit column density is significantly than the Galactic value determined from HI studies, a result that is physically implausible and which suggests that model B does not provide a complete description of the spectra. (For column densities atom cm-2, the Galactic HI values are expected to be accurate to better than 10 per cent). The only two radio halo clusters for which significant improvements (99 per cent confidence) to the fits were not obtained using model B over model A are Abell 2219 and Abell 2744. For the seventh radio halo cluster, Abell 2163, which lies at low Galactic latitude, an accurate Galactic column density estimate is not available from HI studies and model A was therefore not examined; model B is taken as the default model for this cluster.
Importantly, of the control sample of non-radio halo clusters show a comparably significant improvement when using model B over model A.000We have confirmed that consistent results are obtained whether the ACIS-S and ACIS-I data for individual clusters are analyzed separately or together. As discussed above, Abell 478 is excluded from this test since it lies at low Galactic latitude and the estimate of the line-of-sight column density from HI studies is poorly determined. The most statistically significant detection is for Abell 2029, although the background model for this cluster is complex with relatively high systematic uncertainties (Section 2.3.2). It is unlikely that our modelling of the excess soft emission along the line of sight, associated with the North Polar Spur, is correct in detail (we assume it to have constant surface brightness across the field). Note also that the data for this cluster exhibit an exceptionally high signal to noise ratio and the best fit column density is only lower than the Galactic value by atom cm-2.
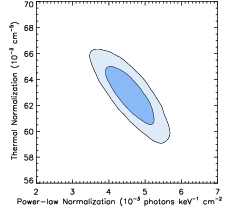
Comparing the results for models C and A, we see that the introduction of a power-law component with photon index leads to comparable or even larger improvements in the fits to the same four radio halo clusters (i.e. those that fitted to sub-Galactic column densities with model B), as well as for Abell 2163, for which a reliable Galactic column density measurement is not available. For Abell 2219, 2744, and for of the relaxed non-radio halo clusters, however, no comparably significant improvement in the fits is obtained with model C over model A. Figure 1 shows the combined power-law normalization versus thermal normalization (in units of ) summed across all regions in Abell 2319. Power-law emission is detected at high significance. The power-law normalization is approximately 10 per cent of the thermal normalization and, thus also, approximately 10 per cent of the total flux.
We conclude, based on the improvements obtained with models B and C, that 5/7 radio halo clusters show evidence for additional model components, over and above those accounted for by the default thermal model. 000Similar conclusions regarding the presence or otherwise of power-law components in the radio halo clusters are obtained when the photon index of the power-law component is also included as a single free parameter. The additional emission components can be approximated by simple power-law models, although we stress that these models are unlikely to provide a complete, physical description of the data. In contrast, the relaxed, non-radio halo systems do not show comparable evidence for such power-law components.
Similar conclusions on the presence or otherwise of non-thermal-like emission in the radio halo clusters are also drawn from the fits with model D, where a second MEKAL component, rather than a power-law model, is incorporated into the modelling (other than for Abell 2163; although this cluster also has the column density included as a free parameter). The nominal temperatures of the additional emission components are typically high, with keV.
As discussed in Section 3.2, the majority of the control sample of relaxed, non-radio halo clusters (all, excluding Abell 576) are known to contain strong temperature gradients in their (cooling) cores. The presence of such gradients will naturally lead to requirements for additional temperature components in fits to projected spectra for the central regions of these systems. To mitigate this effect, for the analysis of the control sample of clusters with model D, we have excluded the inner kpc radius. (The reduced number of regions studied are indicated in column 4 of Table 3.) Of the control sample, Abell 2029 presents a mild requirement for additional temperature components, and Abell 1795 a more significant requirement, with most of the signal arising from within radii kpc in both cases. Possible origins for these requirements are discussed in Section 5.
Finally, to gauge the level at which residual instrument calibration issues may affect the results, we have repeated the analysis in three other energy bands: keV, keV and keV. For the merging, radio halo clusters, similar detections of additional emission components are made using each energy band. The control sample of regular, non-radio halo clusters provides comparable null results in all energy bands studied.
| Cluster | # regions | PL Flux | |||||
| Abell 2319 | 8.09 | 3/10 | |||||
| Abell 2255 | 2.50 | 2/4 | |||||
| Abell 665 | 4.33 | 2/3 | |||||
| Abell 2163 | - | 4/17 | |||||
| Abell 2219 | 1.76 | 0/8 | - | - | |||
| Abell 2744 | 1.39 | 3/6 | |||||
| 1E 0657-56 | 4.89 | 13/55 |
3.2 Detailed spatial mapping of the ‘non-thermal’ components
The results of Section 3.1 provide a simple, statistical measure of the overall significance of non-thermal-like emission signatures in the clusters. However, even where these overall signatures are strong, as in 5/7 of the radio halo clusters, we do not necessarily expect power-law emission components to be present in every region in the clusters. We have therefore attempted to map the spatial variation of this emission.
Starting with model A, a single temperature model with the absorption fixed at the Galactic HI value, we have determined, for each individual region of each cluster, the statistical significance of the improvement to the fit obtained by introducing a power-law component with a photon index that is allowed to fit freely in that region. Where the significance of the improvement was found to exceed a threshold value (we adopt 90 per cent) the power-law component was kept in the model for that region.000We have constrained the metallicity to lie within per cent of the value determined with model A. Similar results are also obtained if the metallicity is simply constrained to be less than solar. Where it was not, model A (single, thermal emission component only) was used as the appropriate region model. In this way, the number of regions requiring power-law emission components in each cluster were determined. Finally, the overall absorbing column density was allowed to vary and checked for consistency against Galactic HI survey results.000 An alternative algorithm to identify regions requiring power-law components was also examined, wherein the column density was allowed to fit freely in each region, although constrained not to vary by more than 50 per cent from the Galactic value. This algorithm led to similar results on the regions requiring power-law emission components. Maps of the surface brightness of the power-law emission, where detected, and the photon index can then be generated in a straightforward manner. By including ‘non-thermal’ emission components only where they are statistically required, we minimize the impact of random errors and residual calibration uncertainties on the maps.
The best fit absorption column densities and mean emission-weighted photon indices determined from the detailed mapping at the 90 per cent threshold are summarized in Table 4. In all cases, the measured column densities are consistent with the Galactic values (Kalberla et al. 2005) at the per cent (2) confidence level. This contrasts with the results obtained with model B (single temperature model) where column densities less than the Galactic value was observed in most cases (Section 3.1).000We have also mapped the spatial variation of the non-thermal-like emission using a more restrictive threshold set at 99 per cent confidence. The best-fit column densities and emission-weighted photon indices obtained from this analysis are broadly consistent with those determined using the 90 per cent threshold, although the column density for 1E 0657-56 is reduced slightly below the Galactic value.
Excluding regions with unphysically low photon indices i.e. , which are almost always detected at very low surface brightness and which can be plausibly associated with residual calibration and background subtraction errors, the mean emission-weighted photon indices for the clusters range from .
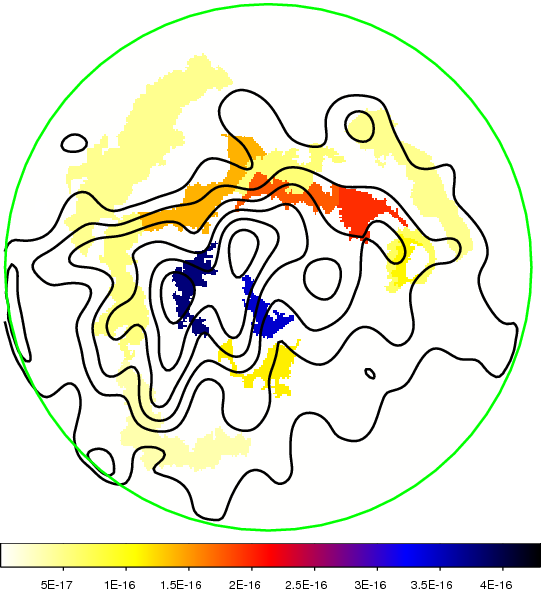
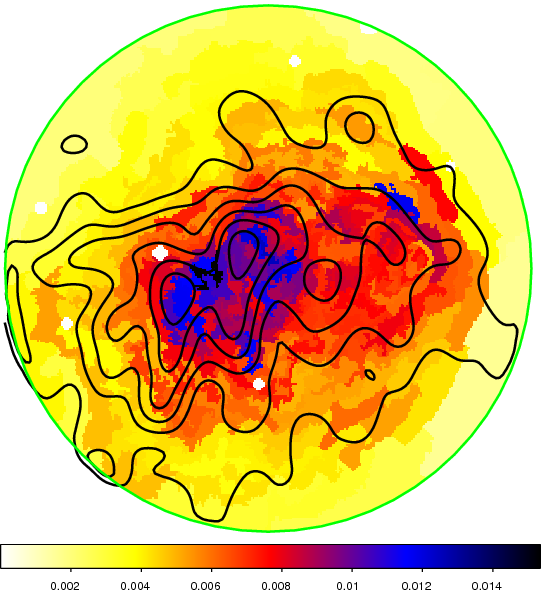
The results for the Bullet Cluster, 1E0657-56, which has the longest Chandra exposure components are shown in Fig 2a. Also shown overlaid in Fig 2a are the contours of constant radio halo brightness from the 1.34 GHz radio data of Liang et al. (2000; radio point sources have been removed). The correspondence between the radio contours and power-law X-ray emission map is interesting. The peaks of the radio halo emission and power-law X-ray emission both occur in the main cluster center. There is also an extension of both emission components, albeit at lower surface brightness, toward the merging ‘bullet’ subcluster. We conclude that there is a correspondence between the locations of the strongest power-law X-ray emission and strongest non-thermal radio emission in the cluster.
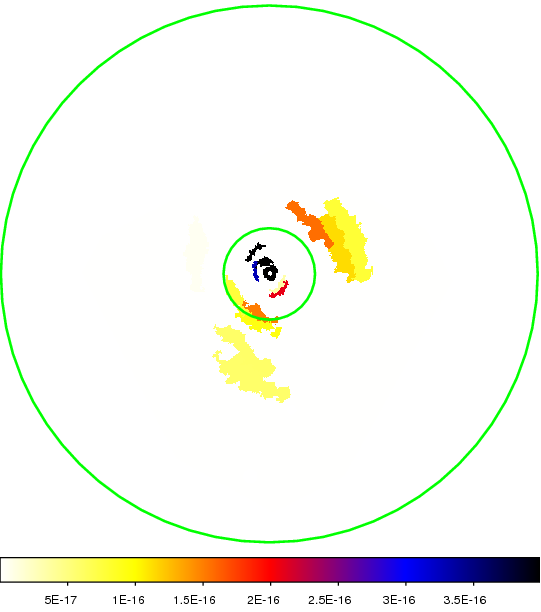
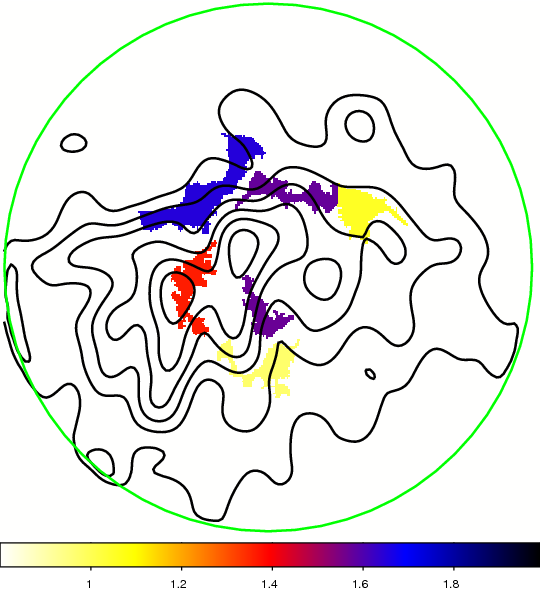
Fig 2b shows the spatial variation of the photon index of the power-law X-ray emission in 1E 0657-56, again with the radio contours overlaid. The regions of strongest power-law flux have a photon index . Regions with photon index , all of which are detected at relatively low surface brightness, , are probably unphysical. Summing the total flux of all power-law components detected at a confidence level of 90 per cent or greater and with a photon index , we obtain a total keV power law flux from 1E 0657-56 of ergs s-1 cm-2 and an emission-weighted photon index of . Extrapolating this result to the keV band, we predict a flux of ergs s-1 cm-2, consistent with the result of Petrosian et al. (2006) of ergs s-1 cm-2 based on RXTE and XMM-Newton X-ray data.
We have applied a similar mapping analysis to our control sample of non-radio halo clusters. Fig 3 shows the results for Abell 2029, which has a deep exposure and the most accumulated X-ray counts of any cluster in the study. We have scaled the surface brightness of the power-law emission in Fig. 3 to the levels that would be detected if the cluster were observed at the same redshift as 1E 0657-56 (assuming an ultra-deep observation with sufficient exposure time to maintain the current signal-to-noise ratio). For relaxed clusters like Abell 2029 at relatively low redshifts, it is important to recall that the temperature profiles are commonly observed to decline steeply in their cores (e.g. Allen, Schmidt & Fabian 2001; Vikhlinin et al. 2005). The analysis of projected spectra in the innermost regions of such clusters will therefore always, given good enough data, provide signatures of multiphase gas, simply due to projection effects.The inner, green circle in Fig. 3 marks a radius of kpc, within which the temperature profile in Abell 2029 is observed to decline steeply. The regions with the most significant detections of power-law components lie within or near this radius; the photon indices of these components are typically flat, with . (See also Section 5.2).
The results for the other, relaxed non-radio halo clusters show no convincing evidence for power-law X-ray emission components beyond their inner regions.
4 Thermodynamic mapping of 1E 0657-56 and Abell 2029
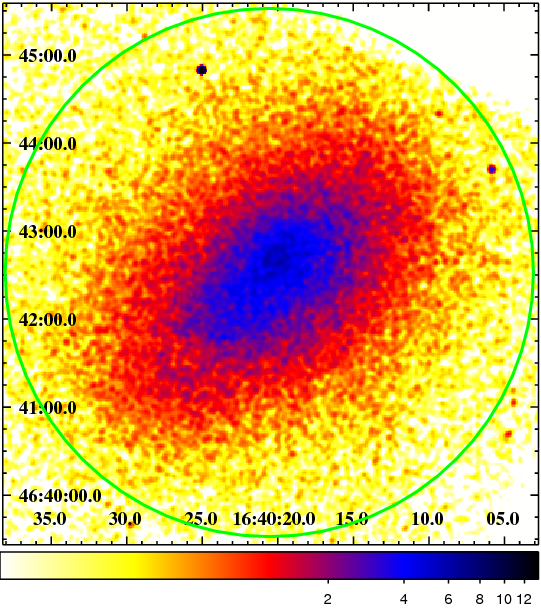
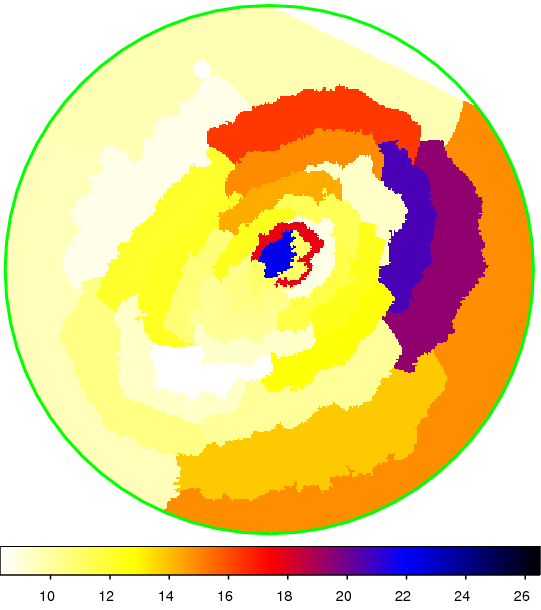
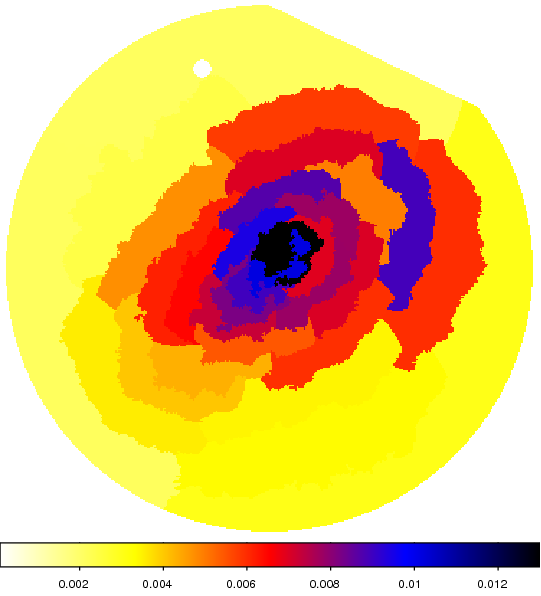
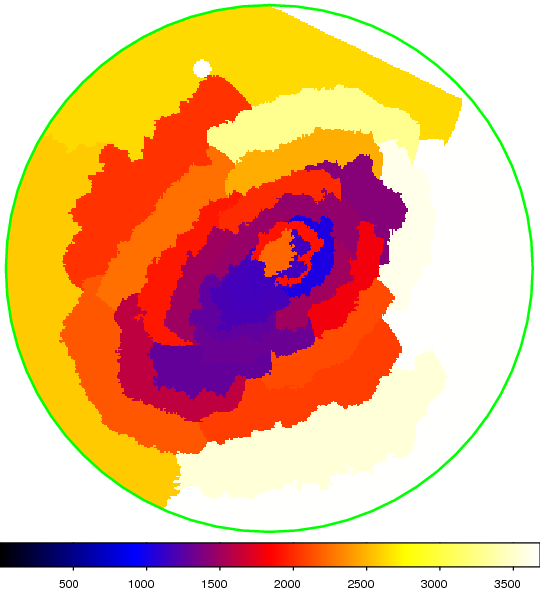
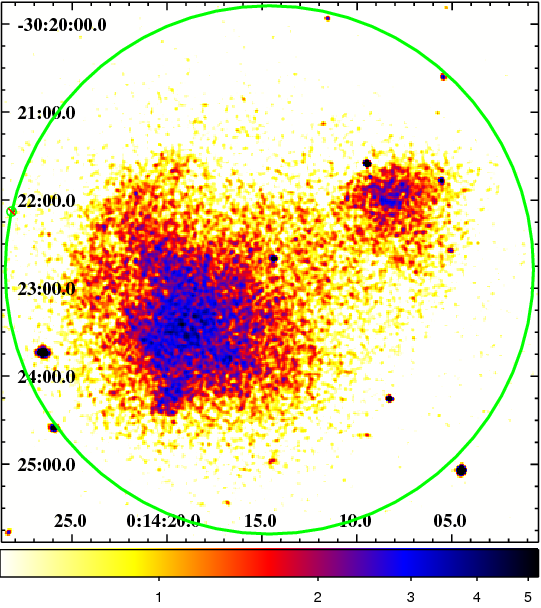
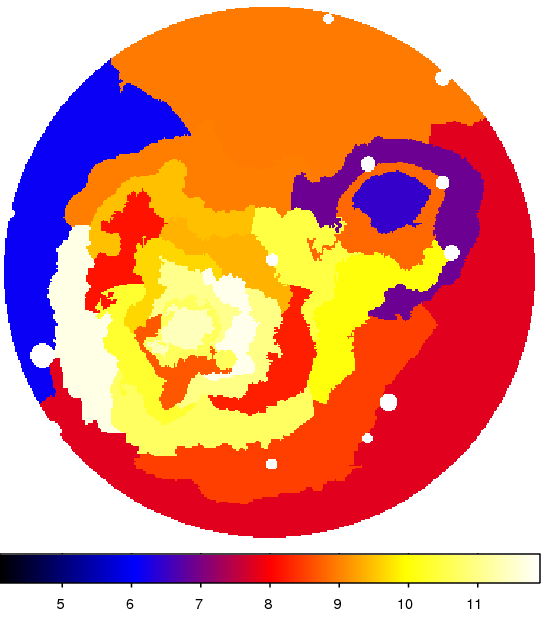
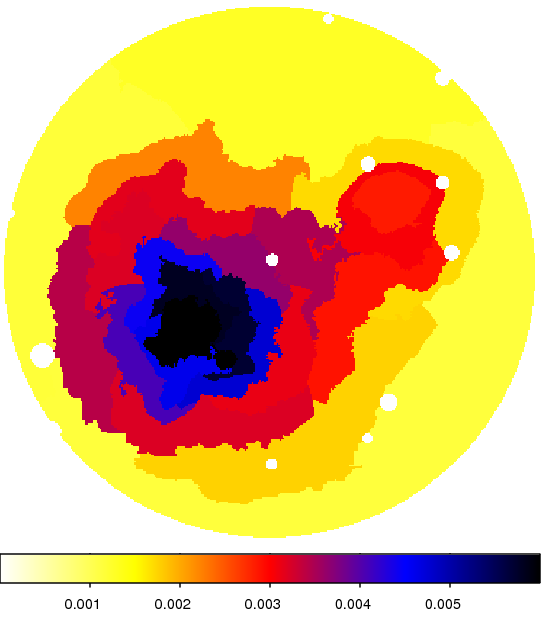
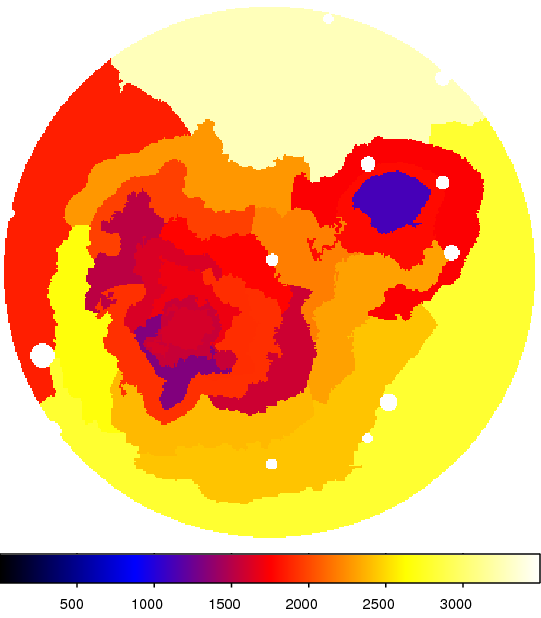
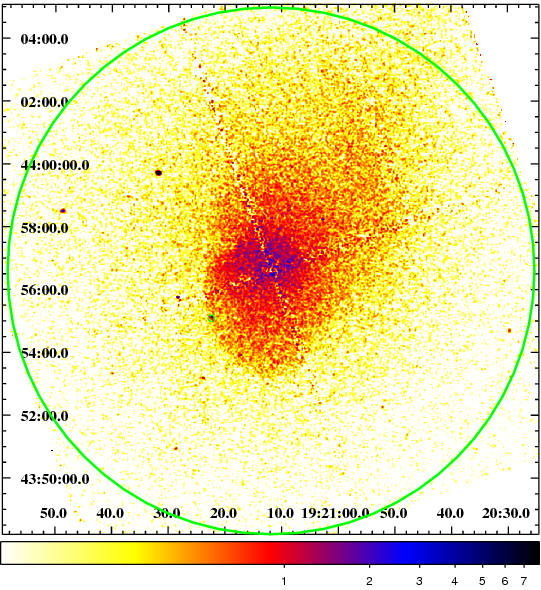
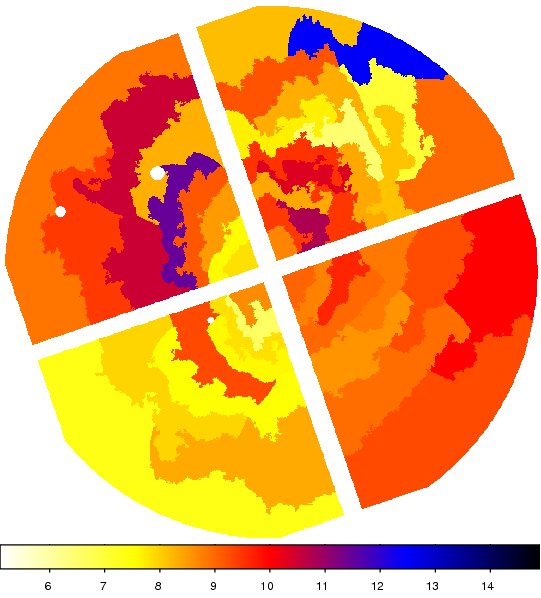
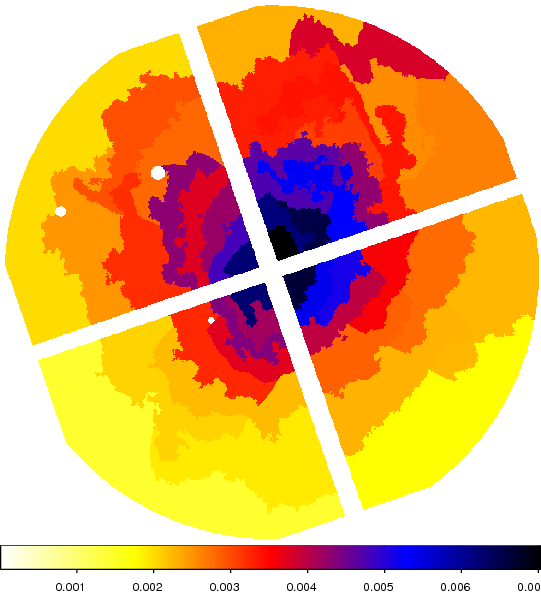
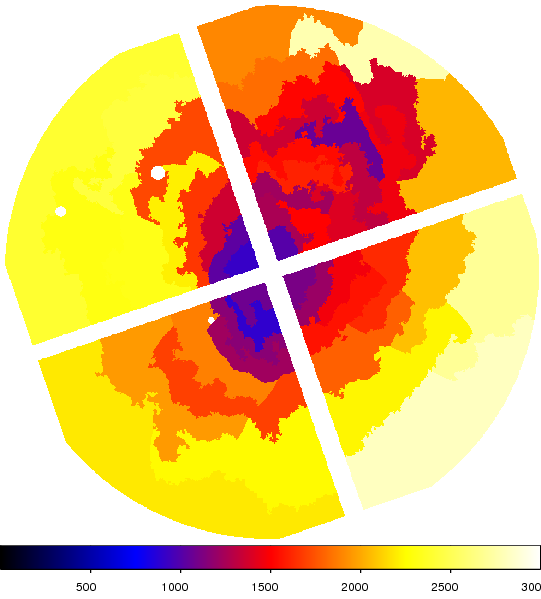
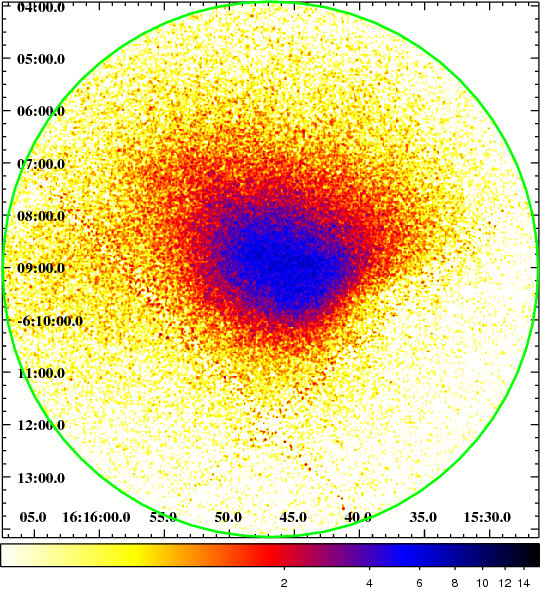
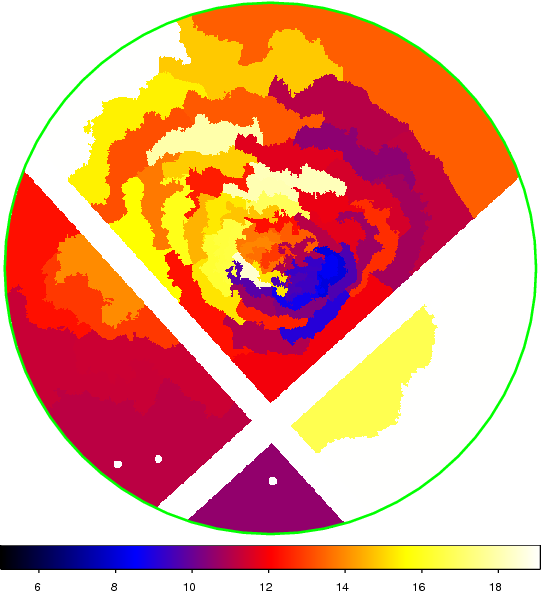
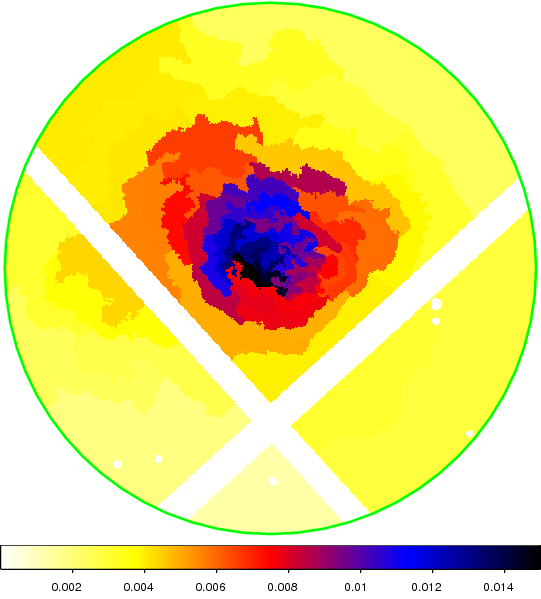
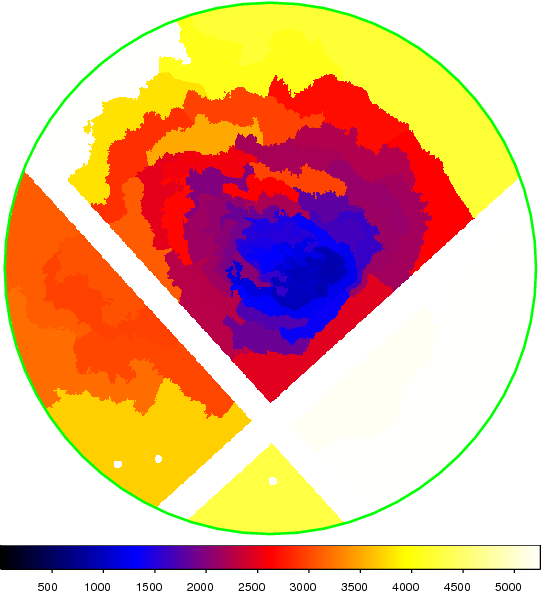
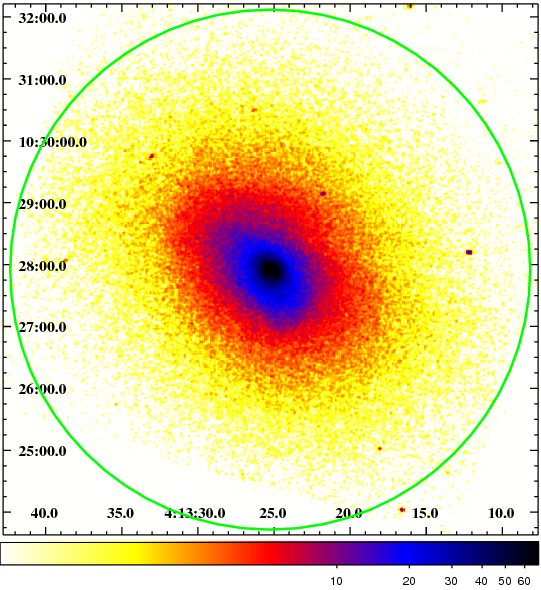
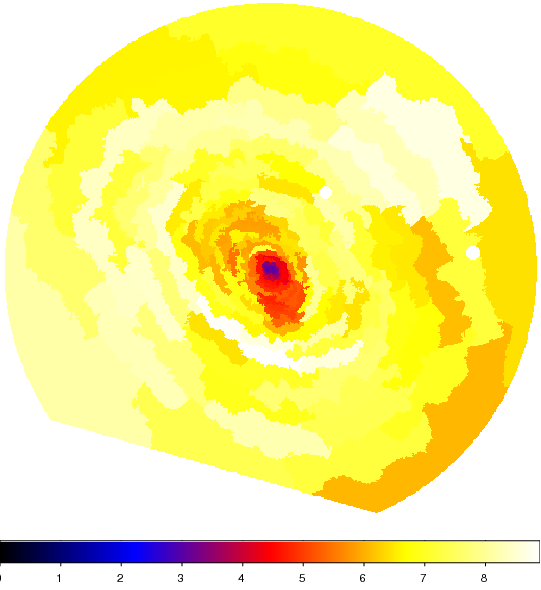
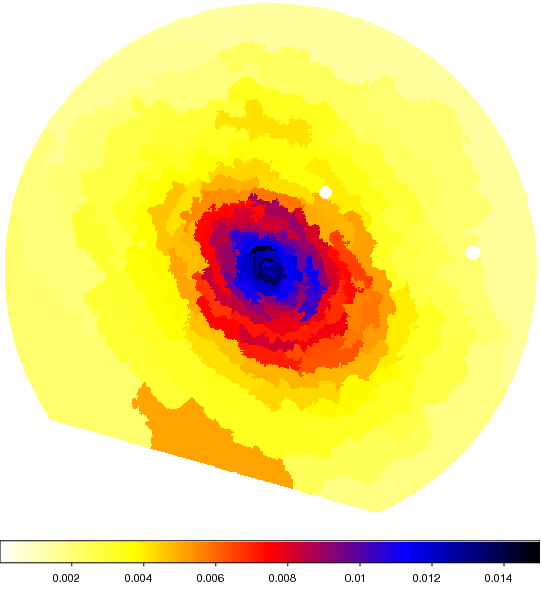
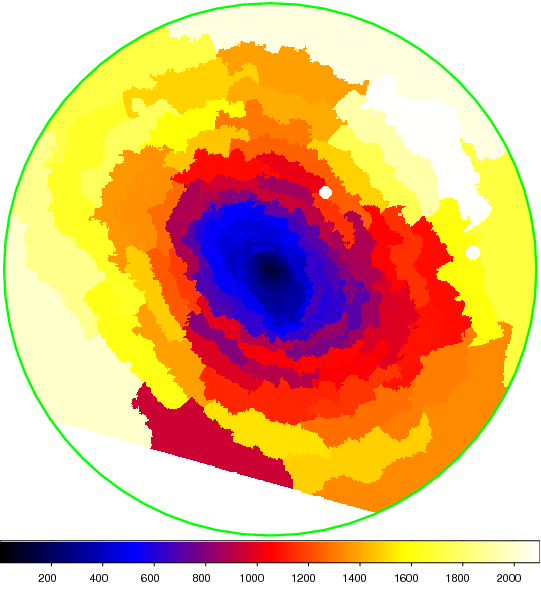
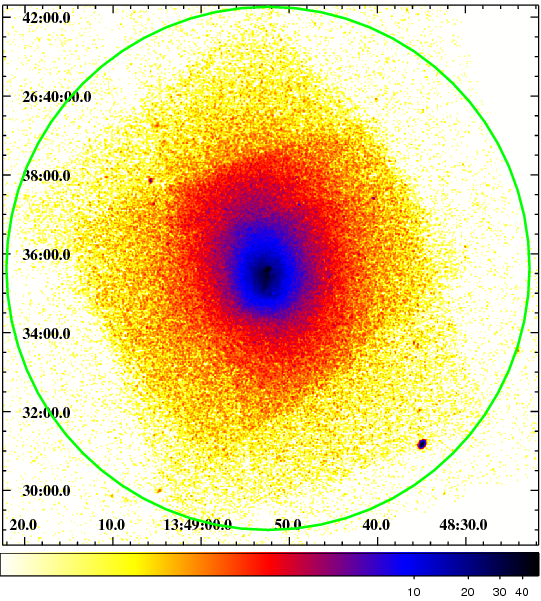
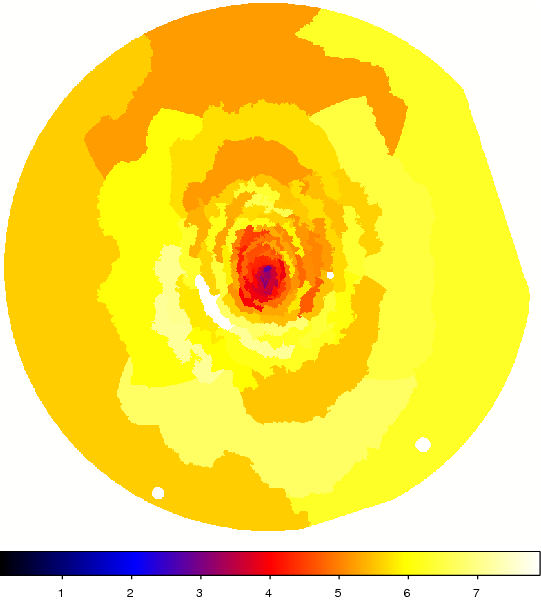
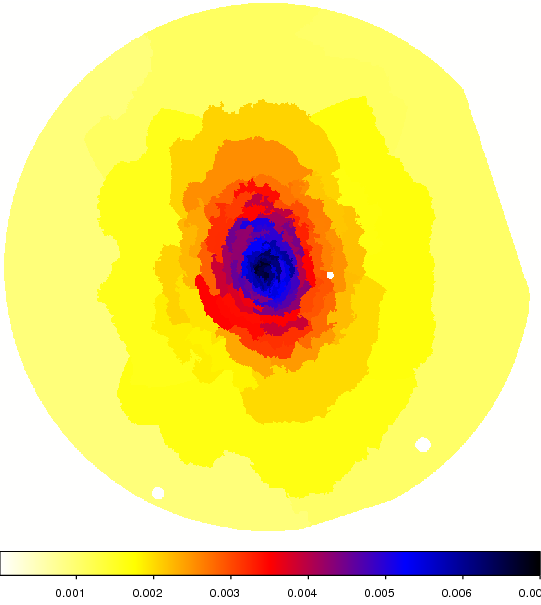
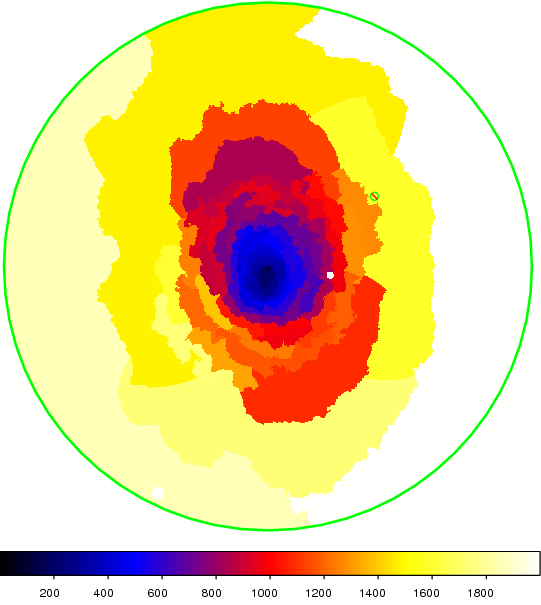
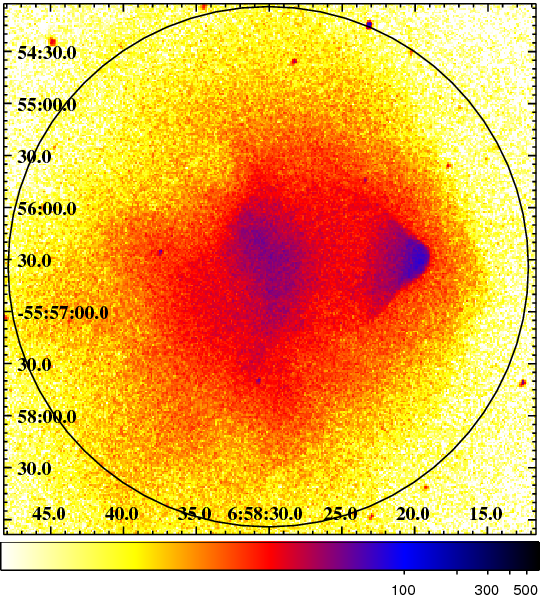
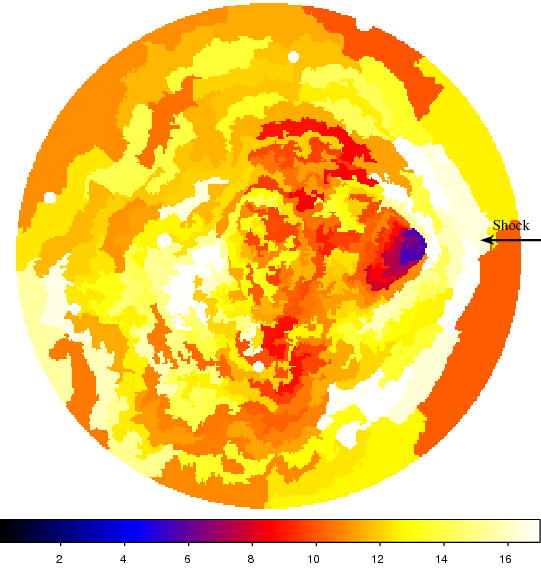
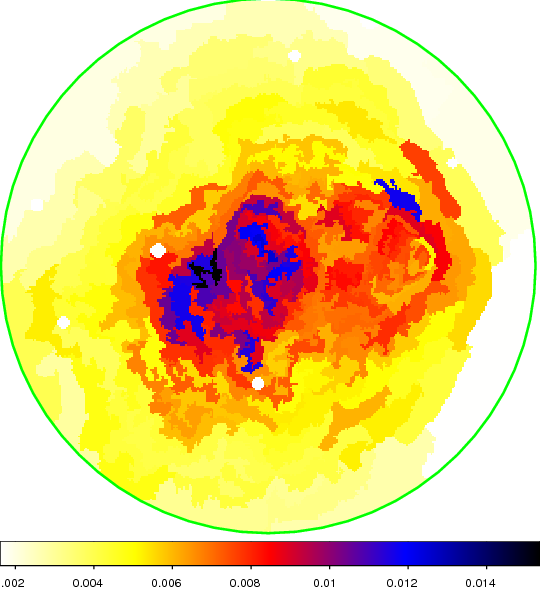
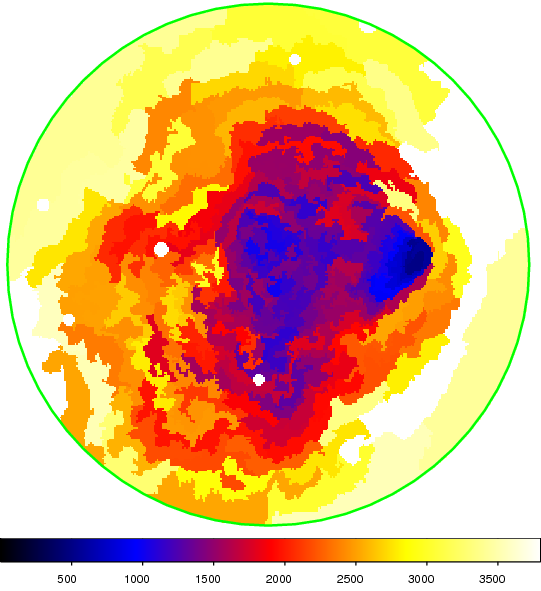
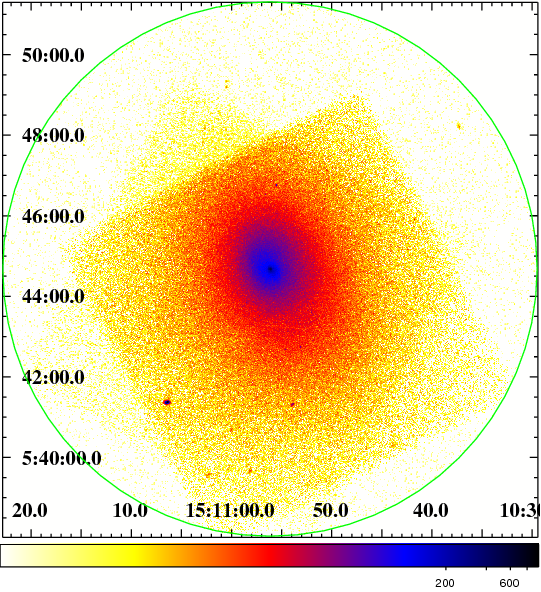
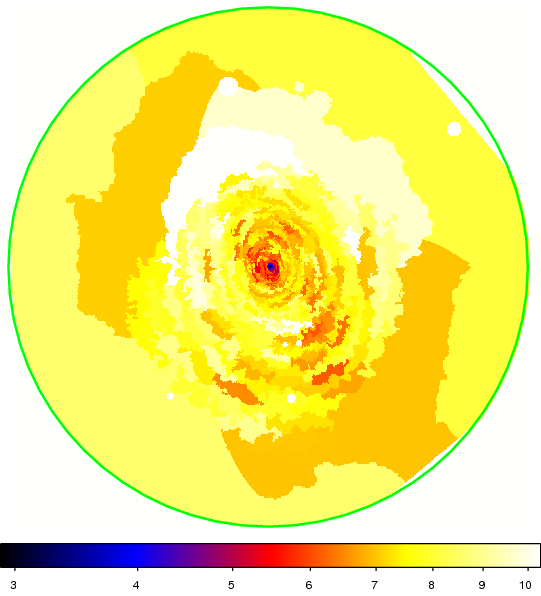
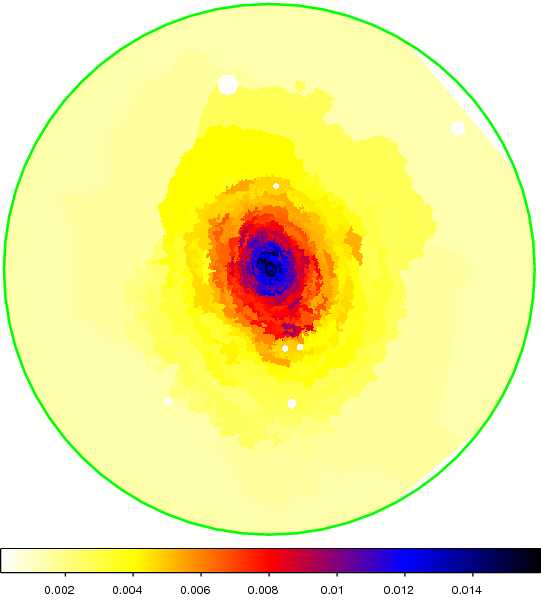
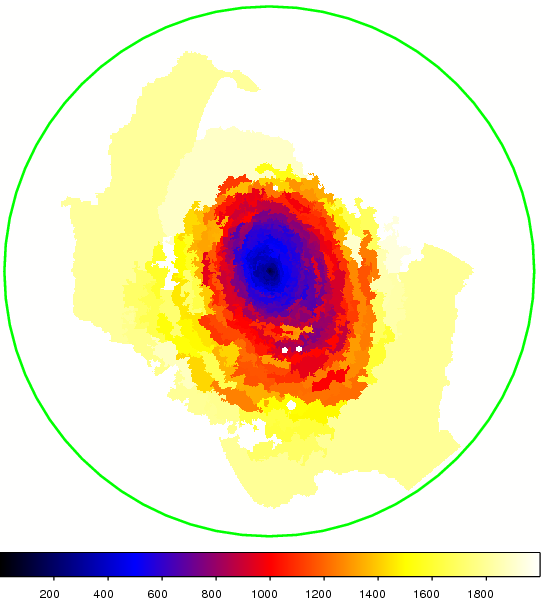
1E 0657-56 and Abell 2029 have the deepest Chandra exposures of the radio halo clusters and control sample of non-radio halo clusters, respectively, and are therefore the systems best-suited to detailed thermodynamic mapping. The Chandra X-ray images and maps of temperature, pressure and entropy for the two clusters are shown in Figs. 4 and 5.
The thermodynamic maps for 1E 0657-56 are complex and confirm that the cluster is far from hydrostatic equilibrium, having experienced a recent, massive merger event. The peak of the thermal X-ray surface brightness is centered on the fast-moving, merging subcluster i.e. the ‘bullet’ (see Markevitch et al. 2002; Markevitch 2006; Markevitch & Vikhlinin 2007 and references therein), rather than the overall X-ray center. The merging subcluster also contains the lowest temperature and lowest entropy gas. However, the regions of highest thermal pressure in the cluster are coincident with the X-ray surface brightness peak, but are rather found near the overall X-ray center. The multiple apparent pressure peaks may be sites of recent and/or ongoing shock activity and might be expected to be locations of ongoing particle acceleration. Fig. 6 shows the 1.34 GHz radio contours overlaid on the same pressure map. The figure confirms that the sites of highest thermal pressure and strongest radio emission are closely correlated (see also Govoni et al. 2004).
The shock front ahead of the merging subcluster in 1E 0657-56 has been studied by Markevitch et al. (2002), Markevitch (2006), and Markevitch & Vikhlinin (2007). This shock is also clearly visible in the thermodynamic maps of Fig. 4. Our analysis of the temperature jump at the shock front indicates a Mach number which corresponds to a velocity of km s-1, consistent with previous work. We note a hint of a second, possible front leading the cool subcluster in Fig. 4b, and trailing the main shock (see also Markevitch & Vikhlinin 2007).
In contrast, for Abell 2029, the thermodynamic maps, and especially the pressure map, appear remarkably symmetric and regular. The cluster is not in equilibrium, as evidenced by detailed structure observed in the X-ray image, especially at small radii (see eg. Clarke, Blanton & Sarazin 2004), as well as the temperature and entropy maps shown here (an extension of low entropy gas is observed arcmin to the southwest). However, the deviations from elliptical symmetry in the pressure map are small and argue that the hydrostatic assumption employed in X-ray mass analyses is likely to be a reasonable approximation in the observed region of the cluster, confirming earlier conclusions drawn on the basis of the X-ray surface brightness distribution alone (eg. Buote & Tsai 1996; Allen et al. 2008). The peak of the X-ray surface brightness coincides precisely with the location of the dominant cluster galaxy, IC 1101. The X-ray peak also marks the location of the lowest temperature and lowest entropy gas in the cluster, and of the highest thermal pressure, a configuration that is convectively stable.
Qualitatively similar results on the thermodynamic properties are obtained if power-law components consistent with those discussed in Section 3.2 are accounted for explicitly in the analysis (although the measured temperatures are, typically, slightly lower). Results from thermodynamic mapping of other clusters in the sample are presented in the Appendix.
5 The origin of the power-law components
5.1 Summary of Results
Our analysis has revealed the presence of significant non-thermal-like X-ray emission in five of a sample of seven massive, merging clusters with luminous radio halos. Our results shed new light on the origin of this emission. The most important, new facts are 1) the presence of such components in a large fraction of the radio halo clusters studied; 2) the absence (or lower detection rate) of such components, at similar levels, in the control sample of non-radio halo clusters; 3) the observed spectra of the non-thermal-like components, which are consistent with simple power-law models with relatively flat photon indices, , or bremsstrahlung emission from hot, keV, gas; and 4) the spatial correlation between the regions of the brightest non-thermal radio halo emission, brightest, thermal X-ray emission, and strongest non-thermal-like X-ray signatures in the central regions of 1E 0657-56 (Fig. 1).
Summarizing the statistical evidence from Section 3, we see that the comparison of results from models B and A provides evidence () for excess soft emission (i.e. less-than-Galactic absorbing column densities) in 4/6 radio halo clusters for which this test is possible. Of the control sample, only Abell 2029 shows mildly significant evidence for a soft excess, which can be plausibly associated with residual uncertainties in the background modelling for this system. Comparing results for models C and A, we see that 5/7 radio halo clusters show evidence for power law components (including the same 4 noted above) whereas, strikingly, 0/5 of the control sample do. The more detailed mapping discussed in Section 3.2 shows that once power law components have been included, where statistically required, the absorbing column densities for the radio halo systems become consistent with the Galactic values determined from HI studies. The results from the tests with model D are somewhat more ambiguous, as might be expected given the additional freedom of this spectral model: 4/7 radio halos show evidence for additional temperature components, as do 2/5 of the control sample.
5.2 Physical Explanations
It has been common in the literature to interpret limits on non-thermal X-ray emission from galaxy clusters in terms of simple IC models, wherein the same population of relativistic electrons responsible for the observed radio halo emission is assumed to Compton scatter CMB photons up into the X-ray band. In this specific scenario, and in the absence of other non-thermal or quasi-thermal X-ray emission components, the combination of radio and IC X-ray flux measurements can be used to estimate the magnetic field strength (eg. Rephaeli 1979; Fusco-Femiano et al. 1999; Blasi & Colafrancesco 1999; Eckert et al. 2008). We have carried out such an analysis for the Bullet Cluster, 1E 0657-56 assuming that the observed power-law X-ray components are entirely due to IC emission. In this case,
| (1) |
where is the number density of electrons with Lorentz factor , , , is the frequency of the X-rays, is the frequency of the up-scattered CMB photons, is the frequency of the measured radio flux, and is the cyclotron frequency. is the energy density of CMB photons at the cluster and is the spectral index of the power-law components.
Within the context of this specific model, we infer a peak B field of 0.15 G associated with the regions of strongest non-thermal-like X-ray emission. Here we have used the photon index for each region as measured from the X-ray data. If we had instead assumed a fixed photon index , then the implied B fields would have been several times higher.
Two factors argue against this simplest IC interpretation. Firstly, the photon indices of the power-law X-ray components are flatter than typical radio halo synchrotron spectra (). This implies, within the context of the IC model, that the same population of electrons are responsible for both the radio and X-ray emission. Secondly, such low magnetic field values and spatial field configurations appear somewhat at odds with Faraday rotation studies that measure fields of a few, to a few tens, of G in clusters, with the strongest fields observed in cluster cores (eg. Kim et al. 1991; Feretti et al. 1995; Taylor et al. 1999, 2001, 2002, 2006, Clarke, Kronberg & Böhringer 2001; Allen et al. 2001; Govoni & Feretti 2004).
Theoretically, the spectrum of electrons with Lorentz factor responsible for IC X-ray emission can be flatter than those responsible for the GHz radio emission. Indeed, this appears to be a general prediction of more detailed calculations of the coupled, time-dependent properties of electrons, hadrons and plasma waves in a turbulent intracluster medium, such as will be generated following a major merger event (eg. Brunetti et al. 2004; Brunetti & Blasi 2005; Petrosian & Bykov 2008). A number of authors have also argued that the discrepancies between Faraday rotation and IC estimates of the magnetic field may be reconciled (or at least reduced) by employing more realistic distributions for the non-thermal particles and magnetic fields (eg. Petrosian 2001; Carilli & Taylor 2002; Newman, Newman & Rephaeli 2002; Kuo et al. 2003; Brunetti et al. 2004; Govoni & Feretti 2004). Thus, although the simplest IC scenario described by equation 1 is challenged by our results, more sophisticated treatments may prove consistent with the data.
A second, alternative interpretation for the observed power-law X-ray components is bremsstrahlung emission from supra-thermal electrons, energized by collisions with an energetic non-thermal proton population in the clusters (Liang et al. 2002; Dogiel et al. 2007; Wolfe & Melia 2008; see also Ensslin et al. 1999, Sarazin & Kempner 2000, Blasi 2000). The observed spectra appear consistent with this model, although physical challenges remain (eg. Petrosian & Bykov 2008; Petrosian & East 2008).
Thirdly, it remains possible that a contribution to the observed non-thermal-like X-ray flux could arise from synchrotron emission from ultra-relativistic electrons and positrons, which would also be characterized by hard power-law spectra (; Inoue et al. 2005). In this case, however, one might expect the hard X-ray emission to be brighter in the outskirts of the clusters, where the accretion shocks are strongest.
5.3 The potential impact of temperature and metallicity substructure.
A fourth, possible explanation for the results on non-thermal-like, power-law signatures is the presence of significant temperature and/or metallicity structure in the clusters.
In order to explore the potential impact of such effects, we have generated and analyzed simulated X-ray data sets with characteristics similar to the Chandra observations of Abell 2319 (similar instrumental response, exposure time, flux, redshift, mean temperature and absorbing Galactic column density). As with the real data, the simulated data sets each have ten spectral regions with counts. We incorporate a broad range of temperature and metallicity distributions in and across the 10 regions. In each case, the mean emission-weighted temperatures in the ten spatial regions were constrained to match the observed values for Abell 2319. The simulated data sets were fitted with the same basic models as the real data (models A–D) and the improvements in the fits, i.e. the values, obtained for models B,C and D with respect to model A were noted.
We first examined whether the observed power-law signatures could be accounted for by hot, shocked gas with keV. The flux in the 20keV component was allowed to account for up to 50 per cent of the total in each region. In all cases, the values obtained with this model were much smaller than the observed values. We conclude that the observed power-law components are unlikely to be due simply to the presence of unresolved hot, shocked gas in the clusters.
We next examined the potential impact of broad, temperature distributions, such as might occur if the gas in each spatial region were highly multiphase. A range of uni-modal temperature models, with normal, log-normal, skew-normal or T-distributions of varying widths (widths ranged from 1-5 keV for normal, skew-normal, and T-distributions or 0.1-0.6 for lognormal distributions) were explored. Although for regions broad temperature distributions can sometimes generate power-law-like signatures, in no case did the combined results for all 10 regions provide comparable values for models B–D to those observed.
All of the radio halo clusters appear to have experienced recent, massive merger events. Such events can can introduce large amounts of relatively low temperature gas into cluster cores (e.g. the ‘bullet’ in 1E 0657-56). We have therefore examined the potential impact of broad, bimodal temperature distributions in the clusters. The gas in each region was assumed to contain two dominant components, with mean temperatures and luminosities scaled according to standard virial relations (Mantz et al. 2009, in prep; mass ratios in the range 2:1 to 4:1 were examined). Each component was allowed to have its own broad range of temperature components, again represented by normal, log-normal, skew-normal or T-distributions of varying widths. Although this model provides larger values than the above, again, in no case did the combined results for all 10 regions provide comparable improvements to the real data.
We next examined the impact of metallicity variations in the clusters. Galaxy clusters are commonly observed to contain strong metallicity gradients, with the strongest gradients observed in relaxed, cool core clusters, although gradients also observed in some merging systems (eg. Allen & Fabian 1998, De Grandi & Molendi 2001, Leccardi & Molendi 2008). When observed in projection, inner high-metallicity gas will be grouped with outer, lower-metallicity material, which can complicate the interpretation of spectra. We have examined the potential impact of such effects. We assume that each spectral region contains a bimodal metallicity distribution, with metallicities differing by factors from 2:1 to 10:1, and relative fluxes in these components ranging from 1:10 to 10:1. In the first case, with gas in each region, the impact of the metallicity variations is limited. However, if both metallicity temperature variations are allowed - be it in a uni-modal or bimodal manner for the temperature - then significant values, comparable to the observations, can be obtained. The maximum values are observed for roughly equal fluxes in the low and high metallicity components. For such cases, we have also confirmed that allowing the power-law index in each region to vary independently leads to consistent results on the distributions of photon indices, as well as flux in the inferred power-law components. For example, a model with a 3:1 mass merger, a T-distribution of temperature, and a 1:1 mix of high and low metallicity gas satisfies all requirements.
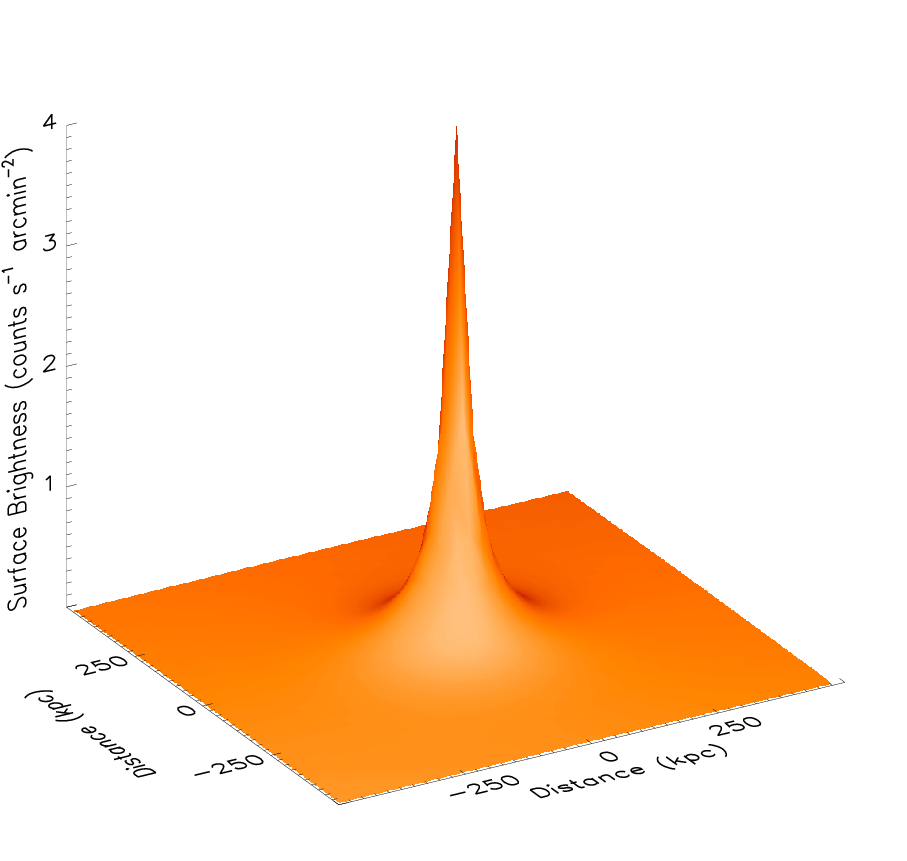
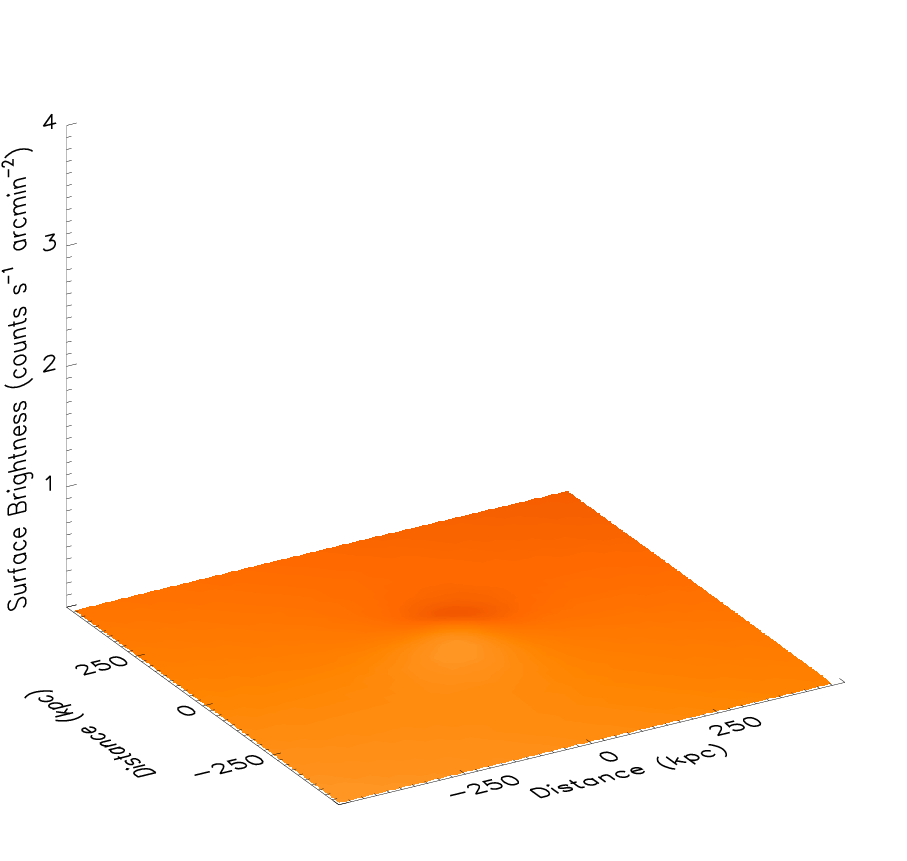
It is important to consider why, if temperature and metallicity variations can together explain the observed power-law signatures in the clusters, are these only detected in radio halos? A possible resolution lies in the differences in central X-ray surface brightness of relaxed cool core and merging, radio halo systems: the central surface brightness is typically an order of magnitude higher in relaxed cool-core clusters (Figure 7). For example, cool core clusters might have beta-model core radii of virial radii or less, whereas for massive, merging systems a value more like virial radii is observed (e.g. Allen 1998). For illustration, we consider a step-like metallicity distribution ranging from 0.5 solar within 0.2 virial radii to 0.1 solar beyond. When viewed in projection, a region spanning the central 100kpc radius for the cool core cluster will have only 25 per cent of the flux in the lower metallicity component. In contrast, for the merging system with the larger core, the flux in the outer, lower metallicity component will be closer to 50 per cent, for which maximum values with models B–D, with respect to model A, are observed. We note that this may also explain the requirements for extra spectral components at radii of kpc using model D in Abell 1795 and Abell 2029, since for these annuli also the contribution of the projected to the total measured flux approaches 50 per cent. (For Abell 2029, however, it also remains possible that the signature may in part be generated by processes associated with the mini radio halo in this cluster reported by Govoni et al. 2009, which also has an extent of approximately kpc.)
Finally, for completeness, we have also carried out simulations in which true, non-thermal power-law components were included in the clusters, with photon indices in the range and approximately 10 per cent of the total flux in the power-law component (as observed). For photon indices in the range , values consistent with the observed values are also be obtained.
We conclude that temperature and metallicity variations, similar to those described above, could be responsible for the observed, non-thermal-like, power-law components in the clusters. However, these signatures may also be due to true non-thermal or quasi-thermal processes, as discussed in Section 5.2.
6 Summary
Using high-quality Chandra data, we have presented new evidence for spatially-extended, non-thermal-like X-ray emission components in five of a sample of seven luminous, merging, radio-halo clusters. A control sample of five, comparably X-ray luminous and mostly relaxed clusters without radio halos do not, in general, exhibit similar emission signatures.
The spectra of the detected non-thermal-like emission components can be approximated by simple power-law models with photon indices . The data for the Bullet Cluster 1E 0657-56, demonstrate a spatial correlation between the regions of highest thermal pressure, strongest radio halo emission, and strongest power-law emission in the cluster core. Our detailed X-ray maps reveal complex thermodynamic structure in the radio halo clusters, driven by the ongoing merger activity. We confirm the presence of the previously-discovered shock front in 1E 0657-56. We also report the discovery of a clear, large-scale shock front in Abell 2219, as well as indications of further shock activity in other clusters (see Appendix).
We have highlighted several possible explanations for the observed, power-law X-ray emission components. One possibility is IC emission; however, the spectra of the electron populations responsible the IC X-ray emission must be flatter than those producing the radio halo flux. The magnetic field strengths (G) implied by the IC model in the regions of the strongest non-thermal-like X-ray emission are also less than those typically inferred from Faraday rotation measurements. Both difficulties can, however, be understood (at least partially) within the context of more sophisticated treatments of particle acceleration in a turbulent intracluster medium (eg. Petrosian 2001; Carilli & Taylor 2002; Newman, Newman & Rephaeli 2002; Kuo et al. 2003; Brunetti et al. 2004; Govoni & Feretti 2004; Petrosian & Bykov 2008). A second interpretation in terms of bremsstrahlung emission from supra-thermal electrons, energized by collisions with a non-thermal proton population, (Liang et al. 2002; Dogiel et al. 2007; Wolfe & Melia 2008; see also Pfrommer 2008) also appears consistent with the observed X-ray spectra, although physical challenges with this model remain (eg. Petrosian & Bykov 2008; Petrosian & East 2008). A contribution to the non-thermal X-ray flux due to synchrotron emission from ultra-relativistic electrons and positrons (Inoue et al. 2005) is possible, although we might expect such a component to be brightest in the cluster outskirts, where the accretion shocks are strongest.
Fourthly, and perhaps most interestingly, we have shown that power-law signatures, similar to those reported here, can also be generated by temperature and/or metallicity substructure in the cluster, particularly in the presence of metallicity gradients. In this case, an important distinguishing characteristic between radio halo and non radio halo, cooling-core clusters is the more sharply-peaked X-ray emission of the latter population.
Our results have clear implications for the interpretation of ‘soft-excess’ X-ray emission from galaxy clusters (eg. Durret et al. 2008 and references therein) and show that apparent soft excesses (or best-fit absorption of less than the Galactic value) can arise from inadequate modelling of the emission spectra in the presence of significant spatial variations in temperature and metallicity, as well as additional emission components.
Further X-ray and radio mapping, coupled with new -ray and TeV observations and detailed hydrodynamical simulations will be vital for improving our understanding of the origin of non-thermal and quasi-thermal X-ray emission from galaxy clusters.
Finally, we note that analyses such as ours push at the limits of what is possible with Chandra. However, our restriction to using only data gathered above a conservative background-to-total counts threshold, the null results obtained for the control sample of non-radio halo clusters, the insensitivity of the results to the precise energy band used all argue that the basic findings are likely to be robust.
7 Acknowledgments
We are grateful to Haida Liang for kindly providing the radio data for 1E 0657-56, and Jeremy Sanders for the contour binning algorithm. We thank Roger Blandford, Gianfranco Brunetti, Stefan Funk, Haida Liang, Greg Madejski, Vahe Petrosian, Christoph Pfrommer, Anita Reimer, Olaf Reimer, Jeremy Sanders, and Norbert Werner for helpful comments. We thank R. Glenn Morris for discussions and technical support, and H. Marshall and A. Vikhlinin for discussions regarding Chandra calibration. All computational analysis was carried out using the KIPAC XOC compute cluster at Stanford University and the Stanford Linear Accelerator Center (SLAC). We acknowledge support from the National Aeronautics and Space Administration through Chandra Award Numbers G06-7123X, issued by the Chandra X-ray Observatory Center, which is operated by the Smithsonian Astrophysical Observatory for and on behalf of the National Aeronautics and Space Administration under contract NAS8-03060. This work was supported in part by the U.S. Department of Energy under contract number DE-AC02-76SF00515.
References
- [1] Ajello M., Rebusco P., Cappelluti N., Reimer O., Böhringer H., Greiner J., Gehrels N., Tueller J., Moretti A., 2009, ApJ, 690, 367
- [2] Allen S.W., Fabian A.C., Johnstone R.M., White D.A., Daines S.J., Edge A.C., Stewart G.C., 1993, MNRAS, 262, 901
- [3] Allen S.W., Fabian A.C., 1998, MNRAS, 297L, 57
- [4] Allen S.W., 1998, MNRAS, 296, 392
- [5] Allen S.W., Schmidt R.W., Fabian A.C., 2001, MNRAS, 328, 27
- [6] Allen S.W., Taylor G.B., Nulsen P.E.J., Johnstone R.M., David L.P., Ettori S., Fabian A.C., Forman W., Jones C., McNamara B., 2001, MNRAS, 324, 842
- [7] Allen S.W., Schmidt R.W., Fabian A.C., 2002, MNRAS, 335, 256
- [8] Allen S.W., Rapetti D.A., Schmidt R.W., Ebeling H., Morris R.G., Fabian A.C., 2008, MNRAS, 383, 879
- [9] Arabadjis J., Bregman J.N., 2000, ApJ, 536, 144
- [10] Arnaud, K.A., 1996, in Astronomical Data Analysis Software and Systems V, eds. Jacoby G. and Barnes J., ASP Conf. Series volume 101, p17
- [11] Balucinska-Church M., McCammon D., 1992, ApJ, 400, 699
- [12] Bevington P.R., 1969, Data Reduction and Error Analysis for the Physical Sciences (New York: McGraw-Hill)
- [13] Blasi P., Colafrancesco S., 1999, APh, 12, 169
- [14] Blasi P., 2000, ApJ, 532L, 9
- [15] Bonamente M., Lieu R., Mittaz J.P.D., 2001, ApJ, 546, 805
- [16] Bonamente M., Joy M., Lieu R., 2003, ApJ, 585, 722
- [17] Boschin W., Girardi M., Barrena R., Biviano A., Feretti L., Ramella M., 2004, A&A, 416, 839
- [18] Bowyer S., Berghöfer T., Korpela E., 1999, ApJ, 526, 592
- [19] Bowyer S., Korpela E., Lampton M., Jones T.W., 2004, ApJ, 605, 168
- [20] Bregman J.N., Lloyed-Davies E.J., 2006, ApJ, 644, 167
- [21] Brunetti G., Setti G., Feretti L., Giovannini G., 2001, MNRAS, 320, 365
- [22] Brunetti G., Blasi P., Cassano R., Gabici S., 2004, MNRAS, 350, 1174
- [23] Brunetti G., Blasi P., 2005, MNRAS, 363, 1173
- [24] Brunetti G., Lazarian A., 2007, MNRAS, 378, 245
- [25] Buote D.A,. Tsai J.C., 1996, ApJ, 458, 27
- [26] Buote D.A., 2001, ApJ, 553, L15
- [27] Bykov A.M., Bloemen H., Uvarov Y.A., 2000, A&A, 362, 886
- [28] Carilli C.L., Taylor G.B., 2002, ARA&A, 40, 319
- [29] Clarke T.E., Kronberg P.P., Böhringer H., 2001, ApJ, 547, 111
- [30] Clarke T.E., Blanton E.L., Sarazin C.L., 2004, ApJ, 616, 178
- [31] Cassano R., Brunetti G., Setti G., 2006, MNRAS, 369, 1577
- [32] Cassano R., Brunetti G., Setti G., Govoni F., Dolag K., 2007, MNRAS, 378, 1565
- [33] De Grandi S., Molendi S., 2001, ApJ, 551, 153
- [34] Dickey J.M., Lockman F.J., 1990. ARA&A, 28, 215
- [35] Dogiel V.A., Colafrancesco S., Ko C.M., Kuo P.H., Hwang C.Y., Ip W.H., Birkinshaw M., Prokhorov D.A., 2007, A&A, 461, 433
- [36] Dupke R.A., Mirabal N., Bregman J.N., Evrard A.E., 2007, ApJ, 668, 781
- [37] Durret F., Kaastra J.S., Nevalainen J., Ohashi T., Werner N., 2008, SSRv, 134, 51
- [38] Eckert D., Produit N., Paltani S., Neronov A., Courvoisier T.J.L., 2008, A&A, 479, 27
- [39] Elbaz D., Arnaud M., Boehringer H., 1995, A&A, 303, 345E
- [40] Ensslin T.A., Biermann P.L., Klein U., Kohle S., 1998, A&A, 378, 777
- [41] Ensslin T.A., Lieu R., Biermann P.L., 1999, A&A, 344, 409
- [42] Ensslin T.A., Brüggen M., 2002, MNRAS, 331, 1011
- [43] Fabian A.C., 1996, Sci, 271, 1244
- [44] Fabian A.C., Sanders J.S., Ettori S., Taylor G.B., Allen S.W., Crawford C.S., Iwasawa K., Johnstone R.M., 2001, MNRAS, 321L, 33
- [45] Fabian A.C., Sanders J.S., Taylor G.B., Allen S.W., Crawford C.S., Johnstone R.M., Iwasawa K., 2006, MNRAS, 366, 417
- [46] Feretti L., Dallacasa D., Giovannini G., Tagliani A., 1995, A&A, 302, 680
- [47] Feretti L., Fusco-Femiano R., Giovannini G., Govoni F., 2001, A&A, 373, 106
- [48] Feretti L., 2005, Adv. Space Res., 36, 729
- [49] Feretti L., Schuecker P., Böringer H., Govoni F., Giovannini G., 2005, A&A, 444, 157
- [50] Feretti L., Giovannini G., 2007, arxiv:astro-ph/0703494
- [51] Finoguenov A., Briel U., Henry J., 2003, A&A, 410, 777
- [52] Fujita Y., Hayashida K., Nagai M., Inoue S., Matsumoto H., Okabe N., Reiprich T.H., Sarazin C.L., Takizawa M., 2008, PASJ, 60, 1133
- [53] Fusco-Femiano R., dal Fiume D., Feretti L., Giovannini G., Grandi P., Matt G., Molendi S., Santangelo A., 1999, ApJ, 513L, 21
- [54] Fusco-Femiano R., Orlandini M., Brunetti G., Feretti L,Giovannini G., Grandi P., Setti G., 2004, ApJ, 602L, 73
- [55] Fusco-Femiano R., Landi R., Orlandini M., 2007, ApJ, 654L, 9
- [56] Giovannini G., Feretti L., 2002, in ‘Merging Processes of Galaxy Clusters’, eds. Feretti L., Gioia I.M., Giovannini G., ASSL, Kluwer, p. 197
- [57] Gitti M., Ferrari C., Domainko W., Feretti L., Schindler S., 2007, A&A, 470, 25
- [58] Govoni F., Feretti L., Giovannini G., Böhringer H., Reiprich T.H., Murgia M., 2001, A&A, 376, 803
- [59] Govoni F., Feretti L., 2004, IJMPD, 13, 1549
- [60] Govoni F., Markevitch M., Vikhlinin A., VanSpeybroeck L., Feretti L., Giovannini G., 2004, ApJ, 605, 695
- [61] Govoni F., Murgia M., Markevitch M., Feretti L., Giovannini G., Taylor G.B., Carretti E., 2009/ arXiv:astro-ph/0901.1941
- [62] Gruber D., Rephaeli Y., 2002, ApJ, 565, 877
- [63] Inoue S., Aharonian F.A., Sugiyama N., 2005, ApJ, 628, 9
- [64] Johnstone R.M., Fabian A.C., Edge A.C., Thomas P.A., 1992, MNRAS, 255, 431
- [65] Kaastra J.S., Mewe R., 1993, Legacy, 3, HEASARC, NASA
- [66] Kalberla P.M., Burton W.B., Hartmann Dap, Arnal E.M., Bajaja E., Morras R., Poeppel W.G.L., 2005, A&A, 440, 775
- [67] Kempner J.C., David L.P., 2004a, ApJ, 607, 200
- [68] Kempner J.C., David L.P., 2004b, MNRAS, 349, 385
- [69] Kim K.T., Kronberg P.P., Tribble P.C., 1991, ApJ, 379, 80
- [70] Komatsu E. et al. 2001, PASJ, 53, 57
- [71] Kuo P.H., Hwang C.Y., Ip W.H., 2003, ApJ, 594, 732
- [72] Leccardi A., Molendi S., 2008, A&A, 487, 461
- [73] Liang H., Hunstead, R.W., Birkinshaw M., & Andreani P., 2000, ApJ, 544, 686
- [74] Liang H., Dogiel V.A., Birkinshaw M., 2002, MNRAS, 337, 567
- [75] Lieu R., Mittaz J. P. D., Bowyer S., Breen J. O., Lockman F. J., Murphy E. M., Hwang C.-Y., 1996, Sci, 274, 1335
- [76] Markevitch M., 1998, ApJ, 504, 27
- [77] Markevitch M., Vikhlinin A., Mazzotta P., 2001, ApJ, 562L, 153
- [78] Markevitch M., Vikhlinin A., 2001, ApJ, 563, 95
- [79] Markevitch M., Gonzalez A.H., David L., Vikhlinin A., Murray S., Forman W., Jones C., Tucker W., 2002, ApJ, 567, L27
- [80] Markevitch M., 2006, ESA SP-604: The X-ray Universe 2005, 723
- [81] Markevitch M., Vikhlinin A., 2007, PhR, 443, 1
- [82] Murgia M., Govoni F., Markevitch M., Feretti L., Giovannini G., Taylor G.B., Carretti E., 2009, arXiv:astro-ph/0901.1943
- [83] Newman W.I., Newman A.L., Rephaeli Y., 2002, ApJ, 575, 755
- [84] O’Hara T.B., Mohr J.J., Guerrero M.A., 2004, ApJ, 604, 604
- [85] Petrosian V., 2001, ApJ, 557, 560
- [86] Petrosian V., 2003, in Bowyer S., Hwang C.-Y., eds, ASP Conf. Ser. Vol. 301, Matter and Energy in Clusters of Galaxies. Astron. Soc. Pac., San Francisco, p. 337
- [87] Petrosian V., Madejski, G., Luli K., 2006, ApJ, 652, 948
- [88] Petrosian V., Bykov A.M., SSR, 124, 191
- [89] Petrosian V., East W.E., 2008, arxiv:astro-ph/0802.0900
- [90] Pfrommer C., 2008, MNRAS, 385, 1242
- [91] Pfrommer C., Ensslin T.A., Springel V., 2008, MNRAS, 385, 1211
- [92] Pointecouteau E., Arnaud M., Kaastra J., de Plaa J., 2004, A&A, 423, 33
- [93] Renaud M., Bélanger G., Paul J., Lebrun F., Terrier R., 2006, A&A, 453L, 5
- [94] Rephaeli Y., 1979, ApJ, 227, 364
- [95] Rephaeli Y., Gruber D., Blanco P., 1999, ApJ, 511L, 21
- [96] Rephaeli Y., Gruber D., 2002, ApJ, 579, 587
- [97] Rephaeli Y., Gruber D., Arieli Y., 2006, ApJ, 649, 673
- [98] Rossetti M., Molendi S, 2004, A&A, 414L, 41
- [99] Sakelliou I., Ponman T.J., 2006, MNRAS, 367, 1409
- [100] Sanders J.S., Fabian A.C., Taylor G.B., 2005, MNRAS, 356, 1022
- [101] Sanders J.S., Fabian A.C., Dunn R.J.H., 2005, MNRAS, 360, 133
- [102] Sanders J.S., 2006, MNRAS, 371, 829
- [103] Sanders J.S., Fabian A.C., 2007, MNRAS, 381, 1381
- [104] Sarazin C.L., Kempner J.C., 2000, ApJ, 533, 73
- [105] Schuecker P. Böhringer H., Reiprich T.H., Feretti L., 2001, A&A, 378, 408
- [106] Sun M., Jones C., Murray S.S., Allen S.W., Fabian A.C., Edge A.C., 2003, ApJ, 587, 619
- [107] Taylor G.B., Allen, S.W., Fabian A.C. 1999, in Diffuse Thermal and Relativistic Plasma in Galaxy Clusters, ed. H. Bo¨hringer, L. Feretti, P. Schuecker (MPE Rep. 271; Garching: MPE), 77
- [108] Taylor G.B., Govoni F., Allen S.W., Fabian A.C., 2001, MNRAS, 326, 2
- [109] Taylor G.B., Fabian A.C., Allen S.W., 2002, MNRAS, 334, 769
- [110] Taylor G.B., Gugliucci N.E., Fabian A.C., Sanders J.S., Gentile G., Allen S.W., 2006, MNRAS, 368, 1500
- [111] Timokhin A.N., Aharonian F.A., Neronov A.Y., 2004, A%A, 417, 391
- [112] Vikhlinin A., Markevitch M., Murray S.S., Jones C., Forman W., Van Speybroeck L, 2005, ApJ, 628, 655
- [113] Wik D.R., Sarazin C.L., Finoguenov A., Matsushita K., Nakazawa K., Clarke T.E., 2009, accepted in ApJ, astro-ph/0902.3658
- [114] Wolfe B, Melia F., 2008, ApJ, 675, 156
- [115] Worrall D.M., Birkinshaw M., 2003, MNRAS, 340, 1261
Appendix: detailed thermodynamic mapping of other clusters in the sample
This appendix includes thermodynamic X-ray maps for all other clusters in the sample (in addition to 1E 0657-56 and Abell 2029) that have 20 or more regions containing 3,000 counts. Our results are broadly consistent with, but refine and expand on, previous studies (eg. Markevitch & Vikhlinin 2001; Markevitch, Vikhlinin & Mazzotta 2001; Fabian et al. 2001; Worrall & Birkinshaw 2003; Sun et al. 2003; Kempner & David 2004a; Kempner & David 2004b; Boschin et al. 2004; Govoni et al. 2004; O’Hara, Mohr & Guerrero 2004; Sanders, Fabian & Taylor 2005; Sakelliou & Ponman 2006; Dupke et al. 2007).
A key result is the discovery of a large-scale shock front in Abell 2219 (Fig. 8b). The cluster shows a clear, arc-shaped region of hot, keV (projected) gas roughly 2 arcmin to the northwest of the cluster center. This gas also has high pressure and entropy and is almost certainly associated with a merger-driven shock front. Together with 1E 0657-56 and Abell 520, Abell 2219 is only the third X-ray luminous cluster in which a clear, large-scale shock front, viewed approximately edge-on, has been discovered (see Markevitch & Vikhlinin 2007 for a review). For more detail see Applegate et al. 2009, in prep.
We have estimated the Mach number and velocity of the shock in Abell 2219. The deprojected pre- and post-shock temperatures of keV and keV, respectively, lead to an estimate for the Mach number of . A density jump of a factor 1.5 is also seen at the front, which leads to an independent and consistent estimate for the Mach number of . Given an ambient sound speed of km/s, estimated from the pre-shock temperature in the northwest region, we determine a shock velocity of km/s. Deeper observations are required to enable a more robust investigation of the shock properties in Abell 2219. Interestingly, we note that Abell 2219 also exhibits a region of exceptionally hot, keV, high pressure gas coincident with the peak of the X-ray surface brightness, which is also, presumably, associated with recent shock activity in the cluster core.
Abell 2744, like Abell 2219, does not provide significant evidence for non-thermal-like X-ray emission. Its X-ray maps show a number of interesting features. The cluster is in the process of a massive, merger event. The overall pressure maximum is coincident with the X-ray surface brightness peak and is associated with the main (southeastern) cluster core. The hottest gas ( keV) is also found in this region. The complex entropy structure in the main cluster suggests possible shocks and significant ongoing turbulence possibly indicating that the colliding cores have already passed through each other. The coolest ( keV), lowest entropy gas in Abell 2744 resides in the core of the merging subcluster, to the northwest of the main cluster.
For Abell 2319 and 2163, the thermodynamic maps are complex and confirm that the clusters have experienced massive, recent merger events. For both systems, the temperature, pressure and entropy maps show a high degree of asymmetry. As with 1E 0657-56, we observe a close correlation between regions of strongest apparent dynamical activity and brightest radio halo emission in the clusters (see Govoni et al. 2004 for the radio images). In the case of Abell 2319, we observe a clear extension of cool, low entropy gas to the northwest; the radio halo emission is also extended in this direction. For Abell 2163, the coolest, lowest-entropy gas is located to the west of the main X-ray brightness peak. As with the Bullet Cluster, this gas may represent the surviving core of a recently merged subcluster. Previous claims of hard, non-thermal X-ray emission from Abell 2319 and 2163, based on RXTE data, were reported by Gruber & Rephaeli (2002) and Rephaeli, Gruber & Arieli (2006), respectively. (An upper limit for Abell 2163 was also reported by Feretti et al. (2001), using BeppoSax.) These results, which probe harder X-ray energies but with limited spatial resolution, are broadly consistent with ours.
For Abell 478 and 1795, the thermodynamic maps indicate relatively relaxed thermodynamic states with a high degree of symmetry. The peaks of the thermal X-ray brightness coincide with the locations of the dominant cluster galaxies. The X-ray peaks mark the locations of the lowest temperature and entropy, and highest thermal pressure. Unsurprisingly, and as with Abell 2029, neither cluster is in equilibrium, as evidenced by detailed structure observed in the X-ray image, especially at small radii (see eg. Fabian et al. 2001; Markevitch, Vikhlinin & Mazzotta 2001; Sun et al. 2003). In particular, for Abell 1795, some approximate north-south elongation is visible in the pressure and entropy maps that may be related to recent dynamical activity and the observed peculiar motion of the dominant cluster galaxy (Fabian et al. 2001).