SMA 12CO(J = 6 – 5) and m interferometric imaging of the nuclear region of Arp 220
Abstract
We have used the Submillimeter Array (SMA) to make the first interferometric observations (beam size , or pc) of the 12CO J=6-5 line and 435 m (690 GHz) continuum emission toward the central region (half power field of view ) of the nearby ultra-luminous infrared galaxy (ULIRG) Arp 220. These observations resolve the eastern and western nuclei from each other, in both the molecular line and dust continuum emission. At 435 m, the peak intensity of the western nucleus is stronger than the eastern nucleus, and the difference in peak intensities is less than at longer wavelengths. Fitting a simple model to the dust emission observed between 1.3 mm and 435 m suggests that dust emissivity power law index in the western nucleus is near unity and steeper in the eastern nucleus, about 2, and that the dust emission is optically thick at the shorter wavelength. Comparison with single dish measurements indicate that the interferometer observations are missing of the dust emission, most likely from a spatially extended component to which these observations are not sensitive. The 12CO J=6-5 line observations clearly resolve kinematically the two nuclei. The distribution and kinematics of the 12CO J=6-5 line appear to be very similar to lower J CO lies observed at similar resolution. Analysis of multiple 12CO line intensities indicates that the molecular gas in both nuclei have similar excitation conditions, although the western nucleus is warmer and denser. The excitation conditions are similar to those found in other extreme environments, including the nearby starburst galaxy M82, the AGN hosting ULIRG Mrk 231, and the high-z QSO BR 1202–0725. Simultaneous lower resolution observations of the 12CO, 13CO, and C18O J=2-1 lines show that the 13CO and C18O lines have similar intensities, which suggests that both of these lines are optically thick, or possibly that extreme high mass star formation has produced in an overabundance of C18O.
Subject headings:
galaxies: individual (Arp 220 (catalog )), galaxies: ISM, galaxies: nuclei, galaxies: starburst1. INTRODUCTION
Galaxy-galaxy mergers are the phenomena violent enough to disturb the galactic potentials of both of the colliding galaxies. They create shocked gas at the merging region, make interstellar matter fall into the new galactic potential, and induce strong starbursts. This extreme starburst heats up the surrounding dust, which sometimes radiates L⊙ or more in infrared luminosity. These sources are often called ultra-luminous infrared galaxies (ULIRGs).
Since molecular gas and dust create stars, observations of these components toward ULIRGs are important to understand the nature of extreme starbursts. Multiple molecular lines or multiple transition studies revealed that a large fraction of molecular gas in ULIRGs is dominated by dense and warm gas (e.g., Solomon et al., 1992; Gao & Solomon, 2004; Papadopoulos et al., 2007). In addition, the efficiency of star formation is tightly correlated with the dense gas fraction in molecular gas (Solomon et al., 1992; Gao & Solomon, 2004).
ULIRGs are also important for the study of high-z submillimeter galaxies. The Submillimetre Common-User Bolometer Array (SCUBA) on the James Clerk Maxwell Telescope (JCMT) has detected many high-z submillimeter galaxies (SMGs; e.g., Hughes et al., 1998; Eales et al., 1999, 2000; Scott et al., 2002; Borys et al., 2003). Most of them have infrared luminosities of L⊙, and bright ones have L⊙. Local ULIRGs can be studied as nearby counterparts of high-z SMGs or used as nearby templates to derive photometric redshifts. To compare redshifted emission lines or continuum emission in high-z galaxies to those in local ULIRGs, we need to observe local ULIRGs at the same wavelengths as the rest wavelengths of the detected lines or continuum from the high-z galaxies. Many of the high-z galaxies were observed at millimeter-wave (around 1 – 3 mm; e.g., Greve et al., 2005; Tacconi et al., 2006). Therefore the rest wavelengths of the detected lines or continuum are at submillimeter wavelengths. Our knowledge about submillimeter lines or continuum from local ULIRGs, especially from compact starburst regions or from nuclei, is very limited so far, because only recently have high resolution submillimeter observations been possible.
Here we present the first interferometric 12CO(6-5) line and 435 m (690 GHz) continuum observations of Arp 220 using the Submillimeter Array (SMA; Ho et al., 2004). The interferometric 12CO(2-1), 13CO(2-1), and C18O(2-1) lines and 1.3 mm (226 GHz) continuum observations have also been made simultaneously with the 12CO(6-5) and 435 m observations. Both 12CO(6-5) and C18O(2-1) lines have never been observed (even in a single-dish telescope) toward this galaxy so far. Arp 220 is the nearest ULIRG (79.9 Mpc, pc; Sanders et al., 2003), and has therefore been well studied in various wavelengths. Optical images show disturbed faint structures (“galaxies with adjacent loops”; Arp, 1966), which seem like remnants of tidal tails produced by a galaxy-galaxy merger (Joseph & Wright, 1985), similar to numerical simulation results (e.g., Hernquist, 1992, 1993). The infrared luminosity at m of this galaxy is L⊙ (Sanders et al., 2003), and high spatial resolution radio continuum (Norris, 1988), near-infrared (Graham et al., 1990), and mid-infrared (Soifer et al., 1999) observations revealed two nuclei at the center with a separation of ( pc). Molecular gas is very rich in this galaxy, M⊙, and two-thirds of this mass is concentrated within 400 pc in radius (Scoville et al., 1997). Such high gas mass concentration is similar also to the numerical simulation results (e.g., Barnes & Hernquist, 1991; Mihos & Hernquist, 1996). These observations and numerical simulations indicate that Arp 220 is in the final stage of merging.
The past high spatial resolution millimeter-wave interferometric observations show molecular gas concentrations at the two nuclei, and these are embedded in an extended ( kpc) molecular structure, which seems to be a rotating disk coincident with a dust lane in optical images (Scoville et al., 1997; Downes & Solomon, 1998). The molecular gas peak at each nucleus shows a steep velocity gradient with the direction of the gradient different from that of the large-scale molecular gas disk. This suggests that a small-scale molecular gas disk rotates around each nucleus, and both disks are embedded in the large-scale rotating disk (Sakamoto et al., 1999). Recent molecular gas images resolved the detailed nuclear gas distributions (Downes & Eckart, 2007; Sakamoto et al., 2008), which are consistent with the Hubble Space Telescope NICMOS near-infrared imaging results that suggest an opaque disk around one of the nuclei (Scoville et al., 1998).
Dust emission also peaks at the two nuclei. Sakamoto et al. (1999) reported that most of the continuum flux at 1.3 mm comes from the two nuclei, while Downes & Solomon (1998) mentioned that half of the 1.3 mm continuum flux comes from the extended component. It is suggested that a few tenths of the 860 m (Sakamoto et al., 2008) and 24.5 m (Soifer et al., 1999) continuum flux comes from the extended component. Far-infrared observations with the Infrared Space Observatory (ISO) also suggest the existence of extended dust emission (González-Alfonso et al., 2004).
2. OBSERVATIONS AND DATA REDUCTION
We observed the center of Arp 220 with the SMA on March 2nd, 2005. The phase reference center was at and . The 225 GHz atmospheric opacity was between 0.03 and 0.04, which was measured at the nearby Caltech Submillimeter Observatory. Six of the eight 6 m antennas were used with projected antenna separations between 14 m and 68 m. High frequency receivers were tuned to observe the redshifted 12CO(6-5) line (679.13 GHz) in the lower side band (LSB) and the 689.13 GHz (435 m) continuum emission in the upper side band (USB). Low frequency receivers were tuned to observe the redshifted 13CO(2-1) line (216.47 GHz) and C18O(2-1) line (215.64 GHz) in the LSB and the redshifted 12CO(2-1) line (226.42 GHz) in the USB. The double sideband system temperature for the high frequency band ranged from 2000 K to 2500 K for most of the time (i.e., at high elevation), and that for the low frequency band from 140 K to 180 K. The SMA correlator covers a 2 GHz bandwidth for each sideband of both high and low frequency bands, which corresponds to the velocity range of km s-1 and km s-1 for each sideband of the high and low frequency bands, respectively. The channel width was configure to have 3.25 MHz ( km s-1) and 0.8125 MHz ( km s-1) for the high and low frequency bands, respectively.
We calibrated the data using the Owens Valley Radio Observatory software package MIR, which is modified for the SMA. For the high frequency band calibration, we used a partially resolved source, Callisto, as a gain (amplitude and phase) and flux calibrator999The flux values for Callisto and Ceres are inferred from the SMA Planetary Visibility Function Calculator (http://sma1.sma.hawaii.edu/planetvis.html), since quasars were too weak for gain calibration. Callisto was about away from Arp 220. The r.m.s. phase fluctuation was about . We used a source model at the gain calibration to correct for the effect of the partially resolved structure. Bandpass calibration was done using three sources, Mars, Callisto, and Ganymede to gain the signal-to-noise ratio (S/N). Ceres was imaged after the calibrations, and its flux was 22% lower than the calculated flux99footnotemark: 9. Although the flux error for Ceres was about 20%, we conservatively adopt the flux error of 30% for the high frequency band data throughout this paper. For the low frequency band calibration, we used Ceres, which was about away, as the gain calibrator due to its closeness, and Mars, Callisto, and Ganymede were used as bandpass calibrators. Callisto was imaged after the calibrations, and showed 21% lower than the calculated flux. Hereafter, we adopt the flux error of 20% for the low frequency band data.
| Wavelength (Frequency) | Synthesized Beam Size | Velocity Resolution | R.M.S. Noise |
|---|---|---|---|
| or Line | and Position Angle | ||
| [m (GHz)] | (Linear scale) | [km s-1] | [mJy beam-1 (mK)] |
| 435 (689.13) | , | — | 190 (450) |
| (470 pc 350 pc) | |||
| 1320 (226.46) | , | — | 4.8 (9.1) |
| (1.47 kpc 1.28 kpc) | |||
| 1380 (216.46) | , | — | 5.7 (11) |
| (1.51 kpc 1.36 kpc) | |||
| 12CO(6-5) | , | 30.1 | 535 (1400) |
| (500 pc 310 pc) | |||
| 12CO(2-1) | , | 5.4 | 32.2 (61) |
| (1.47 kpc 1.28 kpc) | |||
| 13CO(2-1), C18O(2-1) | , | 30.8 | 13.1 (25) |
| (1.51 kpc 1.36 kpc) |
Data from 5 antennas were used for the 12CO(6-5) line imaging because of a correlator problem. For m continuum imaging, we used the data from all 6 antennas after discarding the problematic data. We subtracted the continuum emission from the line emission data before line imaging. Since the 12CO(6-5) line width is comparable with the band width, we could not obtain the continuum emission from the same sideband. We therefore subtracted the continuum emission using the other sideband (i.e., USB) in the plane using the National Radio Astronomy Observatory software package AIPS. For the low frequency (1 mm) data, we created the continuum image using the line free channels in the same band. The line images for the low frequency data were made after the subtraction of the continuum emission from the data in the plane.
The calibrated data were binned, and the final channel maps have velocity resolutions of about 30 km s-1 for the 12CO(6-5), 13CO(2-1), and C18O(2-1) lines, and about 5 km s-1 for the 12CO(2-1) line. We use the radio definition for the LSR velocity in this paper, which is . The C18O(2-1) line was observed up to the LSR velocity of 5550 km s-1, covering about 72% of the total line width, since this line was at an edge of the bandpass.
We CLEANed the images with natural weighting, and the resulting synthesized beam sizes were about for 690 GHz band images, and about for 230 GHz band images. The beam sizes and the r.m.s. noise levels for all the images are summarized in Table 1. The half-power width of the primary beam at 690 GHz and 230 GHz are (6.6 kpc) and (20.1 kpc), respectively. These sizes are much larger than the sizes of the line/continuum emitting regions (at most a few arcseconds), and we did not make any primary beam correction to our images.
Our 12CO(6-5) images show a systematic position shift of about from the peak positions of the double nucleus reported in the previous observations at longer wavelengths (e.g., Sakamoto et al., 1999). This offset can be explained by the baseline error, which is about or less at 690 GHz. Furthermore, we used the phase calibrator with about away from the source. Hence we shifted the positions of the 12CO(6-5) line images based on the peak positions and kinematics information to be consistent with the previously published results. The m continuum image also shows about position shift, which is again explained by the baseline error, and therefore shifted the position with the same manner as the 12CO(6-5) data. The low frequency band images did not show any noticeable position shifts, and therefore we did not shift any images.
3. RESULTS
3.1. m Continuum Emission
The m (689 GHz) continuum emission image is shown in Fig. 1. The image clearly shows two peaks with a separation of about , consistent with the past continuum images in centimeter, millimeter, and infrared wavelengths. We therefore call these peaks eastern and western nuclei as is the past studies. Intensities of the western and eastern nuclei are Jy beam-1 and Jy beam-1, respectively. The total flux density of the continuum emission is Jy. Since the flux distribution can be smeared by the phase fluctuation or baseline errors, we convolved the image to larger beam sizes (up to with a Gaussian convolution) and measured the total flux density. It did not change from 2.5 Jy, indicating that the flux smearing effect due to the phase or baseline errors is small. The r.m.s. phase fluctuation at this wavelength was indeed only (Sect. 2), which induces smearing, so it is consistent with this result.
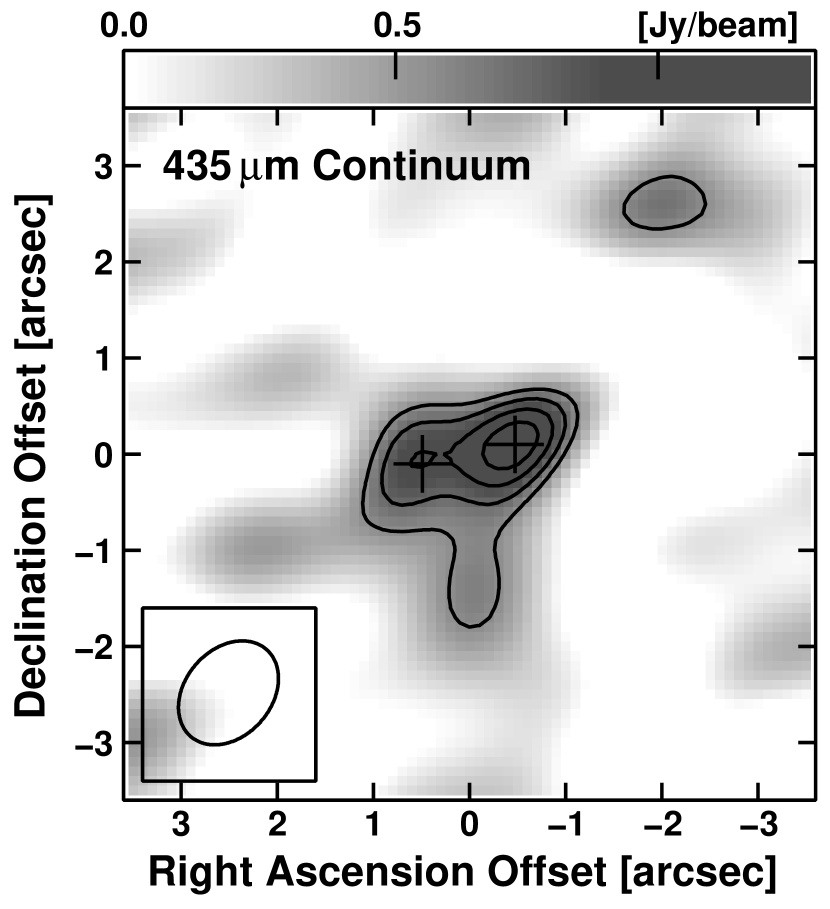
The previously published m (670 GHz) single dish results show a very large variation in the detected flux densities; the United Kingdom Infrared Telescope (UKIRT) UKT14 result shows the flux density of Jy (Eales et al., 1989), but that of the JCMT SCUBA result shows Jy (Dunne & Eales, 2001). We plot the submillimeter (1.5 mm – m or 200 GHz – 1000 GHz) spectrum energy distribution (SED) using published single dish results in Fig. 2. The large crosses in the plot are the data for the total flux densities at various frequencies, and the solid line shows the fitting of the data (see Sect. 4.1 for details). As shown in the figure, the JCMT SCUBA data point is on the fit, but the UKIRT UKT14 data point is significantly lower than the fit. There is no report for the time variation of flux density at submillimeter wavelength in this galaxy so far. In addition, the measurements for the total flux density in the plot is distributed over three decades, but only m shows the large difference, which is unlikely to be caused by the time variation. We therefore assume that the JCMT SCUBA value is more accurate. Using the fit, we estimated the total flux density at m as 5.9 Jy. This suggests that our m continuum observations missed of the total flux density.
Since this missing flux is larger than our flux error of , and the effect of the flux smearing due to phase or baseline errors is small, this missing flux is probably due to the existence of an extended component. If the missing flux of 3.4 Jy is due to an extended component with a Gaussian distribution that has a full width at half maximum of , its peak will be only twice of our r.m.s. noise. We did not detect any significant signal with larger beam as mentioned above, but the r.m.s. noise level increased in the larger beam images due to a small number of data points at shorter baselines. It is therefore not clear whether the missing flux in our data is due to the lack of shortest baselines or to low S/N.

3.2. 12CO(6-5) Line Emission
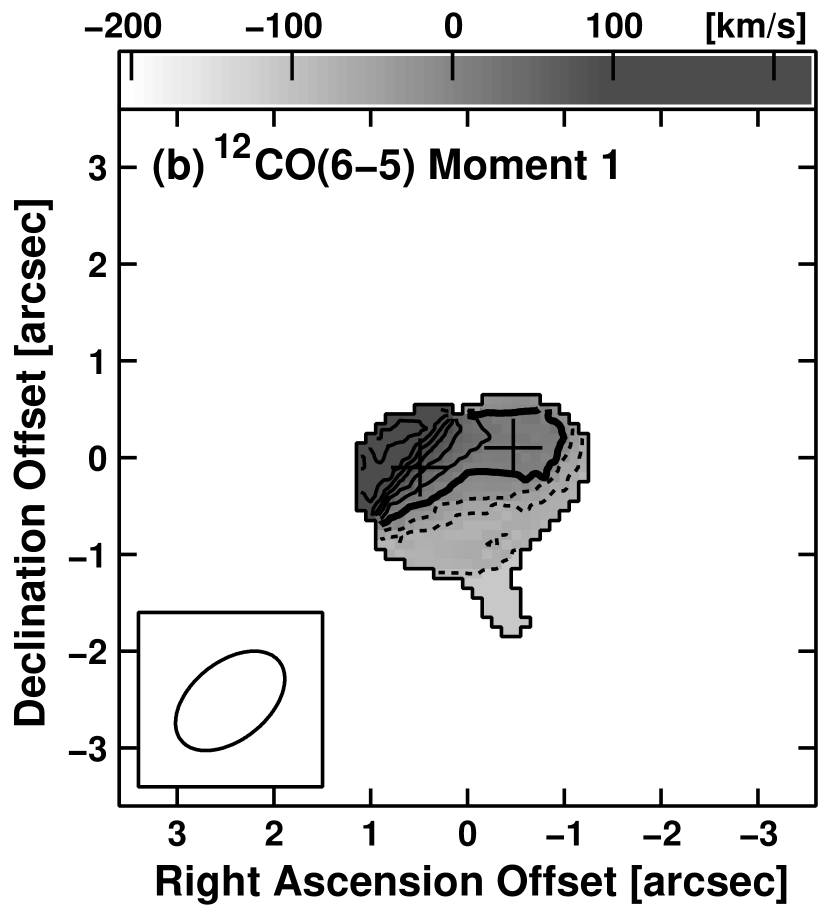
The channel maps of the 12CO(6-5) line emission at the nuclear region of Arp 220 are shown in Fig. 3, and the integrated intensity (moment 0) and intensity-weighted mean velocity (moment 1) maps are shown in Fig. 4. The channel maps reveal that the molecular gas traced by the 12CO(6-5) line exhibits different kinematics around each nucleus; molecular gas associated with the eastern nucleus tends to display gas kinematics moving from south-west to north-east, and that associated with the western nucleus from south-east to north-west. These features can also be seen in the moment 1 map for the eastern nucleus. Molecular gas around the western nucleus in the moment 1 map, on the other hand, does not exhibit a clear velocity gradient as in the channel maps. This may be due to the nature of the moment 1 map (i.e., intensity weighted velocity field map) with weak emission at the northwestern region. The kinematics on spatial scales larger than that immediately associated with the individual nucleus shows a velocity gradient along north-east to south-west direction with much shallower gradient than that of the eastern nucleus. All of these kinematics features mentioned above are also seen in the previously published lower-J 12CO lines (Sakamoto et al., 1999, 2008; Downes & Solomon, 1998; Scoville et al., 1997). The kinematics in the west nucleus displays a smaller velocity gradient in our data, probably due to poorer spatial resolution and lower S/N of our data. The detection of the large-scale kinematics feature suggests that our data detected some of the extended (a few arcsecond scale) component, but much less than that detected in 12CO(1-0), 12CO(2-1), or 12CO(3-2) observations (Scoville et al., 1997; Downes & Solomon, 1998; Sakamoto et al., 1999, 2008).

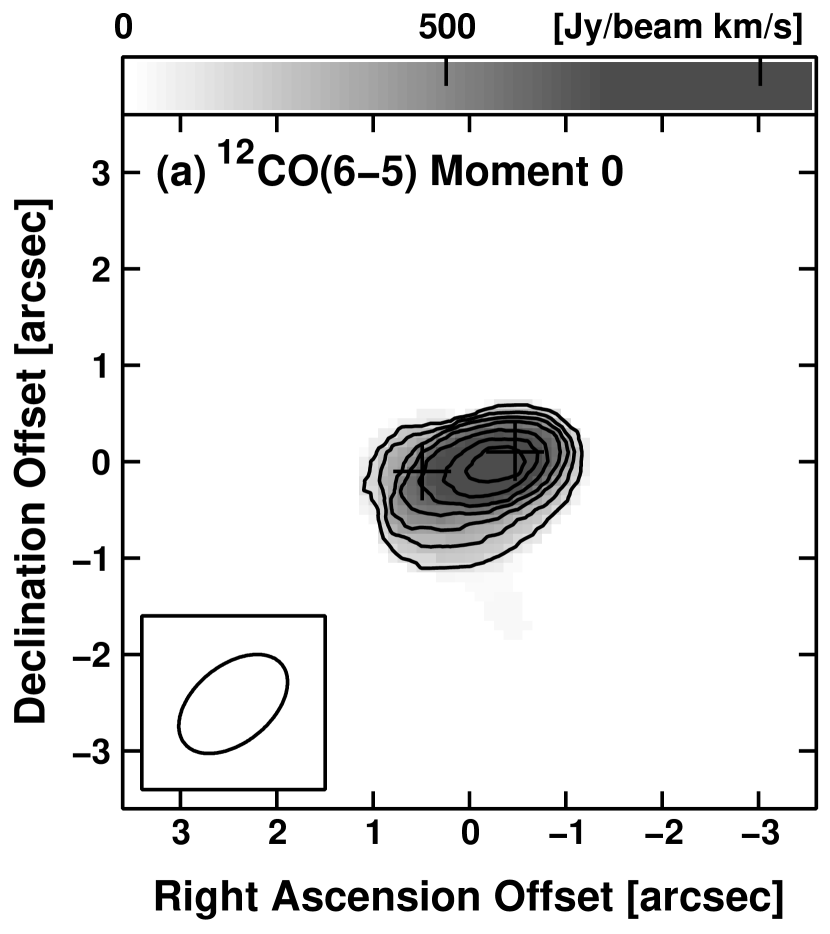
The integrated intensity image, on the other hand, displays a single peak that is elongated along the two nuclei, which looks different from our m continuum image or the previously published high resolution 12CO(2-1) and 12CO(3-2) images (Sakamoto et al., 1999, 2008; Downes & Solomon, 1998) at first glance. Our image is rather similar to the low resolution maps of 12CO(2-1) line (Sakamoto et al., 1999; Scoville et al., 1997) without diffuse and extended (larger than a few arcsecond) emission from their maps. The total integrated 12CO(6-5) intensity is Jy km s-1 in our data. Since there is no published result for the 12CO(6-5) line emission, we could not estimate the missing flux of our 12CO(6-5) data.
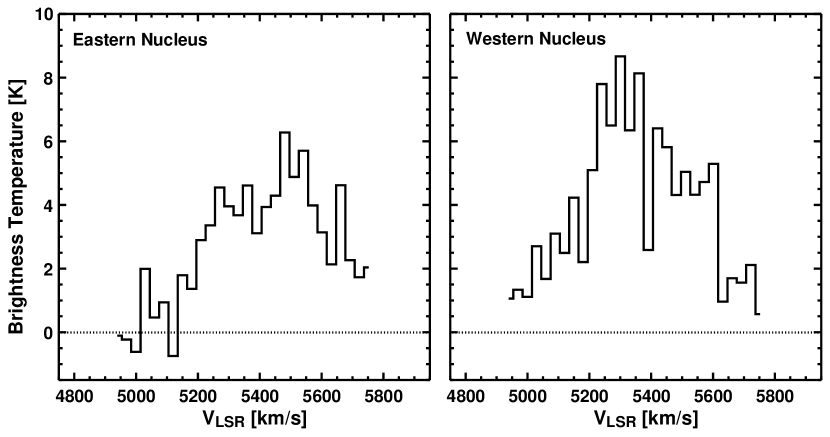
Fig. 5 shows the 12CO(6-5) line spectrum at each nucleus. The peak brightness temperature of the western nucleus is K ( Jy beam-1) around the LSR velocity of km s-1, and that of the eastern nucleus K ( Jy beam-1) around km s-1. The overall velocity ranges for the two nuclei are similar to those in the high resolution 12CO(2-1) and 12CO(3-2) observations (Sakamoto et al., 1999, 2008).
3.3. 1.32 mm and 1.38 mm Continuum Emission
Both 1.32 mm (226.46 GHz) and 1.38 mm (216.46 GHz) continuum emissions are detected at a significant signal level (), and the emission is unresolved at both wavelengths at our resolution of (the 1.32 mm image is shown in Fig. 6a; the 1.38 mm image is almost the same as the 1.32 mm image, and not shown here). The total flux densities for 1.32 mm and 1.38 mm are mJy and mJy, respectively. From the dust continuum fitting (Sect. 3.1), we estimate the total flux densities at 1.32 mm and 1.38 mm as 153 mJy and 178 mJy (including the non-thermal flux contribution). The observed total flux density therefore agrees with that from the SED fitting within our calibration error. We therefore conclude that our 1.32 mm and 1.38 mm continuum data have no missing flux.
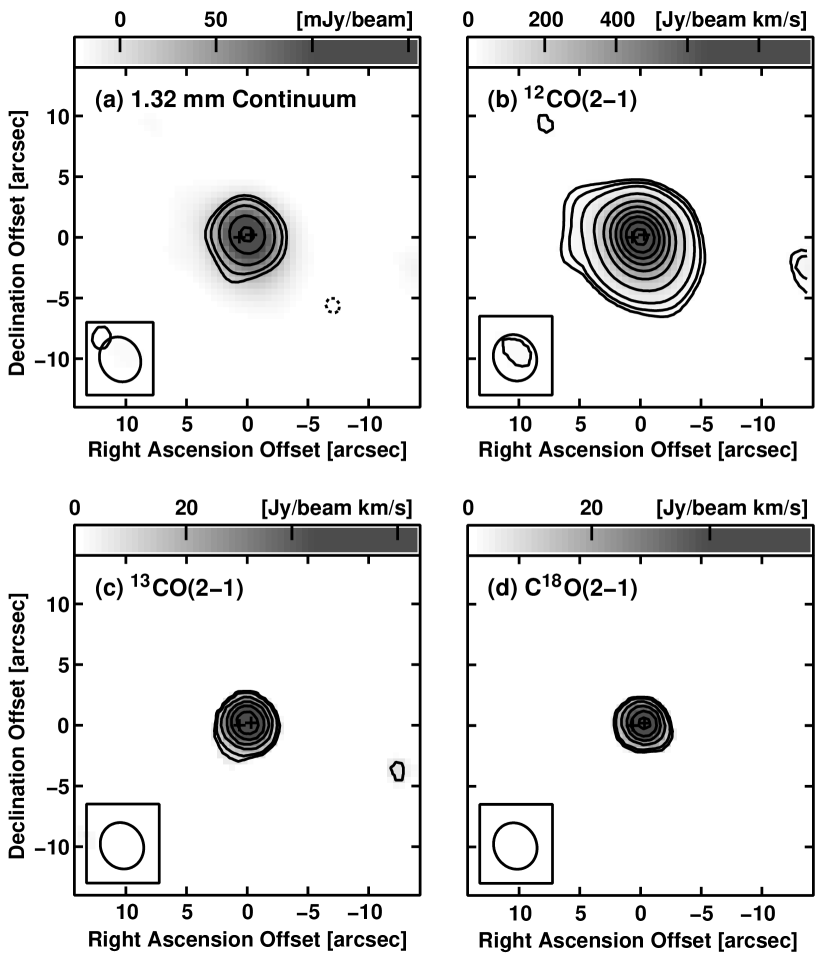
3.4. 12CO, 13CO, and C18O J=2-1 Line Emissions
The 12CO(2-1) line image exhibits an extended structure along north-east and south-west direction even with our low resolution image (Fig. 6b), which is consistent with the past interferometric maps (Sakamoto et al., 1999; Downes & Solomon, 1998; Scoville et al., 1997). On the other hand, the 13CO(2-1) and C18O(2-1) line images (Fig. 6c, d) are unresolved at our resolution.
The integrated intensities of the 12CO, 13CO, and C18O J=2-1 lines are Jy km s-1, Jy km s-1, and Jy km s-1, respectively. Our observation covers only of the line width of the C18O(2-1) line (Sect. 2), so the derived value should be a lower limit (see also Sect. 3.5).
We compared the integrated intensities with the single dish results for the 12CO(2-1) and 13CO(2-1) lines. The JCMT observations of the 12CO(2-1) line ( resolution) indicate Jy km s-1 (Wiedner et al., 2002) and Jy km s-1 (Greve et al., 2008). The flux differences between our and these observations are within the calibration errors. The 13CO(2-1) line was observed with the Institut de Radio Astronomie Millimetrique (IRAM) 30 m telescope ( resolution) and JCMT ( resolution) (Greve et al., 2008), and they obtained the integrated intensities of Jy km s-1 and Jy km s-1, respectively. The differences between our and these observations are again explained by the calibration errors. We therefore conclude that our 12CO(2-1) and 13CO(2-1) line data have no missing flux.
Since there is no single dish C18O(2-1) line observation, we cannot estimate the missing flux for this line. On the other hand, since we did not see any significant missing flux in the 1.32 mm and 1.38 mm continuum data and the 12CO(2-1) and 13CO(2-1) line data, we expect no significant missing flux in the C18O(2-1) line data.
3.5. Line Spectra and Ratios
To compare the line spectra and intensities of all the four obtained lines, we convolved the data into the largest synthesized beam size of with the P.A. of , which is the beam size of the 13CO(2-1) and C18O(2-1) lines. Fig. 7 shows the spectra of all these four lines. Note that the sensitivity toward extended structure (i.e., coverage) is different between the J = 2 – 1 lines and the J = 6 – 5 line in this figure.
The 12CO(2-1) line shows a double peak profile with stronger intensity at lower velocity, which is consistent with the past single dish measurements (Wiedner et al., 2002; Solomon et al., 1990). The line width of the 12CO(2-1) line reaches 900 km s-1 (4900 – 5800 km s-1). The 13CO(2-1) and C18O(2-1) lines exhibit very similar line profiles and intensities. The 12CO(6-5) line is mostly emitted at higher velocities and is weak at lower velocities. This asymmetry is similar to that of the HCN(4-3) line (Wiedner et al., 2002).

We matched the shortest distance between the 12CO(6-5) and 12CO(2-1) data to match the spatial structures between these two lines, and measured the 12CO(6-5)/(2-1) intensity ratio to be . This value is much lower than the lower-J ratios, such as 12CO(3-2)/(2-1) of (Wiedner et al., 2002) or 12CO(2-1)/(1-0) of (Scoville et al., 1997). This is mostly due to the different line profile of the 12CO(6-5) line from the lower-J CO lines. This indicates that the lower velocity is dominated by lower-J CO lines, but the higher velocity is rich in higher-J lines. This trend is consistent with the observations of Wiedner et al. (2002) that the 12CO(3-2) line intensity decreased relative to the 12CO(2-1) line in the lower velocity part, but stay almost constant at higher velocities. The relation between the spatial distribution and the velocities of the molecular gas in this galaxy is, however, not simple; all the molecular gas components in this galaxy, namely the two nuclei and the extended component, have low and high velocities (Fig. 5; see also Sakamoto et al. 1999, 2008). It is therefore difficult to tell which component contributes to high or low excitation condition only from the large-scale line spectra. The 12CO transition ratios for each nucleus is derived in Sect. 4.3.
The 12CO(2-1)/13CO(2-1) line ratio is at our resolution of . We also convolved our data to resolution ( single dish resolution), and the ratio was . These values are similar or slightly lower than the values observed in U/LIRGs, and similar or somewhat higher than starburst or Seyfert galaxies; the 12CO(2-1)/13CO(2-1) line ratios in U/LIRGs observed with single dish telescopes are (Casoli et al., 1992) and (Glenn & Hunter, 2001), and those in starburst and Seyfert galaxies are (Aalto et al., 1995) and (Papadopoulos & Seaquist, 1998), respectively.
The line profiles and the line intensities of the 13CO(2-1) and C18O(2-1) are almost identical (Fig. 7), and the 13CO(2-1)/C18O(2-1) line intensity ratio is between the velocity range of 4800 km s-1 and 5550 km s-1, which is the velocity range we observed the C18O(2-1) line (Sect. 2). The 13CO(2-1) line has 92% of its total integrated intensity in this velocity range, so the result with the full line width will not change significantly. This very low 13CO(2-1)/C18O(2-1) intensity ratio matches very well with 13CO(1-0)/C18O(1-0) (Greve et al., 2008). We discuss this ratio in Sect. 4.4.
4. DISCUSSION
4.1. Dust Emissivity Index and Dust Opacity of the Two Nuclei
| Source | Dust Temperature | Emissivity Index | Critical Frequency (Wavelength) |
|---|---|---|---|
| [K] | [GHz ()] | ||
| Arp 220 (total) | () | ||
| East Nucleus | () | ||
| West Nucleus | () | ||
| Extended Component | () |

We plot in Fig. 8 the flux ratios between the two nuclei as a function of frequency. Although our continuum data have of calibration errors and a large amount () of missing flux, the flux density ratio between the two nuclei is accurate, since it depends on the noise level of the map. Hence this flux ratio diagram has higher accuracy than the SED diagrams shown in Fig. 2. The flux ratio in our data is . If we assume that the missing flux of our data is due to the extended emission (see Sect. 3.1), the size of the extended emission is larger than the separation of the two nuclei. Therefore the correction of the missing flux will increase both the fluxes of the two nuclei with almost the same amount, and the flux ratio increases toward unity, namely the ratio derived above is the lower limit. Contamination of the flux from one nucleus to the other due to the large beam size is small; this effect lowers the ratio by , which is smaller than the calibration errors. As frequency goes down to GHz, the flux ratio also goes down, and the flux of the eastern nucleus is about half or less of that of the western nucleus. Since the data for the two lower frequencies may not have significant missing flux (e.g., Sakamoto et al., 1999, 2008), the difference between the ratio at 689 GHz and those at lower frequencies will be more pronounced if we correct for the missing flux of the 689 GHz data. Since the emission at these frequencies is dominated by dust emission, this result suggests that the dust SEDs are different between the two nuclei.
We then made continuum SEDs for the two nuclei at submillimeter wavelength (Fig. 2) as well as that for the total flux density to discuss the dust property differences more quantitatively. The crosses, filled squares, and filled diamonds in the plot are the data for the total flux density, east nucleus, and west nucleus, respectively. The solid, dashed, and dotted lines are the fitting of the data with a function , where is the Planck function for temperature and is the emissivity function. We adopted a form ; is the critical frequency where the opacity is unity, and is the emissivity index. We adopted the source sizes of for the eastern nucleus and for the western nucleus (Sakamoto et al., 2008), since their images have the highest spatial resolution at the highest frequency around submillimeter wavelengths. For the source size of the total flux density, we adopted the deconvolved size of the extended 12CO(2-1) emission of (Scoville et al., 1997). The flux density for the non-thermal component is subtracted from all the fluxes in the plots before the fitting, following the method explained in Scoville et al. (1991), although it is not significant especially at high frequencies; about several milli-Jy or several percent of the flux around GHz, and even smaller at GHz. We also estimated the CO flux contamination into the total flux, but most of the data are affected for only a few %, and the fitting result did not change. The fitting results are summarized in Table 2.
We obtained from the fit to the total flux density of 51 K and of 1.4, which are consistent with the past estimates of K with (Scoville et al., 1991; Downes & Solomon, 1998; Dunne & Eales, 2001; Klass et al., 2001). The critical frequency is estimated to be 2200 GHz (), which is also consistent with the estimation that dust is already optically thick at (Scoville et al., 1991; Klass et al., 2001). If we adopt a smaller source size for the total flux of (Scoville et al., 1997), , , and would be 66 K, 1.3, and 2000 GHz (), respectively. The temperature is slightly higher, but the critical frequency and the emissivity index are still consistent with the past estimates.
The fitting for the two nuclei gives high temperatures of 83 K and 180 K for the east and west nuclei, respectively. These high temperatures are due to the small source sizes. The emissivity indices are different between the two nuclei, 2.1 for the eastern nucleus and 1.2 for the western nucleus. The critical frequencies are estimated to be 370 GHz () for the eastern nucleus and 190 GHz ( mm) for the western nucleus.
The large uncertainties in our fitting for the two nuclei are the source flux density and the adopted source size. If we increase the 689 GHz flux density of each nucleus by 30%, which corresponds to the calibration error of our data may have (Sect. 2), the fitting results would be K and 310 K, and 0.7, and GHz () and 610 GHz () for the eastern and western nuclei, respectively. We adopted the source size derived at (Sakamoto et al., 2008), but the effective source size at may be different from that at . This is because the opacity is wavelength dependent, and therefore the effective source size is also wavelength dependent. Ideally we need to determine the source size at each wavelength, but our spatial resolution at is too low for this. Since opacity is higher at shorter wavelength, the effective source size at may be larger than what we adopted. If we increase the source size (area) of each nucleus by 50%, which roughly corresponds to the deconvolved size of the double nucleus in our data, the fitting results would be K and 97 K, and 1.1, and GHz () and 210 GHz ( mm) for the eastern and western nuclei, respectively.
The fitting results, with the uncertainties, indicate that the dust temperature, the emissivity index, and the critical frequency for the eastern nucleus are better constrained than the past observations, because of our high frequency observations with high spatial resolution. The eastern nucleus seems to have a warm temperature of 49 – 120 K, a steep emissivity index of , and becomes optically thick at frequencies above GHz. Sakamoto et al. (2008) derived a dust temperature of 30 – 160 K, so our estimate narrows the range. They also estimated the 350 GHz opacity of 2.8 for (and 0.8 for ), hence our result is somewhat lower, but still both results indicate a high opacity condition at submillimeter wavelengths in the eastern nucleus.
The emissivity index and the critical frequency for the western nucleus are less constrained than those for the eastern nucleus, but are better constrained than the past observations. Our fitting results indicate a shallow emissivity index of about unity and a low critical frequency of GHz. Downes & Eckart (2007) estimated the 230 GHz opacity as and Sakamoto et al. (2008) estimated the 350 GHz opacity as for (the estimated ranges depends on the source size and the flux errors). Both of these observations and our results indicate the western nucleus is optically thick at submillimeter wavelengths.
The fitted temperature for the western nucleus, on the other hand, has a large range, and therefore it does not set a tighter limit than the past estimations. It appears that the western nucleus is warmer than the eastern nucleus, with dust temperatures of a few hundred Kelvin. Downes & Eckart (2007) suggested a dust temperature of 170 K, and Sakamoto et al. (2008) derived a temperature of 90 – 180 K, hence our estimate is consistent.
Our results indicate that the derived properties, especially the emissivity, indices are different between the two nuclei, suggesting that the dust properties, such as dust size distributions or dust compositions, are different. This difference may reflect the dust properties of the original host galaxies of each nucleus, or the difference in activities, such as star formation or AGN activities, in the nuclei after the merger.
4.2. Extended Component in the Dust Emission
Our m (689 GHz) continuum data missed a significant amount () of the total flux. Here we discuss whether this missing flux can be attributed to an extended component in the dust emission. The molecular gas clearly has an extended component with a size of ( kpc), which is interpreted as a molecular gas disk from the gas kinematics (Scoville et al., 1997; Downes & Solomon, 1998; Sakamoto et al., 1999). In dust emission, on the other hand, the extended component is weakly detected or not detected at a significant signal level. At 1.3 mm, Downes & Solomon (1998) suggested that the flux of mJy can be attributed to the flux from the extended component, but Sakamoto et al. (1999) did not detect any significant emission from the extended component. At , Sakamoto et al. (2008) attributed about 25% of the total flux density emission from outside the two nuclei.
| Source | I(12CO 2-1) | I(12CO 3-2) | I(12CO 6-5) | 12CO(6-5)/(2-1) | 12CO(6-5)/(3-2) | 12CO(3-2)/(2-1) |
|---|---|---|---|---|---|---|
| [K km s-1] | [K km s-1] | [K km s-1] | ||||
| East Nucleus | ||||||
| West Nucleus |


Assuming that all of the missing flux of our m continuum data is from the extended component, we derived the dust properties of this extended component using the fitting mentioned above using the data between 1.3 mm and m. We adopt for the size of this component the same size that we adopted for the fitting of the total flux density, which is (Scoville et al., 1997). The fitting result is shown in Fig. 2 with a dash-dotted line, and the derived values are K, , and the GHz (m). These values are roughly consistent with the values derived by González-Alfonso et al. (2004) using ISO LWS data; they derived for the extended component K, GHz (m), and a source size of (these values vary depending on their models) assuming of 2.0. These results suggest that a significant amount () of m flux is in the extended component as mentioned in Sect. 3.1, contrary to the longer wavelengths where continuum is dominantly from the two nuclei.
A recent SMA U/LIRG survey shows that many of the sample galaxies (9 out of 14) have large missing fluxes (typically ) in m continuum emission, even though many of the galaxies also show compact distributions. This result suggests that many of ULIRGs have extended continuum emission with very luminous compact cores (Wilson et al., 2008), similar to the results of Arp 220.
4.3. Excitation Conditions of Molecular Gas in the Two Nuclei
We made 12CO SEDs of the two nuclei using our 12CO(6-5) data with the interferometric 12CO(2-1) and 12CO(3-2) data (Sakamoto et al., 1999, 2008) to study the 12CO excitation conditions. We first matched the shortest distance for all three data sets, and imaged at the same synthesized beam size of with P.A. of , which is the same spatial resolution as our 12CO(6-5) image. The integrated intensities and line ratios of these three lines for each nucleus are listed in Table 3, and the relative 12CO intensities of various transitions are shown in Fig. 9 for each nucleus.
The decrease of 12CO intensities toward higher-J in the western nucleus is smaller than that in the eastern nucleus, and indeed the intensity ratios are higher for the western nucleus than those for the eastern nucleus. These differences are, however, within observational errors. Thus the difference in the excitation conditions of molecular gas between the two nuclei is not significant.
To discuss the excitation conditions more quantitatively, we estimated the excitation conditions of the molecular gas using the large-velocity-gradient (LVG) approximation (Goldreich & Kwan, 1974). The collision rates for CO of K were taken from Flower & Launay (1985) and of K were from McKee et al. (1982). In these calculations, we assume that all the 12CO emission comes from the same region (i.e., one-zone model), and assume the 12CO relative abundance over velocity gradient, (12CO)/(), of (km s-1 pc-1)-1. In Fig. 9(a), we overplotted two kinds of curves, one (dashed lines) is to see the temperature dependence (we fixed of cm-3), and another (dotted lines) is to see the number density dependence (we fixed of 50 K). We only plotted the curves close to upper or lower limits to show the possible ranges of the excitation conditions and the goodness of the fitting. Under the above LVG assumptions, it is estimated that the eastern nucleus has a molecular gas temperature of K, or a density of cm-3. For the western nucleus, we could only derive the lower limits, which are K for temperature and cm-3 for density. As mentioned above, the estimated molecular gas conditions for the two nuclei overlap, but the western nucleus tends to have higher temperature or density than the eastern nucleus. This tendency is similar to that derived from the dust SED fitting (Sect. 4.1). Indeed, the derived molecular gas and dust temperatures for both nuclei match well. This suggests that both the molecular gas and dust reside at similar regions and in thermal equilibrium.
We also calculated the dependence of our results on (12CO)/(). If we decrease (12CO)/() by an order of magnitude (i.e., decrease the 12CO relative abundance or increase the velocity gradient or both; we fixed of cm-3 or of 100 K), the temperature or the density increases by about a factor of a few in both nuclei. If we increase (12CO)/() by an order of magnitude (we fixed of cm-3 or of 30 K), the temperature or the density decreases by about a factor of a few. Therefore a small (within an order of magnitude) change in (12CO)/() does not change the result significantly.
Our 12CO SEDs are compared with those of other galaxies in Fig. 9(b). We plotted the multi-J 12CO intensities of the Galactic Center (normal and quiescent galaxy), M82 (nearby starburst galaxy), Mrk 231 (evolved ULIRG with an AGN at the nucleus), and BR 1202–0725 (radio-quiet and CO bright high-z quasar at z of 4.69) together with the 12CO SEDs for the Arp 220 nuclei. The brightness temperatures of the Galactic Center quickly decrease with the increase of rotational transitions, but those of BR 1202–0725, M82, and Mrk 231 stay almost constant even at high-J transitions. We overplotted the best fit temperature curves on each source for comparison (as shown in Fig. 9a, higher temperature can be replaced with higher density). The Galactic Center can be modeled well with low temperature (or low density) conditions, but other galaxies are explained with higher temperatures (or higher densities). The two nuclei of Arp 220 is similar to these higher temperature (density) galaxies, and different from the Galactic Center. This suggests that the molecular gas excitation condition in the double nucleus of Arp 220 is similar to these galaxies. Note that the 12CO SED up to J=6-5 or 7-6 data with the current accuracy are not enough to distinguish the excitation conditions between these high temperature (density) galaxies, including the two nuclei of Arp 220. Higher accuracy or higher-J observations are needed to differentiate the excitation conditions of these galaxies.
It is known that Arp 220, M82, and BR 1202–0725 have active star formation inside. The excitation conditions in the two nuclei of Arp 220 and in M82 are averaged over the central a few hundred pc, and that in BR 1202–0725 is averaged over several kpc. M82 has a gradient in the physical conditions from the center to the outer region (Petitpas & Wilson, 2000), and the physical conditions derived above is more similar to those of the center, where the starburst region exist. BR 1202–0725 has two sources, north and south, and the southern source may consist of two sources (Carilli et al., 2002), probably interacting with each other. The similar excitation conditions of molecular gas regardless of the observed regions suggests that the observed molecular gas is biased toward the gas closely related to the star forming regions, and the effect of star forming activities to the exciting conditions of surrounding molecular gas is similar.
The 12CO SED study can also be a useful tool to search for AGN(s), since the nearby Seyfert galaxies exhibit strong enhancement of higher-J 12CO lines toward AGNs (e.g., Matsushita et al., 2004; Hsieh et al., 2008). Fig. 9(b) exhibits, however, that the 12CO SED of the AGN hosting ULIRG Mrk 231 does not display any higher-J enhancement, and 12CO SED comparison between Mrk 231 and the two nuclei of Arp 220 shows no clear difference. In addition, the comparison between Mrk 231, starburst dominated galaxies M82 and BR 1202–0725 also show no clear difference. We therefore could not find any evidence of an AGN in Arp 220 from this 12CO SED study. These results suggest that the AGN contribution to the surrounding molecular gas (at least for Mrk 231) is much smaller than the nearby Seyferts, possibly due to the smoothing effect by a larger (linear scale) beam or to a larger opacity effect toward the AGN.
4.4. Molecular Gas Abundance Anomaly in the Central Region of Arp 220?
As mentioned in Sect. 3.5, we obtained a very low 13CO(2-1)/C18O(2-1) line intensity ratio of about unity. Recent SMA observations toward nearby active star forming galaxies (NGC 253, NGC 1365, and NGC 3256) show 13CO(2-1)/C18O(2-1) ratios of (Sakamoto et al., 2006a, b, 2007). The 13CO(1-0)/C18O(1-0) line ratios in nearby galaxies are (Sage et al., 1991), similar to the J=2-1 ratios. If both the 13CO and the C18O lines are optically thin, the 13CO/C18O line ratios for J=2-1 and J=1-0 are expected to have almost the same values. Some of interferometric 13CO and C18O observations of nearby galaxies show 13CO/C18O ratio of about 2 (Meier & Turner, 2004; Chou et al., 2007), but not unity as in Arp 220 (note that some regions observed by Meier & Turner show the 13CO/C18O ratios of about unity, but the S/Ns are low). The intensity ratio of about unity in Arp 220 is therefore unusual compared with those in other galaxies.
The intensity ratio may be closely related to the abundance ratio; the intensity ratio is expected to be similar to the abundance ratio, if both lines are optically thin. The abundance ratio between 13CO and C18O in our Galaxy is 5.5 for the Solar System and 12.5 for the Galactic Center, and that in external galaxies is (Henkel & Mauersberger, 1993), assuming [13CO]/[C18O] = [13C]/[12C] [16O]/[18O]. Indeed, the abundance ratios and the aforementioned intensity ratios for external galaxies are similar. The intensity ratio of about unity is unusual also from the abundance viewpoint.
Here we discuss possible reasons for this low intensity ratio using the LVG calculations. We assume both 13CO and C18O molecules are located at the same region (one-zone model). Note that since the brightness temperatures are different between these two lines and the 12CO(2-1) line (see Fig. 7), it is evident that these two lines and the 12CO(2-1) line emanate from different regions. We also assume that the [13CO]/[C18O] relative abundance ratio of 4 (Wang et al., 2004). Under this relative abundance ratio, both lines have to be optically thick for the line ratio to be unity. We calculated assuming (13CO)/() of , , and (km s-1 pc-1)-1. (13CO)/() of (km s-1 pc-1)-1 can be explained as the Galactic abundances of [13CO]/[H2] = (Solomon et al., 1979) with the velocity gradient of 1 km s-1 pc-1. Other parameters are the same as in Sect. 4.3.
The calculation results are shown in Fig. 10. In the case of (13CO)/() of (km s-1 pc-1)-1, a high density of cm-3 is needed even for of 10 K, and about an order higher density is needed for 100 K to realize the 13CO(2-1)/C18O(2-1) ratio of . This is because both the 13CO and C18O lines easily become optically thin at lower-J with the increase of temperature, since the population moves to higher-J. To compensate this, the density, and therefore the column density per unit velocity, (13CO or C18O)/(13CO or C18O)/() , also has to be high for both lines to be optically thick. If we increase (13CO)/() by an order of magnitude, the density decreases by about a factor of several at a certain temperature. This is because the increase of (13CO)/() makes the line easier to be optically thick. The response will be opposite if we decrease (13CO)/() by an order of magnitude.
In the case of a lower [13CO]/[C18O] relative abundance ratio of 2 (half the abundance ratio used above with increasing [C18O]), the required density for the ratio of is about an order of magnitude lower at a certain temperature (Fig. 10). This is because the C18O abundance increased from the above condition, the opacity and therefore the intensity of the C18O line become similar to that of the 13CO line.

As shown above, the important parameters for the low 13CO(2-1)/C18O(2-1) ratio are (1) the molecular gas density and hence the column density per unit velocity, and (2) the molecular abundance. First, we discuss the gas density. The molecular gas density needs to be high ( cm-3) for the ratio to be around unity. The molecular gas in Arp 220 indeed contains high density gas, which is supported by the observations of high critical density molecules, such as HCN, HCO+ or CS (e.g., Solomon et al., 1990, 1992; Greve et al., 2008). On the other hand, there are many galaxies with the detections of these high critical density molecular lines, but almost no report of a 13CO(2-1)/C18O(2-1) so far. One possibility of the difference between Arp 220 and other galaxies may be due to the large fraction of dense molecular gas. Our 13CO(2-1) and C18O(2-1) images exhibit compact distribution around the double nucleus, and the molecular gas in Arp 220 is dominated by dense gas (e.g., Greve et al., 2008). If the dense gas is concentrated toward the double nucleus, most of the molecular gas toward the double nucleus can be dominated by dense gas, and this makes the column density high enough to result in the 13CO(2-1)/C18O(2-1) of unity.
Second, we discuss the molecular abundance. To realize the 13CO(2-1)/C18O(2-1) intensity ratio of about unity with changing the abundance, two possibilities can be considered; one is the underabundance of the 13CO molecule, and another is the overabundance of C18O. Deficiency of 13CO abundance is often suggested in merging galaxies based on their larger 12CO(2-1)/13CO(2-1) ratios than those in starburst or Seyfert galaxies (e.g., Aalto et al., 1991; Casoli et al., 1992). But as is mentioned in Sect. 3.5, the observed 12CO(2-1)/13CO(2-1) ratio of Arp 220 is not as extreme as those in the other merging galaxies, and not significantly different from those in starburst or Seyfert galaxies. In addition, the possible reason for the 13CO deficiency is the selective photodissociation of the 13CO molecules (e.g., Casoli et al., 1992). In this case, however, C18O molecules will be more affected by the selective photodissociation (van Dishoeck & Black, 1988; Casoli et al., 1992), hence this cannot be the cause. We therefore think that the underabundance of 13CO is possible, but less likely.
The overabundance of the C18O molecule may be possible to achieve under the circumstance of Arp 220. Massive stars synthesize a large amount of the primary element, 12C, at helium burning phase, and it goes into interstellar medium via supernova explosions (Casoli et al., 1992). The 18O enrichment occurs also in massive stars (Henkel & Mauersberger, 1993; Sage et al., 1991), either Wolf-Rayet stars or type II supernova explosions by partial helium burning (Amari et al., 1995). Since Arp 220 is very active in star formation (Sect. 1), both the 12C and 18O enrichment due to the above mechanism can be realized. This can lead to the enrichment of the C18O molecule. This possibility still needs to be studied quantitatively. Note that a recent molecular gas abundance study toward a young (several Gyr old) galaxy at show low [13CO]/[C18O] of (Muller et al., 2006). This result also suggests that the low intensity ratio is related to an abundance anomaly during the young star formation epoch.
5. CONCLUSIONS
We observed the central region of Arp 220 in the 12CO(6-5), 12CO(2-1), 13CO(2-1), and C18O(2-1) lines, and 435 m and 1.3 mm continuum simultaneously with the SMA. The two nuclei are clearly resolved in the 435 m image, and kinematically resolved in the 12CO(6-5) image.
For the double nucleus, we concluded as follows:
-
•
The difference of the peak intensities in our 435 m image between the two nuclei is smaller than at longer wavelengths. From the dust SED fitting, the dust in the two nuclei is estimated to be optically thick at 435 m. The emissivity indices are estimated to be for the eastern nucleus and for the western nucleus. This suggests that the dust properties, such as dust size distributions or dust compositions, are different between the two nuclei.
-
•
The 12CO SEDs are similar between the two nuclei with the western nucleus having higher upper limits in the excitation conditions than those in the eastern nucleus. The 12CO SEDs for both nuclei and that of M82 or BR 1202–0725 are similar, characterized with small intensity decreases up to J = 6-5 (12CO(6-5)/(2-1) ratio of about 0.5). This suggests that the molecular gas in the two nuclei of Arp 220 has the similar excitation conditions as that in M82 or BR 1202–0725, which have a density of cm-3 or a temperature of K.
-
•
We could not find any evidence of an AGN in Arp 220 with the 12CO SED study. There is no clear difference in the 12CO SEDs between the AGN hosting ULIRG Mrk 231 and the double nucleus of Arp 220 (and therefore M82 and BR 1202–0725). This suggests that the AGN heating is not important for molecular gas excitation conditions in the large scale (a few hundred to a few kpc scale).
For the global characteristics of the molecular gas and dust in Arp 220, we concluded as follows:
-
•
Based on the large amount of missing flux in our data and other previously published evidence in molecular gas and dust, we suggest the existence of an extended component in the dust emission with its dust properties K, , and . A recent SMA U/LIRG survey suggests that many of U/LIRGs seem to have extended components (Wilson et al., 2008), so that having an extended dust component might be common.
-
•
The 12CO(2-1) line spectrum shows stronger line intensity at the lower velocities than the higher velocities, but the spectra of the higher-J lines show the opposite, indicating that the higher velocity gas has higher density, higher temperature, or both, than the lower velocity component.
-
•
The intensities of the 13CO(2-1) and C18O(2-1) lines are similar. This suggests that the molecular gas in Arp 220 is dense enough to be optically thick in both lines, or the abundance of either line deviates from the values in other nearby galaxies. To explain the ratio with the density effect, Arp 220 should have molecular gas largely dominated by dense gas, more than in other nearby galaxies. Underabundance of 13CO is possible, but it is less likely. Overabundance of C18O is also possible, considering the 12C and 18O enrichment by high mass stars.
References
- Aalto et al. (1991) Aalto, S., Black, J. H., Johansson, L. E. B., & Booth, R. S. 1991, A&A, 249, 323
- Aalto et al. (1995) Aalto, S., Booth, R. S., Black, J. H., & Johansson, L. E. B. 1995, A&A, 300, 369
- Amari et al. (1995) Amari, S., Zinner, E., & Lewis, R. S. 1995, ApJ, 447, L147
- Arp (1966) Arp, H. 1966, ApJS, 14, 1
- Barnes & Hernquist (1991) Barnes, J. E., & Hernquist, L. E. 1991, ApJ, 370, L65
- Baudry & Neri (2000) Baudry, A., & Neri, R. 2000, in Proceeding from IRAM Millimeter Interferometry Summer School 2, ed. A. Dutrey, 233
- Borys et al. (2003) Borys, C., Chapman, S., Halpern, M., & Scott, D. 2003, MNRAS, 344, 385
- Carico et al. (1992) Carico, D. P., Keene, J., Soifer, B. T., & Neugebauer, G. 1992, PASP, 104, 1086
- Carilli et al. (2002) Carilli, C. L., Kohno, K., Kawabe, R., Ohta, K., Henkel, C., Menten, K. M., Yun, M. S., Petric, A., & Tutui, Y. 2002, AJ, 123, 1838
- Casoli et al. (1992) Casoli, F., Dupraz, C., & Combes, F. 1992, A&A, 264, 55
- Chou et al. (2007) Chou, R. C.-Y., Peck, A. B., Lim, J., Matsushita, S., Muller, S., Sawada-Satoh, S., Dinh-V-Trung, Boone, F., & Henkel, C. 2007, ApJ, 670, 116
- Downes & Eckart (2007) Downes, D., & Eckart, A. 2007, A&A, 468, L57
- Downes & Solomon (1998) Downes, D., & Solomon, P. M. 1998, ApJ, 507, 615
- Dunne & Eales (2001) Dunne, L., & Eales, S. A. 2001, MNRAS, 327, 697
- Eales et al. (1999) Eales, S., Lilly, S., Gear, W., Dunne, L., Bond, J. R., Hammer, F., Le Fev̀re, O., & Crampton, D. 1999, ApJ, 515, 518
- Eales et al. (2000) Eales, S., Lilly, S., Webb, T., Dunne, L., Gear, W., Clements, D., & Yun, M. 2000, AJ, 120, 2244
- Eales et al. (1989) Eales, S. A., Wynn-Williams, C. G., & Duncan, W. D. 1989, ApJ, 339, 859
- Fixsen et al. (1999) Fixsen, D. J., Bennett, C. L., & Mather, J. C. 1999, ApJ, 526, 207
- Flower & Launay (1985) Flower, D. R., & Launay, J. M. 1985, MNRAS, 214, 271
- Gao & Solomon (2004) Gao, Y., & Solomon, P. M. 2004, ApJ, 606, 271
- Glenn & Hunter (2001) Glenn, J., & Hunter, T. R. 2001, ApJS, 135, 177
- Goldreich & Kwan (1974) Goldreich, P., & Kwan, J. 1974, ApJ, 189, 441
- González-Alfonso et al. (2004) González-Alfonso, E., Smith, H. A., Fischer, J., & Cernicharo, J. 2004, ApJ, 613, 247
- Graham et al. (1990) Graham, J. R., Carico, D. P., Matthews, K., Neugebauer, G., Soifer, B. T., & Wilson, T. D. 1990 ApJ, 354, L5
- Greve et al. (2005) Greve, T. R., et al. 2005, MNRAS, 359, 1165
- Greve et al. (2008) Greve, T. R., Papadopoulos, P. P., Gao, Y., & Radford, S. J. E. 2008, ApJ, submitted (astro-ph/0610378)
- Henkel & Mauersberger (1993) Henkel, C., & Mauersberger, R. 1993, A&A, 274, 730
- Hernquist (1992) Hernquist, L. 1992, ApJ, 400, 460
- Hernquist (1993) Hernquist, L. 1993, ApJ, 409, 548
- Ho et al. (2004) Ho, P. T. P., Moran, J. M., & Lo, F. 2004, ApJ, 616, L1
- Hsieh et al. (2008) Hsieh, P.-Y., Matsushita, S., Lim, J., Kohno, K., & Sawada-Satoh, S. 2008, ApJ, 683, 70
- Hughes et al. (1998) Hughes, D. H., et al. 1998, Nature, 394, 241
- Joseph & Wright (1985) Joseph, R. D., & Wright, G. S. 1985, MNRAS, 214, 87
- Klass et al. (2001) Klaas, U., et al. 2001, A&A, 379, 823
- Lonsdale et al. (2006) Lonsdale, C. J., Diamond, P. J., Thrall, H., Smith, H. E., & Lonsdale, C. J. 2006, ApJ, 647, 185
- Matsushita et al. (2004) Matsushita, S., et al. 2004, ApJ, 616, L55
- McKee et al. (1982) McKee, C. F., Storey, J. W. V., Watson, D. W., & Green, S. 1982, ApJ, 259, 647
- Meier & Turner (2004) Meier, D. S., & Turner, J. L. 2004, AJ, 127, 2069
- Mihos & Hernquist (1996) Mihos, J. C., & Hernquist, L. 1996, ApJ, 464, 641
- Muller et al. (2006) Muller, S., Guélin, M., Dumke, M., Lucas, R., & Combes, F. 2006, A&A, 458, 417
- Norris (1988) Norris, R. P. 1988, MNRAS, 230, 345
- Ohta et al. (1996) Ohta, K., Yamada, T., Nakanishi, K., Kohno, K., Akiyama, M., & Kawabe, R. 1996, Nature, 382, 426
- Omont et al. (1996) Omont, A., Petitjean, P., Guilloteau, S., McMahon, R. G., Solomon, P. M., & Pécontal, E. 1996, Nature, 382, 428
- Papadopoulos & Seaquist (1998) Papadopoulos, P. P., & Seaquist, E. R. 1998, ApJ, 492, 521
- Papadopoulos et al. (2007) Papadopoulos, P. P., Isaak, K. G., & van der Werf, P. P. 2007, ApJ, 668, 815
- Parra et al. (2007) Parra, R., Conway, J. E., Diamond, P. J., Thrall, H., Lonsdale, C. J., Lonsdale, C. J., & Smith, H. E. 2007, ApJ, 659, 314
- Petitpas & Wilson (2000) Petitpas, G. R., & Wilson, C. D. 2000, ApJ, 538, L117
- Riechers et al. (2006) Riechers, D. A., et al. 2006, ApJ, 650, 604
- Rigopoulou et al. (1996) Rigopoulou, D., Lawrence, A., & Rowan-Robinson, M. 1996, MNRAS, 278, 1049
- Sage et al. (1991) Sage, L. J., Mauersberger, R., & Henkel, C. 1991, A&A, 249, 31
- Sakamoto et al. (2006a) Sakamoto, K., et al. 2006, ApJ, 636, 685
- Sakamoto et al. (2007) Sakamoto, K., Ho, P. T. P., Mao, R.-Q., Matsushita, S., & Peck, A. B., 2007, ApJ, 654, 782
- Sakamoto et al. (2006b) Sakamoto, K., Ho, P. T. P. & Peck, A. B. 2006, ApJ, 644, 862
- Sakamoto et al. (1999) Sakamoto, K., Scoville, N. Z., Yun, M. S., Crosas, M., Genzel, R., & Tacconi, L. J. 1999, ApJ, 514, 68
- Sakamoto et al. (2008) Sakamoto, K., Wang, J., Wiedner, M. C., Wang, Z., Peck, A. B., Zhang, Q., Petitpas, G. R., Ho, P. T. P., & Wilner, D. 2008, ApJ, 684, 957
- Sanders et al. (2003) Sanders, D. B., Mazzarella, J. M., Kim, D.-C., Surace, J. A., & Soifer, B. T. 2003, AJ, 126, 1607
- Scott et al. (2002) Scott, S. E., et al. 2002, MNRAS, 331, 817
- Scoville et al. (1998) Scoville, N. Z., et al. 1998, ApJ, 492, L107
- Scoville et al. (1991) Scoville, N. Z., Sargent, A. I., Sanders, D. B., & Soifer, B. T. 1991, ApJ, 366, L5
- Scoville et al. (1997) Scoville, N. Z., Yun, M. S., & Bryant, P. M. 1997, ApJ, 484, 702
- Smith et al. (1998) Smith, H. E., Lonsdale, C. J., Lonsdale, C. J., & Diamond, P. J. 1998, ApJ, 493, L17
- Soifer et al. (1999) Soifer, B. T., Neugebauer, G., Matthews, K., Becklin, E. E., Ressler, M., Werner, M. W., Weinberger, A. J., & Egami, E. 1999, ApJ, 513, 207
- Solomon et al. (1992) Solomon, P. M., Downes, D., & Radford, S. J. E. 1992, ApJ, 387, L55
- Solomon et al. (1990) Solomon, P. M., Radford, S. J. E., & Downes, D. 1990, ApJ, 348, L53
- Solomon et al. (1979) Solomon, P. M., Scoville, N. Z., & Sanders, D. B. 1979, ApJ, 232, L89
- Tacconi et al. (2006) Tacconi, L. J., et al. 2006, ApJ, 640, 228
- van Dishoeck & Black (1988) van Dishoeck, E. F., & Black, J. H. 1988, ApJ, 334, 771
- Wang et al. (2004) Wang, M., Henkel, C., Chin, Y.-N., Whiteoak, J. B., Cunningham, M. H., Mauersberger, R., & Muders, D. 2004, A&A, 422, 883
- Weiß et al. (2005a) Weiß, A., Walter, F., & Scoville, N. Z. 2005a, A&A, 438, 533
- Weiß et al. (2005b) Weiß, A., Downes, D., Walter, F., & Henkel, C. 2005b, A&A, 440, L45
- Weiß et al. (2007) Weiß, A., Downes, D., Neri, R., Walter, F., Henkel, C., Wilner, D. J., Wagg, J., & Wiklind, T. 2007, A&A, 467, 955
- Wiedner et al. (2002) Wiedner, M. C., Wilson, C. D., Harrison, A., Hills, R. E., Lay, O. P., & Carlstron, J. E. 2002, ApJ, 581, 229
- Wilson et al. (2008) Wilson, C. D., et al. 2008, ApJS, 178, 189
- Woody et al. (1989) Woody, D. P., Scott, S. L., Scoville, N. Z., Mundy, L. G., Sargent, A. I., Padin, S., Tinney, C. G., & Wilson, C. D. 1989, ApJ, 337, L41