Magnetic exchange interaction between rare-earth and Mn ions in multiferroic hexagonal manganites
Abstract
We report a study of magnetic dynamics in multiferroic hexagonal manganite HoMnO3 by far-infrared spectroscopy. Low-temperature magnetic excitation spectrum of HoMnO3 consists of magnetic-dipole transitions of Ho ions within the crystal-field split manifold and of the triangular antiferromagnetic resonance of Mn ions. We determine the effective spin Hamiltonian for the Ho ion ground state. The magnetic-field splitting of the Mn antiferromagnetic resonance allows us to measure the magnetic exchange coupling between the rare-earth and Mn ions.
Superexchange is one of the main concepts of magnetism in solids. Recently, superexchange was found to mediate magnetoelectric (ME) coupling in multiferroics - materials with coexisting magnetic and ferroelectric ordersHur et al. (2004); Lottermoser et al. (2004); Cheong and Mostovoy (2007). ME coupling may find important technological applications, for example, in an electric-write magnetic-read memory elementScott (2007). Multiferroic hexagonal manganites display robust room-temperature ferroelectricity and remarkable ME behaviorFiebig et al. (2002) that allow technological exploitationFujimura et al. (1996). In these multiferroics, the superexchange interaction between the rare-earth and Mn ions is responsible for the strong ME coupling that allows the control of ferromagnetism by an electric fieldLottermoser et al. (2004). The details of the rare-earth/Mn superexchange coupling have heretofore remained unknown. Here, we report the measurement of the rare-earth/Mn superexchange in multiferroic hexagonal HoMnO3 via the detection of an antiferromagnetic resonance by far-infrared (far-IR) spectroscopy. These results demonstrate the ferromagnetic nature of the rare-earth/Mn exchange that enables the electric-field control of magnetism in HoMnO3.
HoMnO3 (HMO) crystallizes in a hexagonal lattice, space group . The crystal structure consists of layers of corner-sharing trigonal MnO5 bipyramids separated by layers of Ho3+ ionsLottermoser et al. (2004). Ferroelectric polarization along the axis ( K) results from electrostatic and size effects that lead to the buckling of MnO5 bipyramids and the displacement of the Ho3+ ions out of the - planeLottermoser et al. (2004); Aken et al. (2004). The magnetic structure is formed by Mn3+ ions in a two-dimensional triangular network in the - plane coupled by antiferromagnetic (AF) exchange and also by Ho3+ () ions located at Ho(1) and Ho(2) lattice sites with point symmetries and , respectivelyMunoz et al. (2001); Iliev et al. (1997). The AF exchange between Mn3+ magnetic moments leads to their 120o ordering at KVajk et al. (2005); Hur et al. (2008), and easy plane anisotropy confines the Mn spins to the - plane. Two in-plane spin reorientation transitions occur at temperatures K and K associated with changes of magnetic symmetry to and to , respectivelyVajk et al. (2005); Munoz et al. (2001); Fiebig et al. (2000). The spin reorientation at K is accompanied by antiferromagnetic ordering of the Ho3+ ions located at the Ho(2) lattice sitesMunoz et al. (2001). Several manifestations of ME coupling in HMO have been documented, one of the most prominent being the presence of the reentrant phase with a strong magnetodielectric responseLottermoser et al. (2004); Lottermoser and Fiebig (2004); Lorenz et al. (2004); dela Cruz et al. (2005); Yen et al. (2005).
The HMO single crystals were grown using an optical floating zone furnaceHur et al. (2008). The material’s magnetic phase diagramHur et al. (2008) at temperatures above 5 K displays the reentrant phase discovered by Lorenz Lorenz et al. (2004). Polarized far-IR transmission of a 0.4 mm thick, (110) oriented crystal was measured as a function of temperature and applied magnetic field using a Bruker 66 Fourier-transform spectrometer coupled to an 8 Tesla split-coil superconducting magnetPadilla et al. (2004). Static magnetic field was applied both parallel and perpendicular to the axis.
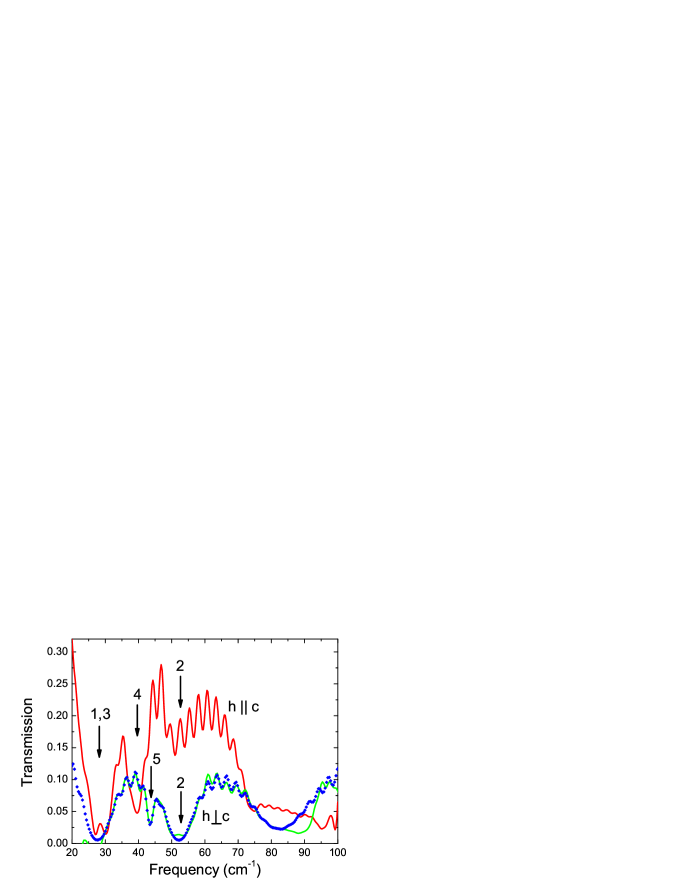
Figure 1 shows far-IR power transmission spectra of the HMO crystal at low temperatures and zero magnetic field for two polarizations of the light incident along the [110] direction - the magnetic -field of the lightwave parallel () and perpendicular () to the axis. The spectra in Fig. 1 are normalized to the transmission through an empty aperture of the same size as the sample. The fringes with the period of seen in the spectra are due to multiple reflections of light within the sample. The transmission minima indicated by arrows correspond to magnetic resonance frequencies. The broad absorption in both polarizations at frequencies above is of non-magnetic origin, as it exhibits no magnetic field dependence. The dotted line in Fig. 1 shows the simulated transmission, assuming that the magnetic and dielectric response of HMO consists of a collection of lorentzian oscillators:
| (1) | |||||
| (2) |
where , , and are frequency, relaxation rate, and oscillator strength of magnetic resonances. and are constants, and , , and are introduced to account for the non-magnetic absorption above 70 cm-1.
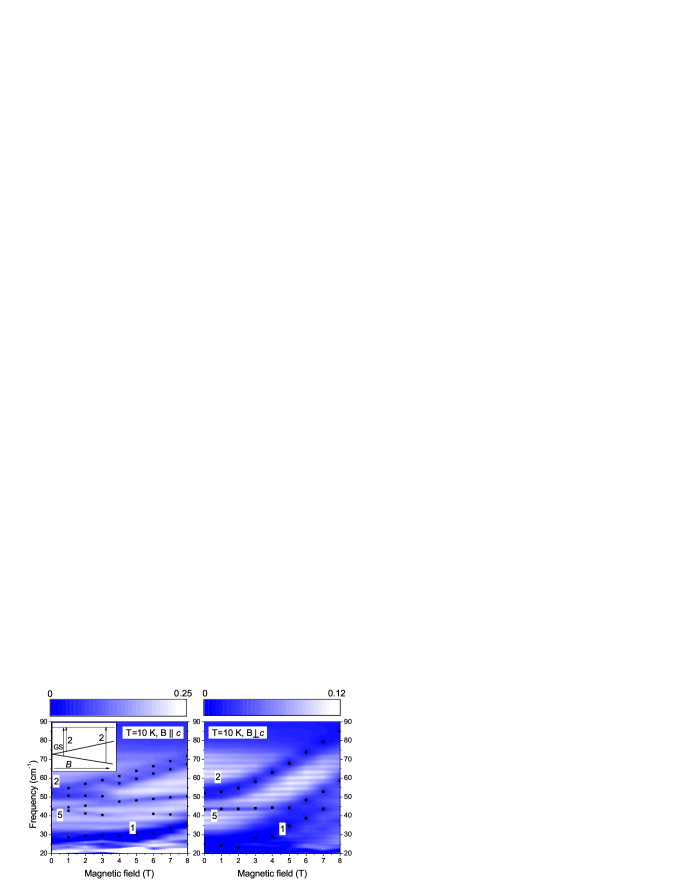
Color-coded transmission maps in Fig. 2 illustrate the magnetic field dependence of the resonance frequencies at T=10 K. To create the maps, we recorded the transmission spectra in 1 T steps between 0 and 8 T. The darker color in Fig. 2 indicates lower transmission and the white color indicates where the transmission is the highest; the symbols specify the positions of magnetic resonances extracted from the numerical simulation of the far-IR transmission. In the remainder of this Letter, we show that the magnetic field dependence of the resonance frequencies carries an unambiguous signature of the superexchange interaction between magnetic Ho3+ and Mn3+ ions that allows us to quantify the interaction.
We attribute the absorption lines labeled 1-4 in Figs. 1 and 2 to crystal field excitations of Ho3+ ions. The crystal fields of and symmetry have qualitatively similar effects on the Ho ion. According to the work of Elliott and StevensAbragam and Bleaney (1970), the crystal field potential can be written in terms of spin operators , , and for the manifold of states of constant . The diagonal part of depends only on and . The off-diagonal part of has non-zero matrix elements only between the states and that differ by , , in the field of symmetry and by , , in the field of symmetry. In zero applied magnetic field, the degenerate manifold splits into a set of singlet and doublet states of the form and , respectively. We restrict our discussion to a qualitative description of the observed crystal field transitions, as the frequency range of in our far-IR measurements does not allow us to characterize all magnetic-dipole active crystal field transitions and determine the crystal field parameters. For example, the transition observed by inelastic neutron scatteringVajk et al. (2005) is outside of our accessible frequency range.
The magnetic-dipole selection rule for the () polarization allows only transitions with . This rule forbids transitions between singlets, but allows transitions between singlets and doublets and between different doublets. Transitions 1 and 2 are strong in the () polarization (Fig. 2) but are very faint in the () polarization, which suggests that they are allowed in the former, but forbidden in the latter, polarization. Since we observe transition 2 in the highest applied magnetic fields, it must be the transition from the ground state. The final state of the transition could be either a doublet or a singlet. With a magnetic field applied along the axis (left panel of Fig. 2 and its inset) the transition splits linearly, a characteristic of the Zeeman splitting of a doublet. The lower branch of the Zeeman-split transition disappears when the applied field increases beyond 3 T, which is indicative of a thermal depopulation of the upper branch of the Zeeman-split ground state doublet. The slope of the upper branch of transition 2 allows an estimation of the -factor in the effective spin Hamiltonian , , that describes the ground state. Assuming that the final state of the transition is a singlet with energy independent of the applied field (at sufficiently low fields), we get . The magnetic field perpendicular to the axis produces no Zeeman splitting of the ground state doublet. Therefore, neglecting the mixing of the ground state with higher energy levels at sufficiently low field , we set . The upper branch of transition 2 is further split by about in magnetic fields along the axis, which we attribute to hyperfine interactions.
We now turn to the magnetic response of Mn ions in HMO and assign the sharp absorption line at in the () polarization to the antiferromagnetic resonance (AFMR) of the triangular lattice of Mn magnetic moments (transition 5 in Figs. 1, 2). This assignment is supported by the observation of the triangular AFMR at the same frequency () and light polarization in hexagonal YMnO3Penney et al. (1969), a related compound with the same Mn magnetic structure and similar exchange and anisotropy parametersSato et al. (2003). The AFMR corresponds to the gapped magnon detected by inelastic neutron scattering at in HMOVajk et al. (2005). The similarity between the magnon frequency and the position of the AFMR in our data further supports the assignment of the resonance. The magnetic field dependence of the AFMR agrees qualitatively with the expected linear splitting induced by the field applied along the axis () (left panel of Fig. 2). A slight increase in the AFMR frequency and no splitting of the resonance are observed in fields up to 5 T applied perpendicular to the axis (). In fields of 5 T and higher, the AFMR line is hard to identify, as it becomes a part of the broad absorption band due to the crystal field levels of Ho ions (right panel of Fig. 2). The same qualitative behaviour, , linear splitting with and no splitting with , in fields up to 5.4 T was recorded for the AFMR in YMnO3Penney et al. (1969).
To quantify the magnetic-field behaviour of the AFMR, we use the following free energy:
| (3) |
where , , are the three sublattice magnetizations within the plane, describes the antiferromagnetic exchange between the sublattices, and represents the easy-plane anisotropy. The excitation spectrum of the free energy (3) consists of a zero-frequency mode corresponding to global rotations of the sublattices about the axis and a doubly-degenerate gapped mode whose degeneracy is lifted by the application of . The analytical expression for the frequency of the gapped mode in was given by Palme Palme et al. (1990):
| (4) | |||||
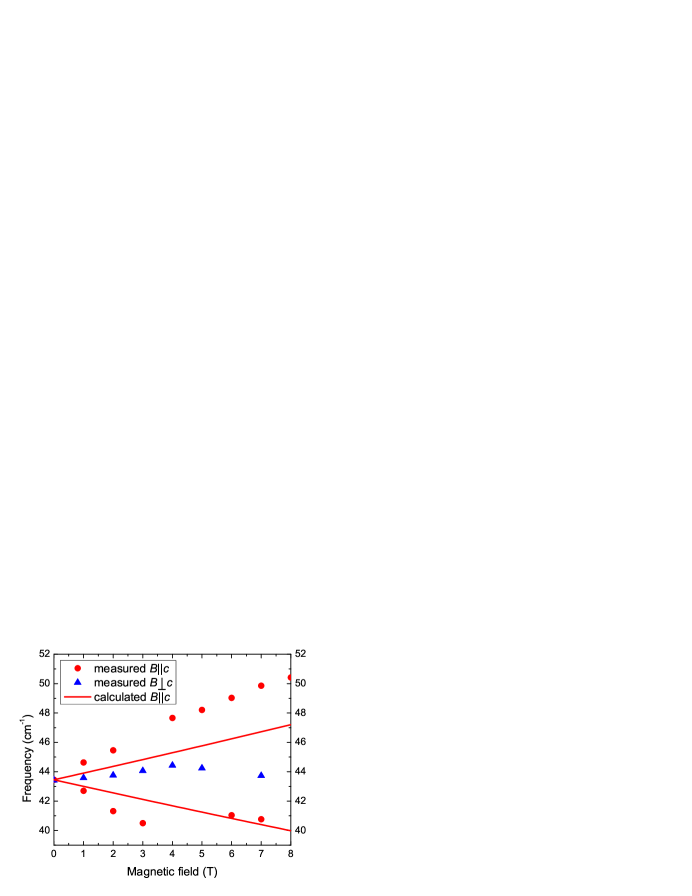
where , , the exchange field , the anisotropy field , and is the sublattice magnetization. Equation (3) is a molecular-field version of the Hamiltonian used by Vajk to describe the spinwave dispersion in HMOVajk et al. (2005). In this picture, T and T, where and are the exchange and anisotropy parameters measured by inelastic neutron scattering and is the total spin of Mn ions. The value of was lowered slightly to reproduce the zero-field AFMR frequency observed in our far-IR study. The field dependence of the AFMR calculated using Eq. (4) and the -factor is shown in Fig. 3. The calculated frequencies largely disagree with the measured ones as the measured splitting is about twice the calculated splitting. For comparison, the splitting of the AFMR in YMnO3 is in good agreement with our calculation: the measured splitting of at T ()Penney et al. (1969) agrees with the calculated value of , as determined from exchange and anisotropy fields measured by inelastic neutron scatteringSato et al. (2003) in YMnO3foo .
What causes the large discrepancy between the measured and calculated splitting of the AFMR line in HMO? Our calculation describes well the AFMR in YMnO3, a material that is largely similar to HMO, but with one important difference: the Y3+ ions are not magnetic. Therefore, we conclude that the magnetic Ho ions in HMO are responsible for the discrepancy. The Mn ions in HMO interact with the surrounding Ho ions via an exchange coupling of the form , where and are the angular momenta of Mn and Ho ions. Using the equivalence of matrix elements , where is the Lande factor, and are the effective g-factor and spin for the Ho ion ground state, we can write the exchange Hamiltonian asAbragam and Bleaney (1970) where , etc. We found earlier that and , which reduces the Hamiltonian to . In magnetic field applied along the axis, we can replace by its thermal average and write , where is the magnetic susceptibility of Ho ions. The last expression shows that the Ho-Mn (HM) exchange interaction is equivalent to an effective magnetic field acting on Mn spins. To describe the effect of the HM exchange on the AFMR, we add the term
| (5) |
where =6 is the number of Ho ions neighboring a Mn ion, to the free energy of the Eq. (3). The total magnetic field acting on Mn ions is then the sum of the external static field and the effective field of Ho ions, , and can be larger or smaller than the external field, thus enhancing or mitigating its effect on the AFMR. Comparing the measured AFMR splitting and the splitting calculated using Eq. (3), we find that , which corresponds to ferromagnetic HM coupling.
We can account for the two kinds of Ho lattice sites (Ho(1) and Ho(2)) by writing , where and are the HM exchange constants for each site. Each Mn ion has two Ho(1) ions and four Ho(2) ions as Ho nearest neighbors. The two Ho lattice sites are distinct because of the ferroelectric displacements. Such displacements are significantly smaller that interionic distances in HoMnO3, and the approximation is expected to be a good one. Otherwise, we must use the above combination of and in the definition of in Eq. (5).
Before we conclude, we consider the possible effect of phonon coupling on the frequencies of the studied magnetic excitations. The most prominent signature of such coupling is the anti-crossing of the coupled magnetic and lattice modes. Such anti-crossing is expected to be strongest when the frequencies of the two modes are similar, as shown on the right panel of Fig. 2, where the strong magnetic absorption line overlaps at high magnetic field with the non-magnetic absorption at 70. At all magnetic fields, we see no measurable changes to the 70 excitation. Thus, we conclude that we detect no measurable coupling between magnetic and lattice vibrations.
The measured ferromagnetic HM exchange plays a significant role in all aspects of the physics of HoMnO3. It causes the electric-field induced ferromagnetic ordering of Ho magnetic moments along the axisLottermoser et al. (2004) and may also be responsible for the multitude of low-temperature (T8 K) magnetic phases and the two Mn spin reorientation transitions in HMOVajk et al. (2005). The reentrant phase that is induced in HMO by magnetic field displays a strong magnetodielectric effect and was explained by the formation of magnetic domain walls during spin reorientation, which reduces the local magnetic symmetry and allows the coupling between magnetic and ferroelectric polarizationsLorenz et al. (2004); Lottermoser and Fiebig (2004). Theoretical descriptions of such magnetoelectricity must include domain wall contributions to the free energy from lattice distortions and magnetic superexchange interactions. Such descriptions are incomplete without the consideration of the magnetic exchange between the Ho and Mn ions. Our measurement of the ferromagnetic HM exchange provides an important contribution to the modeling of the interplay between magnetism and ferroelectricity in HoMnO3.
We thank Darryl Smith for useful theoretical discussions and Jonathan Gigax for the simulation of the Ho crystal field eigenstates. The work at LANL was supported by the LDRD program and the Center for Integrated Nanotechnologies. The work at UCSD was supported by NSF DMR 0705171.
References
- Hur et al. (2004) N. Hur, S. Park, P. A. Sharma, J. S. Ahn, S. Guha, and S.-W. Cheong, Nature 429, 392 (2004).
- Lottermoser et al. (2004) T. Lottermoser, T. Lonkai, U. Amann, D. Hohlwein, J. Ihringer, and M. Fiebig, Nature 430, 541 (2004).
- Cheong and Mostovoy (2007) S.-W. Cheong and M. Mostovoy, Nature Mat. 6, 13 (2007).
- Scott (2007) J. Scott, Science 315, 954 (2007).
- Fiebig et al. (2002) M. Fiebig, T. Lottermoser, D. Frohlich, A. Goltsev, and R. Pisarev, Nature 419, 818 (2002).
- Fujimura et al. (1996) N. Fujimura, T. Ishida, T. Yoshimura, and T. Ito, Appl. Phys. Lett. 69, 1011 (1996).
- Aken et al. (2004) B. B. V. Aken, T. T. M. Palstra, A. Filippetti, and N. A. Spaldin, Nature Mat. 3, 164 (2004).
- Munoz et al. (2001) A. Munoz, J. A. Alonso, M. J. Martínez-Lope, M. T. Casáis, J. L. Martínez, and M. T. Fernández-Díaz, Chem. Mater. 13, 1497 (2001).
- Iliev et al. (1997) M. N. Iliev, H.-G. Lee, V. N. Popov, M. V. Abrashev, A. Hamed, R. L. Meng, and C. W. Chu, Phys. Rev. B 56, 2488 (1997).
- Vajk et al. (2005) O. P. Vajk, M. Kenzelmann, J. W. Lynn, S. B. Kim, and S.-W. Cheong, Phys. Rev. Lett. 94, 087601 (2005).
- Hur et al. (2008) N. Hur, I. K. Jeong, M. F. Hundley, S. B. Kim, and S.-W. Cheong, cond-mat:0805.3289 (2008).
- Fiebig et al. (2000) M. Fiebig, D. Frohlich, K. Kohn, S. Leute, T. Lottermoser, V. V. Pavlov, and R. V. Pisarev, Phys. Rev. Lett. 84, 5620 (2000).
- Lottermoser and Fiebig (2004) T. Lottermoser and M. Fiebig, Phys. Rev. B 70, 220407(R) (2004).
- Lorenz et al. (2004) B. Lorenz, A. P. Litvinchuk, M. M. Gospodinov, and C. W. Chu, Phys. Rev. Lett. 92, 087204 (2004).
- dela Cruz et al. (2005) C. dela Cruz, F. Yen, B. Lorenz, Y. Q. Wang, Y. Y. Sun, M. M. Gospodinov, and C. W. Chu, Phys. Rev. B 71, 060407(R) (2005).
- Yen et al. (2005) F. Yen, C. R. dela Cruz, B. Lorenz, Y. Y. Sun, Y. Q. Wang, M. M. Gospodinov, and C. W. Chu, Phys. Rev. B 71, 180407(R) (2005).
- Padilla et al. (2004) W. J. Padilla, Z. Q. Li, K. S. Burch, Y. S. Lee, and D. N. Basov, Rev. Sci. Instr. 75, 4710 (2004).
- Abragam and Bleaney (1970) A. Abragam and B. Bleaney, Electron paramagnetic resonance of transition ions (Clarendon Press, Oxford, 1970).
- Penney et al. (1969) T. Penney, P. Berger, and K. Kritiyakirana, J. Appl. Phys. 40, 1234 (1969).
- Sato et al. (2003) T. J. Sato, S.-H. Lee, T. Katsufuji, M. Masaki, S. Park, J. R. D. Copley, and H. Takagi, Phys. Rev. B 68, 014432 (2003).
- Palme et al. (1990) W. Palme, F. Mertens, O. Born, B. Luthi, and U. Schotte, Solid State Comm. 76, 873 (1990).
- (22) Sato Sato et al. (2003) find that the chemical triangular lattice of Mn ions is slightly trimerized with exchange strength between the nearest neighbors belonging to the same trimer and exchange strength between the ions belonging to neighboring trimers. The zero wave-vector magnon spectrum of the trimerized chemical lattice is calculated using Eq. (4) and the substitution .