Absolute absorption spectroscopy based on molecule interferometry
Abstract
We propose a new method to measure the absolute photon absorption cross section of neutral molecules in a molecular beam. It is independent of our knowledge of the particle beam density, nor does it rely on photo-induced fragmentation or ionization. The method is based on resolving the recoil resulting from photon absorption by means of near-field matter-wave interference, and it thus applies even to very dilute beams with low optical densities. Our discussion includes the possibility of internal state conversion as well as fluorescence. We assess the influence of various experimental uncertainties and show that the measurement of absolute absorption cross sections is conceivable with high precision and using existing technologies.
I Introduction
Optical spectroscopy is a key technology for unraveling electronic, vibrational, rotational and structural properties of atoms, molecules and clusters with applications in physics, astronomy, chemistry, and biology. Specifically, their absorption cross sections are nowadays routinely measured with commercial spectrometers, using a large number of precise and sensitive methods covered in modern textbooks Scoles1988a ; Kreibig1995a ; Berkowitz2002a . A general interest in these applications is to improve the spectral resolution, the sensitivity to small sample quantities, and the precision with regard to the absolute magnitude of the absorption cross section.
In the present article, we propose a new method for determining the absolute value of the absorption cross section of neutral nanoparticles at a given optical frequency. In molecular or cluster beam physics this is usually a non-trivial task: Although absolute absorption coefficients can be measured rather precisely even at low densities, the extraction of absorption cross sections is often limited to volatile substances, whose pressure and number density can be determined with sufficient accuracy Sakurai1975a ; Chen1999a . For complex nanoparticles, information about the particle number is often only available with low precision. Instead, some experiments occasionally use information about the absorption cross section to characterize the supersonic beam composition Boogaarts1995a . Even for effusive beams, which are better controlled and understood, inaccuracies in measuring the source pressure often lead to a large error in the derived optical cross section Coheur1996a ; Yasumatsu1996a .
In all these cases, optical spectra may still be recorded with very high spectral resolution using established methods, yet to properly normalize the entire spectrum it remains important to determine the absolute absorption cross section at least at one anchor point, i.e., at a single wavelength. Such a measurement of an absolute cross section can be achieved by referencing the absorption to a different signal that is derived from the same molecular beam. In the past, various such in-situ normalization methods have been successfully developed. For instance, absolute spectra of metal clusters were determined by the method of photo-depletion, where a photon absorption suffices to remove the cluster from the observed spectrum Wang1990a ; Knickelbein1992a . Similarly, the rate of photo-fragmentation of poly-aromatic hydrocarbons Pino1999a or the survival time of fullerene dianions in a penning trap Concina2008a was successfully used for determining absolute photo absorption cross sections.
However, the mentioned techniques share one potential drawback: they rely on photo-induced changes of the particle composition. This may be undesirable in some situations, and it can involve ambiguities. In particular, for mass mixtures of clusters or large polymers it may occur that the mass spectrum is photo-depleted towards smaller masses but simultaneously refilled from high mass compounds Brockhaus1999a . Although recently established transition matrix methods allow to handle rather complex decay chains VanOanh2006a , it still appears desirable to develop a method that permits to determine absolute absorption cross sections without modifying the molecule and without knowing the particle density.
The measurement scheme proposed below is based on the insight that the least invasive spectroscopic method consists in determining the momentum recoil imparted by a single photon on the flying molecule. While single-photon recoil effects have already been proposed for non-linear spectroscopy of atoms Guo1992a , the photon momentum is usually significantly smaller than the molecular momentum spread in those classical beam experiments, so that the resulting beam broadening is hard to resolve. Modern quantum interferometers show a way around this limitation, and, indeed, atom-interferometric recoil measurements have already led to precision experiments. For instance, the photon-induced recoil of neutral alkali atoms allows one to determine the value of , which enters in an improved measurement of the fine structure constant Weiss1993a ; Gupta2002a ; Clade2006a . Optical momentum transfer was also central in investigations of photon-induced decoherence processes in matter wave interferometry Pfau1994a ; Chapman1995a , and the single-photon recoil was an essential part in Ramsey-Bordé interferometry with I2 Borde1994a .
In the present contribution, we aim at an interferometric determination of the absolute photon absorption probability through a comparison of undeflected and deflected molecular interference patterns. We will see that near-field matter wave interferometry is particularly well suited for this purpose, since it imposes a spatial nanostructure on the traversing molecular beam Berninger2007a ; Hackermuller2007a and since the interferometer fringe visibility allows us to precisely determine any changes caused by single photon recoil. After outlining the general idea, we will present a quantum theoretical description of the effect. It is sufficiently detailed to permit assessing the expected measurement accuracy in case of the photon absorption alone. In a second step, we will also account for the possible effect of fluorescence, resulting in a precise measurement scheme for both the absolute absorption cross section and for the quantum yield of fluorescence of neutral complex molecules and nanoparticles.
II Basic setup
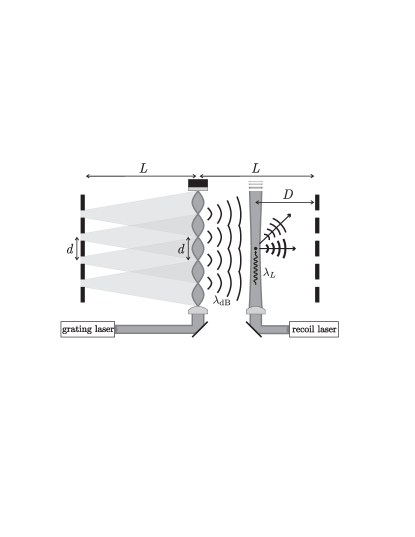
The measurement scheme is based on the Talbot Lau interferometer (TLI), which consists of three gratings, as sketched in Fig. 1. The first and the third one are material masks, while the second diffraction element can be either an absorptive material Brezger2002a or a pure phase grating created by a standing laser wave. The latter variant, designated as the Kapitza-Dirac-Talbot-Lau configuration (KDTLI) Gerlich2007a , has the advantage that the power of the optical diffraction grating can be easily tuned, adding an additional handle for the experiments Gerlich2008a .
In the basic setup the gratings have identical grating periods and are placed at equal distances . A spatially incoherent, but velocity-selected molecular beam with de Broglie wave length illuminates the first grating, creating the spatial coherence for diffraction at the second grating. A near field interference effect, which depends on the ratio of to the Talbot length Talbot1836a , yields a periodic density pattern further downstream. The interference contrast depends on the wave length of the molecules, determined by their longitudinal velocity , and also on the specific interactions with the diffraction structure.
The third grating serves as a transversally movable mask for a detector that measures the total molecule flux behind the gratings. The resulting fringe pattern as a function of the third grating displacement characterizes the interference pattern. Its functional form is well approximated, in both interferometer designs and under many experimental circumstances, by a simple sine curve with an offset.
We here propose to extend this arrangement by an additional recoil laser beam, running parallel to the gratings and crossing the molecular beam perpendicularly at a variable position between the second and the third grating, as sketched in Fig. 1. Depending on the recoil laser power , its wavelength , and the molecular absorption cross section , each molecule may absorb one or more photons or may remain unaffected. The resulting recoils shift the associated interference patterns by an amount which depends on the distance and on the molecular velocity . The observed fringe pattern is an average of all individual molecular interference patterns, whose weights are determined by the absorption cross section. We will show in the following that the observed fringe visibility, and in particular its variation with the spectroscopy laser power, then allow one to derive a precise value for the absolute optical absorption cross section.
III Theoretical analysis
The motional state of the molecules is most conveniently represented in phase space, where it is characterized by the Wigner function of the transverse position and momentum with respect to a longitudinally co-moving frame at fixed beam velocity Hornberger2004a ; Nimmrichter2008a . In this framework, the absorption of each individual laser photon leads to a momentum kick . The resulting fringe pattern at the third grating is then shifted by
| (1) |
where is the de Broglie wavelength of the molecules. We require that the shift be less than one grating period in order to maintain an unambiguous assignment between the fringe shift and the absorption cross section. This limits the range of possible spectroscopy wavelengths to , since (which is a minor constraint since a single wavelength is often sufficient for calibrating an entire spectrum).
The spatial density distribution at the third grating is given by an incoherent sum of the shifted distributions,
| (2) |
where denotes the periodic density pattern without the recoil laser. The probability that a molecule absorbs photons while crossing the laser can be modeled by a Poissonian distribution, . The average number of absorbed photons is obtained by integrating the recoil laser intensity over the longitudinal Gaussian laser profile,
| (3) |
where is the laser waist perpendicular to the molecular beam and the absorption cross section of the molecules. Here the transverse motion of the molecules through the beam can be safely neglected since the molecular beam is typically collimated to about 1 mrad Hornberger2008b .
The assumption of a Poissonian distribution is valid if consecutive absorption processes are independent, i.e. if the cross section does not change after the first excitation. In general, this cannot be taken for granted. In fact, various cases of optical limiting are known, with fullerenes as a prominent example Wray1994a . In practice, the spectroscopy laser power shall therefore always be limited to , leading to relaxed power requirements in the experiment.
The modified molecular density distribution (2) is determined in Fourier space by the coefficients
| (4) |
with the Fourier series coefficients of the unperturbed interference pattern . Since the real part of the exponent in (4) is negative for the contrast of the density pattern decreases if a recoil laser is applied, i.e. the Talbot-Lau interference blurs. This effect gets less important when the recoil laser approaches the third grating. Note that the unperturbed coefficients , the recoil shift , and the mean absorption depend on the molecular velocity, taken to be at a fixed value for the time being. A finite velocity spread in the beam can be accounted for in the end by taking the average over the molecular velocity distribution.
The detected signal as a function of the third grating displacement is subject to the same transformation (4), since its Fourier coefficients differ from the by a multiplication with the coefficients of the transmission function of the third grating Hornberger2004a ; Nimmrichter2008a . Our treatment assumes that the detection process is independent of the internal molecular state, which is well justified since the detection process behind the interferometer typically occurs several hundred microseconds after the excitation inside the interferometer. The incident photon energy will have been either re-radiated in a fluorescence process, or will have been dissipated into many vibrational modes to which most detection mechanisms are insensitive.
It is interesting to note that one could even measure separately a possible absorption-induced change in the detection efficiency, by choosing the distance such as to set the photon-induced shift to equal a full fringe period . Since this alone does not change the experimental signal, additional effects related either to fluorescence effects or to photon-induced modifications of the detection efficiency thus get experimentally accessible.
The effect of the laser recoil is maximized, on the other hand, when the density pattern is shifted by half its period per photon, i.e. by with integer for a fixed molecular velocity . Equation (2) then simplifies to
| (5) | |||||
where the ratio of the shifted and the unshifted pattern, given by , rapidly approaches unity for .
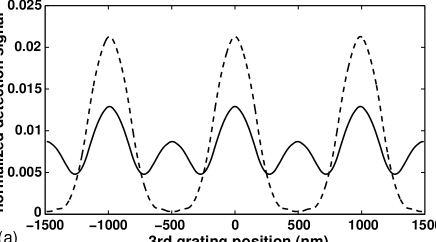
This special case is illustrated in Fig. 2, for a standard TLI setup with three equidistant material gratings of period nm and an open slit fraction . Here and in the following examples we use the biodye tetraphenylporphyrin H2TPP at an average velocity m/s. It has a mass of amu, a static polarizability of Å3 Deachapunya2007b , and it exhibits a large optical absorption cross section Å2 at the resonance frequency nm Du1998a . This corresponds on average to absorbed photons per Watt power of the spectroscopy laser at that wavelength, when it is focused on a waist of m, which is typical for current interferometry experiments Gerlich2007a .
Figure 2 shows the expected signal as a function of the third grating position when the grating distance matches exactly the Talbot length cm. Due to the small grating slits and the fixed velocity m/s in Fig. 2a, one observes a fringe pattern with distinct narrow peaks (dashed line). Photo absorption from a laser of W positioned at cm, generates growing side peaks shifted by half a fringe distance and reduces the magnitude of the original peak accordingly (solid line), as described by Eq. (5).
The appearance of a distinct side-peak can be used as a clear indication of the recoil effect. Absolute cross sections can then be determined by comparing the side peak height to that of the original peak using Eq. (5). This concept should work very well for molecular beam sources that can be made sufficiently intense to permit a velocity selection well below one percent. This holds in particular for experiments that exploit laser desorption into a freely expanding seed gas jet Marksteiner2007a .
A precise quantitative evaluation may, however, often be compromised in practice by a finite velocity spread of the molecule beam, as demonstrated in Fig. 2b. It assumes a Gaussian velocity distribution centered at m/s with a relative width of . The interference pattern gets blurred because of the strong velocity dependence of the interference contrast of a TLI with small-slit material gratings Gerlich2007a ; Nimmrichter2008a . The signal peaks (dashed line) therefore overlap and render the extraction of the absorption cross section inaccurate. A growing molecular mass and polarizability, as well as the possibility of fluorescence, will worsen the situation. Therefore, when precision and scalability to larger molecules matter, a tunable KDTLI laser grating setup is to be preferred to the TLI, even though the qualitative distinction of two separate sets of interference peaks gets lost.
Specifically, in case of the near-sinusoidal fringe patterns expected in a KDTLI setup Gerlich2007a the recoil laser simply reduces the detected sinusoidal fringe visibility by the factor
| (6) |
according to Eq. (4). The reduction is mainly determined by the mean absorbed photon number and it can be at most in case of a half-period shift. It follows with Eq. (3) that a linear relation holds between the logarithm of and the cross section ,
| (7) |
One therefore easily extracts from a linear regression to the measured contrast reduction for different recoil laser powers . This procedure is rather robust against dephasing and contrast-reducing effects inside the interferometer, such as grating vibrations, gravitational and Coriolis forces Stibor2005a , collisions with residual gas molecules Hornberger2003a or the absorption of photons at the second laser grating Gerlich2007a ; Hornberger2008b , since the only relevant effect is the reduction of the fringe contrast relative to the value in absence of the recoil laser.
However, this method still displays some sensitivity to the velocity spread of a realistic molecule beam. Not only the interference pattern itself depends on the longitudinal velocity , but also the mean absorbed photon number (3), as well as the fringe shift (1) imparted by the recoil laser. Each Fourier component (4) of the interference pattern must therefore be averaged over a realistic velocity distribution . This affects the terms , and . The reduction factor (6) is then replaced by
| (8) |
If this was used as a fitting expression to extract the cross section from the contrast reduction it would again require knowledge of the exact velocity distribution. However, this complication can be avoided even for moderate velocity spreads, as we will discuss in the following.
IV Expected accuracy
In our setup the molecular velocity spread is a main cause for uncertainties when extracting the absorption cross section from Eq. (7). In order to estimate the influence of the velocity spread we assume a symmetric velocity distribution peaked at the value with a characteristic width of . The recoil laser is set such that the mean recoil shift amounts to one half of the grating period at , . It is not advisable to use larger shifts , with integer , because of their correspondingly larger variation due to the velocity spread.
For a sufficiently small relative width one may expand the full expression (8) for the contrast reduction up to quadratic order in and carry out the integrations to obtain
| (9) |
with the visibility in absence of the recoil laser and the mean absorbed photon number at . The influence of the velocity dependence of the interference contrast is naturally suppressed by choosing setup parameters that maximize its value with . This only holds as long as the contrast varies slowly within , which should be experimentally achievable for relative velocity spreads below Gerlich2007a ; Nimmrichter2008a . The remaining uncertainty in (9) results from the velocity dependence of the photon number and the recoil shift . Since the relative error related to the velocity distribution is no more than , which directly contributes to the systematic error of the derived absorption cross section, according to Eq. (7).
With a fair velocity selection of about , which should be feasible in future experiments Marksteiner2007a , the error can thus be reduced to . Other experimental uncertainties, such as the power and waist of the recoil laser or its distance to the third grating, can also be reduced to the percent level.
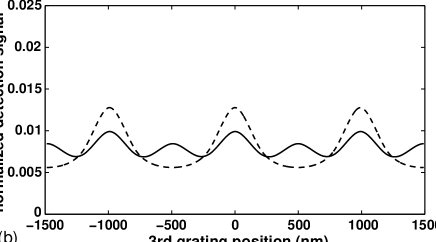
The precision of our recoil spectroscopy method therefore hinges on a good velocity selection. This is demonstrated in in Fig. 3 where we show the results of a Monte Carlo simulation of a KDTLI experiment for H2TPP molecules. We use the setup parameters from an existing experiment Gerlich2007a (cm, nm) with a grating laser power of W. In this situation the velocity dependence of the interference contrast, i.e. , can indeed be neglected in Eq. (9). The absorption of Laser grating photons is included in the simulation, with a realistic cross section of Å2 Du1998a . The nm recoil laser is placed at cm, which conforms to a recoil shift for molecules with m/s. Taking the velocity distribution of the molecules to be a Gaussian centered at , the simulation of the experiment is now done for different relative widths of the distribution in Fig. 3. Each data point represents the result of fitting Eq. (6) to a set of simulated visibilities, in which the recoil laser power is ramped up to W in steps. In each step the raw statistical data is given by the number of detected molecules as a function of the third grating position in a total of samples over grating periods, where each sample consists of molecules entering the KDTLI, a value in accordance with the count rates obtained in recent experiments Gerlich2007a . A sine function is then fitted to the raw data for a given recoil laser power to obtain the visibility including a statistical error estimate.
The simulation corroborates the analytical estimate that the absorption cross section (dashed line) could still be determined with a precision of about provided that the molecular velocity spread can be reduced to below . Above this value the velocity dependence of the signal contrast gets significant and the applied fit function (6) fails to reproduce the correct value of the cross section. The error bars in Fig. 3 indicate the statistical uncertainty of the fringe contrast, which is mainly due to the detection shot noise and can be reduced by increasing the brilliance of the molecular beam.
The predicted accuracy of 1% is valid if other experimental parameters can be determined with that precision. This includes in particular the waist, the power and the position of the spectroscopy laser beam. Using commercially available meters it is realistic to assume these parameters to be known to better than 5%. On the one hand this accuracy would improve direct extinction measurements, where the restricted knowledge of the vapor pressure may yield uncertainties up to a factor of two Coheur1996a ; Yasumatsu1996a ! Precision can only be gained in the rare cases where the vapor pressure of the probed molecule is large and accurately measured Sakurai1975a . Our method however is applicable to molecular beams of low density and does not depend on the knowledge of vapor pressures.
On the other hand, our method compares favorably with the results of earlier depletion experiments Wang1990a ; Knickelbein1992a ; Schmidt1999a and electron detachment experiments Concina2008a , exhibiting errors of the order of 10%. This is due to the fact that it requires the absorption of on average less than a single soft photon only. The photon does not need to cause any fragmentation, ionization or other depletion. The probability of multi-photon absorption can be kept small, for , and our spectroscopic method therefore probes most particles in the same state, without any additional heating of the molecule or cluster.
V The effect of fluorescence
One possible side effect still remains to be considered in our discussion. Upon absorbing a photon, the molecules may either redistribute the energy in an internal conversion process or reemit the energy as a fluorescence photon, typically on the time scale of a few nanoseconds after the excitation. This can alter the reduction of the interference contrast significantly, and it would be a major source of error if it remained unconsidered. In fact, our exemplary molecule H2TPP does fluoresce with a quantum yield of about Du1998a .
A great advantage of our near-field setup is that we can separate the side effects related to the recoil laser by varying the recoil shift within one grating period. This is due to the strict periodicity of the interference pattern, a feature absent in far field interference. As an important application of that, we can thus assess the effect of molecular fluorescence. In a simple model each photon absorption is followed by an immediate fluorescence with a probability given by the quantum yield ; otherwise the excitation energy is deposited in the internal state of the molecule. This assumes that the photon absorption rate during the laser passage is small compared to the inverse of the typical fluorescence time of the molecule, which is the case for typical molecules and laser powers.
Each fluorescence emission can then be treated as a single decoherence event that transforms the molecular Wigner function to , corresponding to a probabilistic momentum kick with distribution . The latter is given by the Fourier transform of the decoherence function Hornberger2004a
| (10) |
where represents the normalized fluorescence spectrum. By means of the probability of emitting out of absorbed photons, the Fourier coefficients of the fringe pattern can be expressed as
| (11) | |||||
In the absence of fluorescence, , expression (11) reduces to Eq. (4). The absorption cross section (or equivalently the mean number of absorbed photons, according to Eq. (3)) and the quantum yield can then be obtained one after the other by subsequently setting the recoil shift to and to , and by measuring the corresponding reduction factors of the sinusoidal interference contrast,
| (12) | |||||
| (13) |
Since the latter depends only on the product it can be used to eliminate the fluorescence term in the first reduction factor. The two reduction factors together thus determine both the absorption cross section and the quantum yield . Note that this procedure requires knowledge of the relative fluorescence spectrum. This can for instance be measured close to the molecular source where the density is still high.
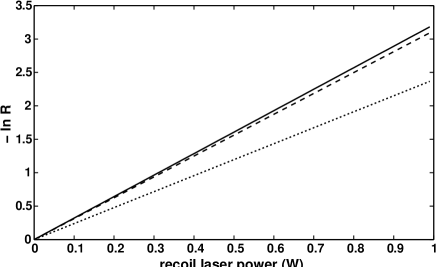
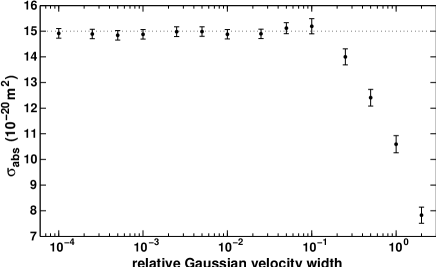
Figure 4 demonstrates the influence of fluorescence on the recoil-induced contrast reduction for the H2TPP example as used in the simulation above. We plot the negative natural logarithm of the reduction factor as a function of the power of the recoil laser for three instances: The solid line depicts the situation (7) without fluorescence, as used in the simulation in Fig. 3, while the dashed and the dotted line represent the reduction factor (12) with a realistic fluorescence quantum yield of Du1998a , and with the maximum value , respectively. The underlying fluorescence spectrum is taken from Du1998a , which evaluates the decoherence function (10) as . One observes in Fig. 4 that the slope of the dashed line is smaller than the slope of the solid line, which means that one would obtain a value for the absorption cross section that is too small if the fluorescence effect was ignored. Larger quantum yields lead to a more significant deviation of up to , as illustrated by the dotted line.
In principle, the visibility could be additionally reduced by the recoil laser since the heating of the internal molecular state can give rise to thermal emission and decoherence Hornberger2004a ; Hornberger2005a . In fact, each absorbed laser photon that is not reemitted by fluorescence increases the internal temperature of the molecule by , with the molecular heat capacity. However, on the time scale of the proposed experiment the enhanced thermal radiation is expected to be negligible for large molecules with capacities , where the temperature increase per photon remains typically below 100 K for particles beyond 200 atomsHornberger2005a . Such heating effects, but also a power dependence of the absorption cross section, would manifest themselves in a nonlinear behavior of the logarithmic contrast reduction when the average number of absorbed photons is .
Our method only measures the thermal average of the absorption cross section at a temperature given by the source. While in effusive sources this temperature could be as high as several hundred Kelvin both supersonic source and buffer gas cooled cluster sources would prepare the particles in low internal states, often the vibrational ground state.
Nevertheless, the source temperature is of particular importance for small clusters and molecules where internal heating can change the spectral properties quite dramatically Ellert1995a ; Chen1999a ; Moseler2001a ; Makarov2008a . While this appears to be a potential complication at first sight the optical absorption cross section can actually be a valuable probe for the cluster temperature as well Schmidt1999a . And future experiments might explore this again systematically by starting from internally cold particles which are subsequently heated using laser light.
VI Conclusions
Our analysis suggests that single photon recoil interactions within a near-field matter wave interferometer are a promising tool for absorption spectroscopy in molecular and cluster physics. The method is robust and general since it does not depend on the particularities of the interferometer, such as the details of the molecular interaction with the diffracting element: The interferometric setup is only required to generate a fringe pattern with a good modulation of the molecular density at a sufficiently high signal-to-noise ratio.
The technique appears to be well-suited for a large variety of neutral nanoparticles, including fluorescent molecules. It is particularly applicable to particles with a strong internal state conversion, a property found in many organic molecules and metal clusters.
Quantum interference experiments planned for the near-future should be capable to host a vast range of species in the mass range up to 10.000 amu, while the principle can be easily scaled to larger particles as soon as sufficiently slow and cold beams of massive particles become available. A particular advantage of the present method is that one can extract absorption cross sections from beams that are optically extremely thin. Our simulation indicates that molecular beams with densities down to should already suffice. For the molecule H2TTP used in the example above this corresponds to an extinction length of about 65,000 km.
Acknowledgments
We thank the Austrian science foundation FWF for support within the projects SFB1505 and the doctoral program W1210 (CoQuS), and the ESF EuroQUASAR program MIME. K. H. is supported by the DFG within the Emmy Noether program.
References
- (1) G. Scoles, in Atomic and molecular beam methods, edited by G. Scoles, D. Bassi, U. Buck, and D. Lainé (Oxford University Press, New York, 1988).
- (2) U. Kreibig and M. Vollmer, Optical Properties of Metal Clusters (Springer, Berlin, 1995).
- (3) J. Berkowitz, Atomic and Molecular Photoabsorption: Absolute Total Cross Sections (Academic Press, New York, 2002).
- (4) T. Sakurai and H. G. de Winter, J. Appl. Phys. 46, 875 (1975).
- (5) F. Z. Chen, D. L. Judge, C. Y. R. Wu, and J. Caldwell, Planetary and Space Science 36, 261 (1999).
- (6) M. G. H. Boogaarts and G. Meijer, J. Chem. Phys. 103, 5269 (1995).
- (7) P. F. Coheur, M. Carleer, and R. Colin, J. Phys. B: At. Mol. Opt. Phys. 29, 4987 (1996).
- (8) H. Yasumatsu, T. Kondow, H. Kitagawa, K. Tabayashi, and K. Shobatake, J. Chem. Phys. 104, 899 (1996).
- (9) C. Wang, S. Pollack, D. Cameron, and M. Kappes, J. Chem. Phys. 93, 3787 (1990).
- (10) M. B. Knickelbein and W. J. C. Menezes, Phys. Rev. Lett. 69, 1046 (1992).
- (11) T. Pino, N. Boudin, and P. Bréchignac, J. Chem. Phys. 111, 7337 (1999).
- (12) B. Concina, M. Neumaier, O. Hampe, and M. M. Kappes, J. Chem. Phys. 128, 134306 (2008).
- (13) P. Brockhaus, I. V. Hertel, and C. P. Schulz, J. Chem. Phys. 110, 393 (1999).
- (14) N.-T. Van-Oanh, P. Desesquelles, and P. Brechignac, J. Phys. Chem. A 110, 5599 (2006).
- (15) J. Guo, P. Berman, B. Dubetsky, and G. Grynberg, Phys. Rev. A 46, 1426 (1992).
- (16) D. Weiss, B. Young, and S. Chu, Phys. Rev. Lett. 70, 2706 (1993).
- (17) S. Gupta, K. Dieckmann, Z. Hadzibabic, and D. E. Pritchard, Phys. Rev. Lett. 89, 140401 (2002).
- (18) P. Clad , E. de Mirandes, M. Cadoret, S. Guellati-Kh lifa, C. Schwob, F. Nez, L. Julien, and F. Biraben, Phys. Rev. Lett. 96, 033001 (2006).
- (19) T. Pfau, S. Spälter, C. Kurtsiefer, C. Ekstrom, and J. Mlynek, Phys. Rev. Lett. 73, 1223 (1994).
- (20) M. S. Chapman, T. D. Hammond, A. Lenef, J. Schmiedmayer, R. A. Rubenstein, E. Smith, and D. E. Pritchard, Phys. Rev. Lett. 75, 3783 (1995).
- (21) C. Bordé, N. Courtier, F. D. Burck, A. Goncharov, and M. Gorlicki, Phys. Lett. A 188, 187 (1994).
- (22) M. Berninger, A. Stéfanov, S. Deachapunya, and M. Arndt, Phys. Rev. A 76, 013607 (2007).
- (23) L. Hackermüller, K. Hornberger, S. Gerlich, M. Gring, H. Ulbricht, and M. Arndt, Appl. Phys. B 89, 469 (2007).
- (24) B. Brezger, L. Hackermüller, S. Uttenthaler, J. Petschinka, M. Arndt, and A. Zeilinger, Phys. Rev. Lett. 88, 100404 (2002).
- (25) S. Gerlich, L. Hackermüller, K. Hornberger, A. Stibor, H. Ulbricht, M. Gring, F. Goldfarb, T. Savas, M. Müri, M. Mayor, and M. Arndt, Nature Physics 3, 711 (2007).
- (26) S. Gerlich, M. Gring, H. Ulbricht, K. Hornberger, J. Tüxen, M. Mayor, and M. Arndt, Angew. Chem. Int. Ed. 47, 6195 (2008).
- (27) H. F. Talbot, Philos. Mag. 9, 401 (1836).
- (28) K. Hornberger, J. E. Sipe, and M. Arndt, Phys. Rev. A 70, 53608 (2004).
- (29) S. Nimmrichter and K. Hornberger, Phys. Rev. A 78, 023612 (2008), eprint arXiv:0804.3006.
- (30) K. Hornberger, S. Gerlich, L. Hackermüller, M. Gring, H. Ulbricht, and M. Arndt, (in preparation) (2008).
- (31) J. E. Wray, K. C. Liu, C. H. Chen, W. R. Garrett, M. G. Payne, R. Goedert, and D. Templeton, Appl. Phys. Lett. 64, 2785 (1994).
- (32) S. Deachapunya, A. Stefanov, M. Berninger, H. Ulbricht, E. Reiger, N. L. Doltsinis, and M. Arndt, J. Chem. Phys. 126, 164304 (2007).
- (33) H. Du, R. Fuh, J. Li, L. Corkan, and J. Lindsey, PhotochemCAD: A Computer-Aided Design and Research Tool in Photochemistry, 1998.
- (34) M. Marksteiner, G. Kiesewetter, L. Hackermüller, H. Ulbricht, and M. Arndt, Acta Phys. Hung. B 26/1 2, 87 94 (2007).
- (35) A. Stibor, K. Hornberger, L. Hackermüller, A. Zeilinger, and M. Arndt, Laser Physics 15, 10 (2005).
- (36) K. Hornberger, S. Uttenthaler, B. Brezger, L. Hackermüller, M. Arndt, and A. Zeilinger, Phys. Rev. Lett. 90, 160401 (2003).
- (37) M. Schmidt, C. Ellert, W. Kronmüller, and H. Haberland, Phys. Rev. B 59, 10970(10) (1999).
- (38) K. Hornberger, L. Hackermüller, and M. Arndt, Phys. Rev. A 71, 023601 (2005).
- (39) C. Ellert, M. Schmidt, C. Schmitt, T. Reiners, and H. Haberland, Phys. Rev. Lett. 75, 1731 (1995).
- (40) M. Moseler, H. Häkkinen, and U. Landman, Phys. Rev. Lett. 87, 53401 (2001).
- (41) G. N. Makarov, Physics Uspekhi 51, 319 (2008).