Quenching of Star Formation
Abstract
In the last decade we have seen an enormous increase in the size and quality of spectroscopic galaxy surveys, both at low and high redshift. New statistical techniques to analyse large portions of galaxy spectra are now finding favour over traditional index based methods. Here we will review a new robust and iterative Principal Component Analysis (PCA) algorithm, which solves several common issues with classic PCA. Application to the 4000Å break region of galaxies in the VIMOS VLT Deep Survey (VVDS) and Sloan Digital Sky Survey (SDSS) gives new high signal-to-noise ratio spectral indices easily interpretable in terms of recent star formation history. In particular, we identify a sample of post-starburst galaxies at and . We quantify for the first time the importance of post-starburst galaxies, consistent with being descendents of gas-rich major mergers, for building the red sequence. Finally, we present a comparison with new low and high redshift “mock spectroscopic surveys” derived from a Millennium Run semi-analytic model.
Keywords:
Galaxies, Spectroscopic surveys, star formation history, post-starburst galaxies, robust statistics, semi-analytic modelling:
98.52.Cf, 98.62.Ai,02.50.Sk1 Motivation
The rest-frame optical spectrum of a galaxy contains a wealth of information about its past and present star formation rate, chemical evolution, dust content and the presence of an active galactic nucleus. The advent of the Sloan Digital Sky Survey (SDSS) led us into a new era in low redshift spectroscopic galaxy surveys, with the number of unique, well calibrated, high quality, galaxy spectra covering the full optical wavelength extent approaching . At high redshift, progress in the last decade has been similarly significant. Both the Vimos VLT Deep Survey (VVDS) and DEEP2 surveys, which have released a large number of galaxy spectra to the public, allow the same measurement of galaxy physical parameters at as routinely carried out at .
At low redshift, the days of discreet classification of objects into red/blue, elliptical/spiral etc. are over. The bimodality of the galaxy population is well quantified in physical parameters such as stellar mass and star formation rates. We are now in an era of “galaxy population” studies, in which each formerly distinct class is thought of as part of a wider community. Rare classes of objects, such as “starburst”, “green valley” and “post-starburst” galaxies can be placed into a global picture of star formation patterns. So-called “transition” galaxies are attracting great interest, due to their importance for understanding the physical mechanisms responsible for the global shut down in star formation, and the build–up of the red sequence (van den Bosch et al., 2008; Silverman et al., 2008).
In this proceedings we will review recent work on applying principal component analysis (PCA) to the 4000Å break region of galaxy spectra. This region provides constraints on the recent star formation history of galaxies, important for identifying transition galaxies. The 4000Å break region is accessible to optical spectroscopic surveys between , making observations directly comparable over half of the age of the Universe Chen et al. (2008), a time during which the star formation habits of the galaxy population change considerably.
2 Star formation histories from galaxy spectra
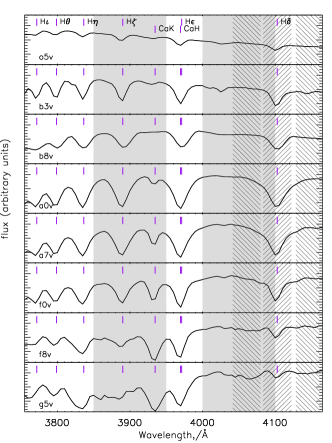
In the optical regime, the 4000Å break region of the spectra contains the greatest amount of information on the recent star formation history of galaxies. Figure 1 illustrates this point. With decreasing stellar temperature the 4000Å break strength increases, and the Balmer absorption lines first strengthen and then weaken. A strong UV continuum is evident in the hottest stars. Each stellar type has a characteristic main sequence lifetime, 0.5 Gyr and 3 Gyr for A and F stars respectively. It is these different lifetimes that allow us to measure the star formation histories of stellar populations.
PCA is an unsupervised multivariate statistical method traditionally used to identify correlations in datasets. It has been applied to astronomical spectral datasets for a variety of purposes (e.g. Connolly et al., 1995; Glazebrook et al., 1998; Madgwick et al., 2002; Yip et al., 2004; Wild and Hewett, 2005). PCA identifies correlated features, such as the Balmer absorption lines, extracting them easily as a single parameter. When applied to the 4000Å break region of galaxy spectra, PCA recovers the strength of the 4000Å break as the main axis of variation, which constrains the mean age of the stellar population, or equivalently the specific star formation rate Brinchmann et al. (2004). The second axis of variation is the Balmer absorption line strength, which constrains the fraction of intermediate age stars Kauffmann et al. (2003). PCA also identifies Ca ii(H&K) as a clearly interpretable third axis.
In Wild et al. (2007) we developed new PCA-based spectroscopic indices working in the 4000Å break region, for the purpose of recovering the recent star formation history of galaxies.We showed that, by taking advantage of the entire Balmer series and continuum shape, a dramatic improvement could be achieved over the traditionally used H equivalent width. For this first application we chose to create the PCA basis set using model galaxies from the Bruzual and Charlot (2003) spectral synthesis models. On the one hand, an oft-quoted benefit of PCA is that it can be applied directly to the data, allowing the data to “speak for themselves”. On the other hand, direct application of classic PCA to modern galaxy data is fraught with challenges caused by misclassified spectra, contamination from night sky lines, regions of missing data and enormous computational memory requirements. In the following section we will discuss a new robust and recursive PCA algorithm developed in Budavari et al. (2008), designed specifically with large spectroscopic surveys in mind.
3 Robust and Iterative PCA

In classical PCA, a set of eigenvectors are calculated through a matrix decomposition of a single dataset. For very large samples, such as the SDSS galaxy catalog, information is very much redundant in the statistical sense, i.e. often the analysis of a smaller subset yields as good results. Additionally, in most cases we seek only a small number of eigenvectors associated with the largest eigenvalues, in classic PCA the remaining vectors are computed in vain.
The first step of our new method is to formulate the problem within the framework of a data stream, rather than the traditional data set. The eigensystem is recursively updated as new data are input, with only the top eigenvectors calculated as required. Convergence is controlled by a single parameter that sets the effective sample size and can easily be tuned to match the dataset being analysed.
The second step is to make the algorithm robust to outliers. Classical PCA simply minimises the square of the residual between the eigensystem and input dataset, a statistical procedure inherently susceptible to outliers. With small datasets it is possible to remove the few “obvious” outliers by hand or within a few quick iterations of classic PCA, a step which is both subjective and impractical for modern large datasets. In the last few years, a number of improvements have been proposed to overcome the issue of robustness in PCA, within the framework of robust statistics Maronna et al. (2006). Rather than minimising the square of the residuals, a robust function is introduced to control the level of contamination tolerated from outliers.
Figure 2 presents a comparison between eigenspectra created from classic PCA (left), those created using a traditional workaround in which data are iteratively trimmed (center), and the new iterative and robust method (right). The dataset is a sample of 3485 optical spectra from the VIMOS VLT Deep Survey (VVDS)Le Fèvre et al. (2005) which will be introduced in the following section. A successful eigenbasis can be described as one that does not introduce noise into the decomposition of individual galaxy spectra, and in which the top few eigenspectra describe the variance in the majority of the dataset. The classic PCA fails both of these criteria: the eigenspectra are noisy, and the first two component amplitudes show significant correlation for good quality spectra.
In this test case, the new eigenspectra are similar to those from the trimmed PCA but small improvements are apparent. It is worth noting that the PCA algorithm is completely independent of the order of the bins: it has no spatial coherence. Therefore, the fact that the new eigenspectra are smoother is already an indication that they are more robust. The following section presents the first application of indices derived using this method to a scientific problem.
4 Post-starburst galaxies at
The VIMOS VLT Deep survey (VVDS) is a deep spectroscopic redshift survey, targetting objects with apparent magnitudes in the range of Le Fèvre et al. (2005). The survey is unique for high redshift galaxy surveys in having applied no colour cuts, yielding a particularly simple selection function, making it a very attractive dataset for statistical studies of the high redshift galaxy population. In this work we make use of the spectra from the publicly available first epoch data release of the VVDS-0226-04 (VVDS-02h) field. The spectra have a relatively low resolution of and observed frame wavelength range of 5500-9500Å. The first epoch public data release contains 8981 spectroscopically observed objects in the VVDS-02h field, from which we select 1246 with secure redshifts in the range and a per-pixel signal-to-noise ratio (SNR) greater than 6.5.
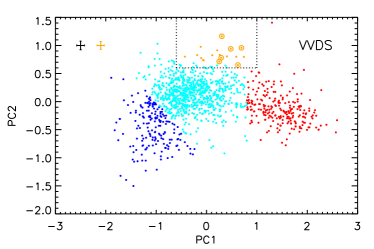
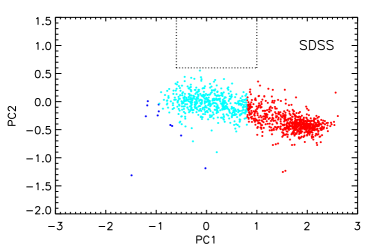
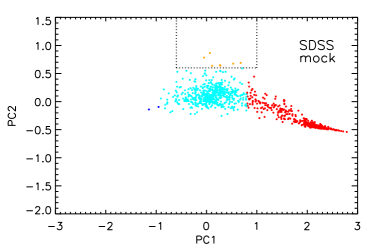
The new robust and iterative PCA method was applied to these spectra to create the eigenspectra directly from the VVDS spectra. In the top left panel of Figure 3 we show the distribution of the first two principal component amplitudes, PC1 and PC2, for this sample of VVDS galaxies. The primary division of our sample is into “quiescent” and “star-forming” galaxies on the right and left. To the bottom left, “starburst” galaxies are found with very blue continua and very strong emission lines. To the top centre we find the “post-starburst” galaxies, with stronger Balmer absorption than expected for their 4000Å break strength. In the top right panel we show a comparison sample derived from the SDSS DR6 catalog, 1246 galaxies with have been selected randomly for illustration purposes111We note that these samples are not mass limited, and therefore the completeness increases for a given stellar mass from right to left across the diagrams. However, the completeness limits of the two samples are similar, and the left and right panels may be directly compared.. There are some clear differences between the high and low redshift samples. Firstly, the entire galaxy population noticeably ages (increases in PC1) as redshift decreases, the red sequence builds and the strong starburst galaxies are no longer visible in the SDSS survey. Secondly, the scatter in both the blue and red sequence drops substantially with decreasing redshift, even when the higher SNR of the SDSS spectra is accounted for. The SDSS shows a clear blue sequence, whereas the VVDS shows a “blue cloud”.
In Wild et al. (2008) we compare with SPH simulations of galaxy mergers Johansson et al. (2008) to show that the strong post-starburst (PSB) galaxies found in the VVDS and SDSS surveys are consistent with being the descendents of gas rich major mergers. The inclusion of black hole feedback does not greatly alter the evolution of the simulated merger remnants through the post-starburst phase. Starburst mass fractions must be larger than % and decay times shorter than years for post-starburst spectral signatures to be observed in the simulations.
In the VVDS survey, we find 16 PSB galaxies above our mass completeness limit of . These correspond to a number density of Mpc-3. Summing the mass of the 5 PSB galaxies which have completely ceased the formation of stars, and are therefore most likely to enter the red sequence, we measure a mass flux from blue to red sequence through the post-starburst phase of M⊙/Mpc3/yr. Comparison with Arnouts et al. (2007) shows that this accounts for % of the growth rate of the red sequence at .
We find a very strong redshift evolution of these strong post-starburst galaxies: the number density is 200 times lower at than at . In the redshift range , only 3 equivalently strong post-starburst galaxies are found in the SDSS-DR6 catalogue above our mass completeness limit of . The strength of this evolution suggests that a combination of effects are responsible: declining merger rates de Ravel et al. (2008), declining gas fractions and increasing disc dynamical timescales, leading to increasing burst durations and weakening burst strengths.
4.1 Comparison with cosmological simulations
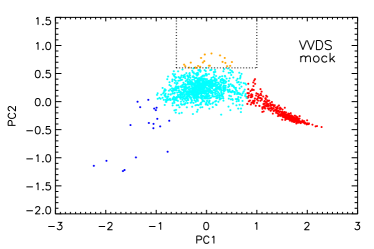
In the lower panels of Figure 3 we present recent results from work-in-progress to extract mock spectroscopic catalogues from the Millennium Run Springel et al. (2005) semi-analytic model (SAM) of De Lucia and Blaizot (2007). Mock magnitude-limited catalogues are created using the MoMaf software Blaizot et al. (2005), and the star formation and metallicity history of the SAM galaxies are combined with the Bruzual and Charlot (2003) spectral synthesis models to create integrated spectral energy distributions for each SAM galaxy. Prescriptions for nebular emission lines and two component dust attenuation are included (Charlot and Fall, 2000). The resulting spectra can then be analysed in an entirely equivalent manner to the real data. In the case of Figure 3, the SAM galaxy spectra have been projected onto the robust eigenspectra created from the VVDS galaxy spectra as described above.
Comparing the upper (real) and lower (mock) panels of Figure 3 we can be encouraged by the agreement between the SAM and real Universes. In particular, the overall ageing of the stellar populations is well reproduced, together with the decreasing scatter in the blue sequence as the Universe ages. Some shortcomings of the models are evident, and are currently being fully investigated. The figures make a strong case that the application of multivariate statistics to data compression and visualisation of large and complex datasets will lead to new insights into the physical processes responsible for driving the changes in star formation in galaxies over time.
5 Conclusions
In this proceedings we have gathered together recent and ongoing work by the authors, to quantify the recent star formation history of galaxies through use of the 4000Å break region of galaxy spectra. Through a new robust PCA algorithm, we have derived high SNR spectroscopic indices from the high redshift VVDS galaxy survey. These indices combine the Balmer absorption line series and shape of the spectra to reveal the relative fractions of stellar types. We have shown how these indices can be applied to current scientific questions, by the identification of post-starburst galaxies. Finally, we have presented new work on extracting full spectral energy distributions for Millennium Run SAM galaxies, including prescriptions for dust attenuation and nebular emission. We have shown how the data compression and visualisation properties of PCA help us to compare directly these modern large cosmological simulations with the modern, and equally large, spectroscopic galaxy surveys.
References
- van den Bosch et al. (2008) F. C. van den Bosch, D. Aquino, X. Yang, et al., MNRAS 387, 79–91 (2008)
- Silverman et al. (2008) J. D. Silverman, V. Mainieri, B. D. Lehmer, et al., ApJ 675, 1025–1040 (2008)
- Chen et al. (2008) Y.-M. Chen, V. Wild, G. A. M. Kauffmann, et al., ArXiv e-prints 0808:3683 (2008).
- Connolly et al. (1995) A. J. Connolly, A. S. Szalay, M. A. Bershady, A. L. Kinney, and D. Calzetti, AJ 110, 1071, (1995)
- Glazebrook et al. (1998) K. Glazebrook, A. R. Offer, and K. Deeley, ApJ 492, 98 (1998).
- Madgwick et al. (2002) D. S. Madgwick, O. Lahav, I. K. Baldry, et al. (The 2dFGRS Team),, MNRAS 333, 133–144 (2002).
- Yip et al. (2004) C. W. Yip, A. J. Connolly, A. S. Szalay, et al., AJ 128, 585–609 (2004)
- Wild and Hewett (2005) V. Wild, and P. C. Hewett, MNRAS 358, 1083–1099 (2005).
- Brinchmann et al. (2004) J. Brinchmann, S. Charlot, S. D. M. White, et al., MNRAS 351, 1151–1179 (2004).
- Kauffmann et al. (2003) G. Kauffmann, T. M. Heckman, S. D. M. White, et al.,, MNRAS 341, 54–69 (2003).
- Wild et al. (2007) V. Wild, G. Kauffmann, T. Heckman, et al., MNRAS 381, 543–572 (2007)
- Bruzual and Charlot (2003) G. Bruzual, and S. Charlot, MNRAS 344, 1000–1028 (2003).
- Budavari et al. (2008) T. Budavari, V. Wild, A. S. Szalay, L. Dobos, and C.-W. Yip, ArXiv e-prints 0809:0881 (2008)
- Maronna et al. (2006) R. Maronna, R. Martin, and V. Yohai, Wiley Series in Probability and Statistics (2006).
- Le Fèvre et al. (2005) O. Le Fèvre, G. Vettolani, B. Garilli, and et al., A&A 439, 845–862 (2005)
- De Lucia and Blaizot (2007) G. De Lucia, and J. Blaizot, MNRAS 375, 2–14 (2007)
- Wild et al. (2008) V. Wild, C. J. Walcher, P. Johansson, et al., MNRAS submitted (2008).
- Johansson et al. (2008) P. H. Johansson, T. Naab, and A. Burkert, ArXiv e-prints 0802.0201 (2008)
- Arnouts et al. (2007) S. Arnouts, C. J. Walcher, O. Le Fèvre, and et al., A&A 476, 137–150 (2007)
- de Ravel et al. (2008) L. de Ravel, O. Le Fèvre, L. Tresse, and et al., ArXiv e-prints 0807:2578 (2008)
- Springel et al. (2005) V. Springel, S. D. M. White, A. Jenkins, and et al., Nature 435, 629–636 (2005)
- Blaizot et al. (2005) J. Blaizot, Y. Wadadekar, B. Guiderdoni, et al., MNRAS 360, 159–175 (2005)
- Charlot and Fall (2000) S. Charlot, and S. M. Fall, ApJ 539, 718–731 (2000).