TeV Gamma-ray Astronomy: The Story So Far
Abstract
A snapshot is presented of the present status of our knowledge of the TeV gamma-ray universe. Emphasis is put on observations made using the imaging atmospheric Cherenkov technique. The capabilities of the present generation of telescopes is listed. Progress has been dramatic and several features have been different from what was anticipated. The catalog of sources includes some 78 objects and these are tabulated as extragalactic sources (24), supernovae remnants (11), pulsar wind nebulae (10), binaries (4), miscellaneous (9), diffuse high energy sources (3) and unidentified sources (20). Some comments are made on the factors influencing the past and future development of the field.
Keywords:
TeV -Ray Observations:
97.60.Bw, 97.60.Gb, 97.60.Lf, 98.70.Sa, 98.54.Cm1 Status of TeV Gamma-ray Astronomy, c. 2008
Having had the honor of presenting status reports at two of the last three Heidelberg meetings on TeV gamma-ray astronomy weekes93 , weekes00 , I am painfully aware (with the benefit of hindsight) of my shortcomings at such a task, in particular at my attempts to predict the future growth of the field where I have generally erred on the conservative side and have been pleasantly surprised by the pace of discovery.
Hence here I will confine myself to reporting on the status of the field as I know it today (July, 2008) which will therefore rely mostly on my knowledge of the published papers and recent excellent reviews hinton07 , deangelis08 , aharonian08 as well as the comprehensive White Paper on TeV ground-based gamma-ray astronomy that was recently put together by members of the US TeV gamma-ray community buckley08 . I will attempt to summarize the status and capability of the various observatories, outline the sensitivity that can be achieved with existing instrumentation, the range of observed phenomena, make some attempt to catalog the credible discrete sources reported to date, and provide some personal perspective on the progress of, and prospects for, the field. I will make no attempt to describe the significant improvements that are planned for existing observatories, some of which are in an advanced state of construction.
Caveat
Nothing dates more rapidly than a written status report. This is particularly true of one presented at the beginning of a symposium where the most exciting results from the various groups have been embargoed so that they can be presented at the symposium.
Thus even before the ink on the report is dry, it is out-of-date. Its value therefore is merely to serve as a historical benchmark and to summarize what one of us thought he knew at the start of the symposium and to provide some kind of reference point for future developments.
What we have today
The Atmospheric Cherenkov Technique
With the notable exception of the remarkable results from the Milagro experiment abdo07 , the bulk of the observational results at TeV energies have come from telescopes using the atmospheric Cherenkov technique. Although the basic technique was developed some fifty years ago, it was not until the development of the so-called imaging atmospheric Cherenkov technique (IACT) that the first indication of a credible detection was apparent cawley85 , weekes89 . Given the rather murky history that has characterized the early results at all gamma-ray energies (100 MeV energies as well as 1 TeV energies), it is not surprising that this early detection was treated with some skepticism.
In its earliest manifestation the technique was characterized by its:
-
•
Simplicity
-
•
Economy
-
•
Elegance
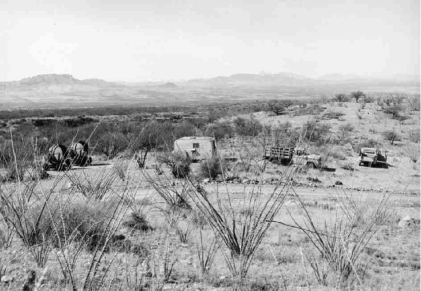
Although the early experiments (an example, the first Whipple Observatory experiment shown in Figure 1) did not succeed in producing convincing evidence for the existence of any sources, they showed that it was possible for small groups to participate in the exciting new field of high energy astrophysics; this field was soon to be dominated by elaborate and expensive experiments in balloons or on satellites. The elegance of the Cherenkov technique was apparent in its economy as to the energy intercepted that was necessary to detect the gamma ray; as Ken Greisen pointed out, the ground-based technique is remarkable in that only one millionth of the energy of the primary gamma ray (in the form of Cherenkov light photons) need be collected by the telescope for the gamma ray to be detected.
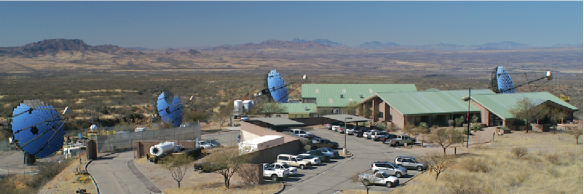
The imaging atmospheric Cherenkov technique as practiced today (Figure 2) with its multitude of pixels, multiple large optical reflectors, and high speed data acquisition systems is certainly not simple. Of necessity, the costs of such systems are now large and prohibitive for small research programs. The typical state-of-the-art observatory costs $20M and authorship lists are in the hundreds. Only the elegance survives and still makes the technique attractive to cosmic ray physicists and refugees from large high energy physics experiments.
With the current emphasis on ”green” technology it is perhaps worth noting that the detection of high energy particles using their secondary emissions in the atmosphere is inherently a ”green” technique since in no way is the natural path of the gamma ray, destined to cross the wilderness of interstellar and perhaps intergalactic space and end its life by collision with an air molecule, disturbed. The gamma ray is not even aware it has been detected! In contrast the highly technical gamma-ray space telescope must intercept, and destroy, the primary gamma ray in its complex silicon layers; it thus ends its life prematurely and catastrophically and never completes its original destiny.
The Tools Available Today
Although all ground-based experiments that have the sensitivity to detect a source like the Crab Nebula can contribute to TeV gamma-ray astronomy, the recent literature (and this symposium) has tended to be dominated by the ”Big Three”, H.E.S.S., MAGIC and VERITAS. However CANGAROO III, the Whipple 10m telescope and the recently completed HAGAR in Ladhak, India also play an important role, particularly in monitoring variable sources. Some of the characteristics of these observatories are listed in Table 1.
It should be noted that only three of the original four telescopes of CANGAROO III are now in operation so the sensitivity is reduced from the original designed threshold (M. Mori, private communication). The threshold shown for H.E.S.S. is that at first light and when most of their pioneering discoveries were made; because of mirror weathering the threshold is now higher. HAGAR has only recently come on-line so its sensitivity has still to be confirmed; this value and those for the other two Indian experiments were supplied by B.S. Acharya (private communication). HAGAR is noteworthy in that it will be the first telescope to operate at an elevation 4km. Of the eight observatories listed, all but HAGAR and PACT use the IACT; their approach is to use wavefront sampling with an array of small telescopes.
| Observatory | Elevation (km) | Telescopes # | Mirror Area () | FoV (degrees) | First Light | Threshold (GeV) | Sensitivity (%Crab) |
|---|---|---|---|---|---|---|---|
| H.E.S.S. | 1.8 | 4 | 428 | 5 | 2003 | 100 | 0.7 |
| VERITAS | 1.3 | 4 | 424 | 3.5 | 2007 | 100 | 1 |
| MAGIC | 2.2 | 1 | 236 | 3.5 | 2005 | 50 | 1.6 |
| HAGAR | 4.3 | 7 | 31 | 3 | 2008 | 60 | 9 |
| Whipple | 2.3 | 1 | 75 | 2.2 | 1985 | 400 | 10 |
| CANGAROO III | 0.1 | 3(4) | 172 (230) | 4 | 2006 | 400 | 10 |
| PACT | 1.1 | 24 | 107 | 3 | 2001 | 750 | 11 |
| TACTIC | 1.3 | 1 | 10 | 2.8 | 2001 | 1500 | 70 |
| SHALON | 3.3 | 1 | 11.2 | 8 | 1996 | 1000? | ? |
The Present Capabilities
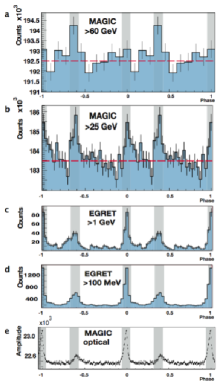
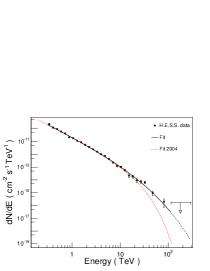
Wide Spectral Energy Range : 25 GeV to 100 TeV
The earliest experiments had energy thresholds in excess of 5 TeV. As the size of the telescopes has increased and the sophistication of the triggering improved, the energy threshold has steadily dropped, so that now results are presented with thresholds as low as 25 GeV (Figure 3). The upper energy bound is determined by exposure time and can be extended by observing at low elevations where the collection area and energy threshold increase. It is certainly possible to make observations with telescopes using the IACT up to energies of 100 TeV (Figure 4, Figure 5). The motivation to go to lower energies comes mainly from the desire to study distant AGN, which are expected to have soft spectra, and Gamma Ray Bursts and pulsars for the same reason. Higher energies are particularly important in the study of Supernovae Remnants since such observations have the best hope of separating out the contributions from hadronic and electronic progenitors. Although most IACT observatories strive to achieve the lowest possible energy thresholds, in practice the technique is still most sensitive at energies around 200 GeV and this is where most of the new sources have been discovered. The detection of the Crab pulsar (this symposium) is an obvious exception.
Energy resolution: 10 to 35%
Once a source has been detected, interest centers on the determination of the energy spectrum. Most sources can be fit with a simple power law. Structure in the spectrum can be an important clue to the emission mechanism and possible absorption processes. Energy resolution can range from as little as 10% with arrays of telescopes, which permit the determination of the impact parameter, to 30-40% with single telescopes. The signal strength should be at least 5 for a meaningful measurement. At low energies spectral mesurements are limited by threshold effects and at high energies by statistics. A steep spectrum must always be treated with caution since this is the characteristic of a false detection which is usually caused by an uneven sky background effect.
Energy resolution is important to those who see TeV astronomy as a window in which to explore dark matter; a source with high density might be expected to have a high concentration of neutralinos and might be identified by a line in the 100-1000 GeV range. This possibility is a driving force for many TeV scientists with a background in high energy physics.
Flux Range: 1 to 1500% of the Crab
The Crab Nebula is the strongest steady TeV source in the sky; with a declination of +22o it is visible from both hemispheres and has a moderately hard spectrum. Thus it is useful as a standard candle for comparing instrument sensitivities and source strengths. With integration times of 50 hours (a sizable fraction of the observing year for most observatories), sources can be detected that are 1% of the Crab (Figure 6). However most of the reported sources have signal strengths well in excess of 1%. Systematics tend to limit longer integration times and hence the detection of weaker sources. Flaring AGN have been detected with fluxes (for short periods) in excess of fifteen times the Crab (Figure 7).
The usual standard for acceptance of a new source is that the signal should be at the 5 level. This is a fairly conservative criteria and is probably justified when the systematics are not fully understood. However observations of important candidate objects which are above the 4 level should certainly be reported but treated with some caution. Independent verification by another observatory is perhaps the best criterion for credibility but if that standard was adopted the TeV source list would be very short. This is particularly so in the Southern Hemisphere where most of the sources have been seen by just one experiment.
Angular Resolution: 2 arc-min to 3 degrees
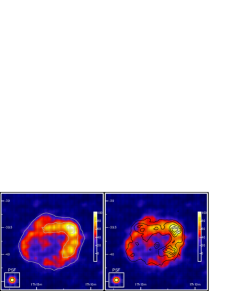
The IACT is optimized for point source detection. H.E.S.S. has an angular resolution of 2 arc-min as demonstrated in the beautiful map of RX J1713.7-3946 (Figure 8). In general, extended sources are more difficult to detect by IACT telescopes. In the surveys that have been made of the Galactic Plane it is clear that many Galactic sources are not point-like. The Milagro experiment has poorer resolution but greater sensitivity for the detection of extended sources (Figure 5). The source location capability is usually sufficiently good that there is no ambiguity in the identification with the target object. Unlike the 100 MeV region where the gamma-ray point source sensitivity is severely limited by the contribution from the Galactic Plane, TeV observations have basically the same sensitivity over all the sky and hence offer better opportunities for source identification for sources that are detected in both energy bands.
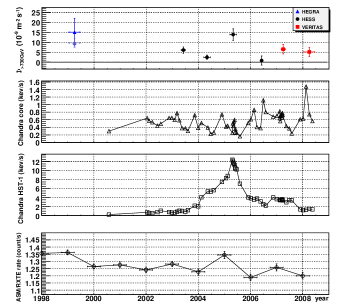
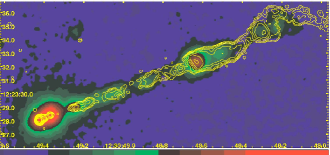
In some cases correlated time variability at other wavelengths with superior angular resolution can lead to source identification on the sub-arc-min scale, e.g. in M87 (Figure 9, Figure 10).
Distance: 500 ly to 1 billion ly
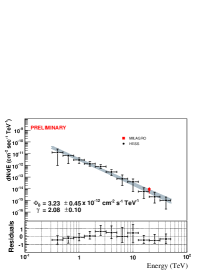
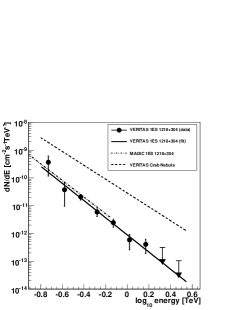
The closest source reported may be Geminga which was nominated as a candidate source by the Milagro group abdo07 . Blazars are the most distant objects (Figure 11) that have been detected. The most distant source detected is still somewhat controversial since there is always uncertaintly about the reshifts of BL Lac objects because of their paucity of emission lines. One would expect the observed spectra of AGN to soften with increasing redshift since the infrared absorption effect should increase with energy; this is generally the case (Figure 12). Certainly there are several AGN detected with redshifts in excess of 0.2; the most distant object is probably 3C279 but this detection still awaits confirmation. 3C66a, which was originally detected by the Crimean Astrophysical Observatory group neshpor98 and has recently been confirmed by VERITAS atel3C66a , is reported to have a redshift of 0.444.
Because the IACT has very good flux sensitivity for the detection of short transients, e.g. Gamma Ray Bursts, it may be that these will be the most distant detectable sources of TeV gamma rays.
Time Variations: minutes to years
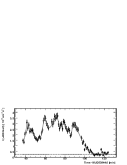
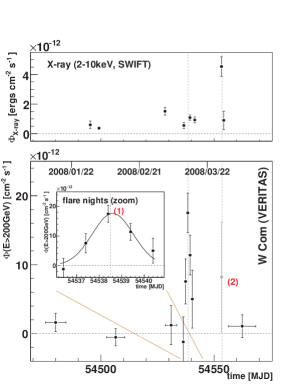
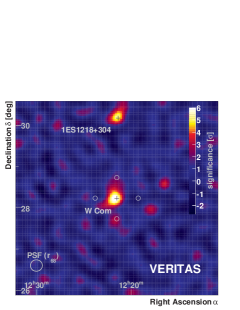
Although some TeV sources have been observed to exhibit rapid time variability, the majority of the reported TeV sources exhibit steady emission within the sensitivity limits of the observatories and the duration of the observations. Time variations have been observed on a scale as short as 2-3 minutes (Figure 7) and as long as years (Figure 9). Some sources are only detected when a flare occurs, e.g. W Comae (Figure 13). The variability of the AGN sources makes TeV astronomy more interesting; it is impossible to predict when a source like Markarian 421 will be flaring so that on-line data analysis is always exciting and often enough to keep the observer awake during a long night of observing. In a few cases optical brightening of the AGN has triggered the detection of TeV flaring AGN. The Galactic sources are generally steady and predictable; the exceptions are the periodic pulsar and binary sources.
The time-scale of the variations of the AGN signals limits the size of the emitting region and can be an important probe for cosmological and fundamental physics studies. Doppler factors in excess of 100 are required to explain the observed variability if one assumes the emission region has a size comparable to the Schwarzschild radius of a massive black hole.
Multiwavelength Coverage:
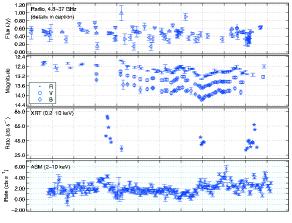
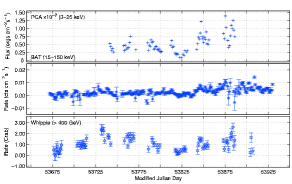
To probe the astrophysics of the sources it is particularly valuable to make correlated observations across the electromagnetic spectrum. The TeV observations, coming at the extreme end of the spectrum, are unique and generally stretch the models to their limits. A number of campaigns have been organized around the TeV observations; these typically involve radio, infrared, optical, X-ray and gamma-ray observatories; an example of the results of one such campaign (on the most variable AGN, Markarian 421) is shown in Figure 14 and 15 (D. Horan, private communication). Of particular value in the study of blazers are correlated observations with hard X-ray observatories.
The organization of multi-wavelength campaigns is particularly difficult because of the difficulties of scheduling diverse instruments in space and on the ground. It is complicated by the different cultures that prevail in the different wavebands. The production of papers based on such campaigns requires the patience of Job. Since many TeV physicists do not have a background in classical astronomy, involvement in such campaigns has the added advantage of increased awareness in other astronomical disciplines. It also increases awareness of TeV astronomy in the wider astronomical community.
Source Density
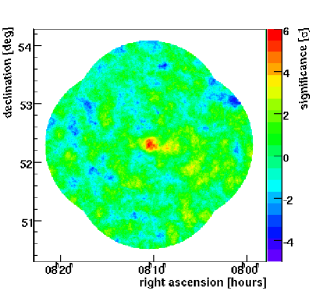
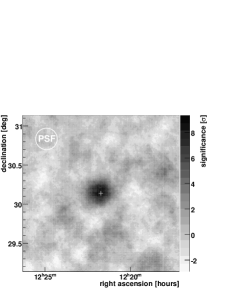
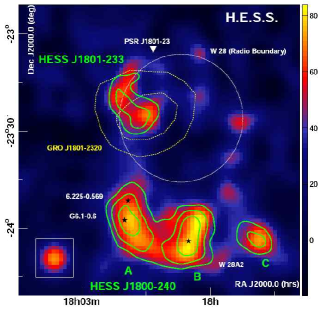
Source confusion was not considered a problem for TeV observatories until recently when the unexpected density and complexity (Figure 16) hessw28 of sources indicated that as the sensitivity of observatories increased, the probability of finding more than one source within the limited field of view of the detectors was definitely finite. While this was not too unexpected close to the Galactic Plane it was somewhat unexpected when it involved extragalactic sources (Figure 17).
Much of the sky has not yet been systematically surveyed; it is important to reexamine archival data in cases where a new source is detected in an apparently empty field.
.
Progress to date
Those who have been involved in, or who have followed, the development of this field cannot help but be pleased at the progress made to date. Some of this progress was predictable but generally I believe most observers have been amazed (and pleased) at how much has been achieved.
A brief list of the highpoints of what we now know about the TeV sky must include:
-
•
Multitude of Sources: initially it was supposed that the TeV sky would be dominated by a small number of sources, probably supernovae remnants, in which hadrons would be accelerated by some process and gamma rays would be produced in the decay of neutral pions created in the collision of the hadrons with gas; this is clearly not the case with many diverse categories of sources and with electron progenitors apparently playing a major role.
-
•
Supernovae Remnants: as expected, gamma-ray emission is seen from some supernovae remnants of the shell variety but they are by no means the dominant sources in the Galaxy; the conventional theory of origin of the cosmic radiation is not substantiated by the TeV gamma-ray observations made to date.
-
•
The 100 MeV Connection: an early assumption was that the TeV sky would be a weak extension of the rich 100 MeV sky revealed by SAS-2, COS-B, and EGRET; in fact the TeV sky has been shown to be an entirely different animal and the large EGRET catalog is seen to be a poor predictor of TeV emission. Hard X-ray emission correlates better with TeV emission and is an indication that Compton- Synchrotron models with electron progenitors can explain the emission in many sources.
-
•
Unidentified Sources: the existence of the so-called ”dark sources” highlights the fact that the TeV sky has unique features that are not apparently duplicated in other wavebands. Based on their spatial distribution it appears that they are mostly Galactic sources.
-
•
Spectra: the spectra of Galactic TeV sources is, in general, much harder than expected; with a few notable exceptions the most interesting discoveries have come, not at the lowest threshold energies, but at the medium energies where the telescopes have the maximum flux sensitivity.
-
•
Extended Sources: since the IACT is particularly sensitive for the detection of point sources, it was not surprising that the first sources detected were all point-like. That many of the new Galactic sources have significant angular extent has been a pleasant surprise and has opened new avenues of astrophysical investigation with comparison of source maps at different wavelengths. The angular resolution of the IACT is surprisingly good and exceeds that found to date at other gamma-ray energies.
-
•
Extragalactic Sources: the number of extragalactic sources is larger than expected; clearly cosmic ray acceleration is not just a Galactic phenomenon. The TeV blazer catalog is the most complete catalog of any category of source and can be expected to grow since even with current sensitivity only a small fraction of the sky has been explored. In contrast much of the nearby rich Galactic sky has been scanned with high sensitivity.
-
•
Transients: one of the great strengths of the ground- based techniques is their large collection area and hence high sensitivity to transient emission. The extragalactic sources exhibit much more variability than the sources found thus far in the Galactic Plane. The time-scale of variations in these sources is much shorter than expected and opens the possibility of testing physical laws as well as pointing to some extraordinary astrophysical processes.
-
•
Absorption: there is less absorption (by photon-photon pair production) in intergalactic space than had been expected; the observable gamma-ray universe is therefore larger than the pessimistic early predictions would have suggested.
-
•
Moonlight: the advent of arrays of imaging detectors with stable trigger systems permit the observation of gamma-ray sources under moonlight with only marginally reduced sensitivity. Although generally the time around full moon is avoided, the traditional number of useful observing hours can be increased by 30-40%.
Source Catalogs
It is not possible to summarize all the observational results in a single publication although a good attempt can be found in aharonian08 . In this field catalogs are difficult because sources are detected by a variety of instruments and new sources are constantly being added. Unlike space missions, ground-based experiments do not have sharp turn-on and turn-off dates so that it is hard to say when a catalog is complete. A useful catalog of the many sources found by the H.E.S.S. observatory can be found on their Webpage hessweb but naturally this does not include sources detected by other groups and hence is biased towards the Southern Hemisphere. Another useful web catalog is that maintained by Deirdre Horan and Scott Wakely horanwakely which only lists those sources that have been accepted for publication. To give some measure of the progress in the field and to provide a bench mark for checking future progress, the generally accepted sources and their vital parameters are gathered here in a series of Tables that are loosely based on the above catalogs.
These are divided into five tables: Extragalactic sources (Table 2), Supernovae Remnants (Table 3), Pulsar Wind Nebulae (Table 4), Milagro Sources (Table 5), Binaries/Miscellaneous (Table 6), and Dark Sources (Table 8). All the sources are designated by their Right Ascension (2000) and Declination (2000) coordinates which have been rounded; a TeV prefix is attached to each source irrespective of its discoverer.
Table 2 lists the catalog of known extragalactic sources; not only is it one of the largest source categories but it is also one of the least ambiguous and the most homogeneous. The 24 sources are listed in terms of their catalog and common name, their redshift (which determines their place in the table), their flux at 1 TeV (usually variable), their power law spectral index, their classification and the discovery group and date. For the sources listed in this and subsequent tables, the original references can be found in aharonian08 . Clearly the predominant sources are BL Lac objects whose SEDs are peaked towards higher frequencies. In all of these objects the TeV emission is associated with the jets.
The distinction between the objects listed in Tables 3 and 4 is not always clear cut. Classical shell supernovae remnants are relatively easy to model and to understand. Objects like those found in the vicinity of W28 are obviously related and their subdivision into distinct sources is somewhat arbitrary. There is particular interest in objects in which the supernovae seems to be interacting with nearby molecular clouds; these are the best candidates for hadronic acceleration and interaction. Pulsar Wind Nebulae are more difficult to model and less likely to be hadronic sources. The pulsar is generally off center and the structure is complex; the Crab Nebula is clearly an exception.
The Milagro sources (Table 5) are all detected at energies in excess of 20 TeV. Only one has been also detected at lower energies by IACT observatories. Since they are all extended and have no clear counterparts, they represent a population that is quite distinct from the sources listed in the other tables.
Table 6 lists a number of diverse but important identified sources. Among these are the four binaries (whose parameters are also listed in Table 7) parades08 . They do not fit into any standard class but these objects probably represent only a small sample of the TeV binary emitters.
In many ways the unidentified sources listed in Table 8 are most interesting since they might represent an entirely new class of object. They are located very close to the Galactic Plane; they seem to be concentrated towards the Galactic Center; they are all extended; all have very flat spectra. They may turn out to be Pulsar Wind Nebulae that for some reason are obscured at other wavelengths; this is the least exciting possibility. Other suggestions are that they might be unusual supernovae remnants, pulsar wind nebulae, giant molecular clouds, stellar clusters with powerful winds or Gamma Ray Burst remnants.
| Catalog Name | Common Name | Redshift | Flux at 1 TeV | Index | Classification | Discovery (Group/Date |
|---|---|---|---|---|---|---|
| TeV1231+124 | M87 | 0.00436 | 1 | 2.9 | FRI | HEGRA/2003 |
| TeV1104+382 | Markarian 421 | 0.031 | 12-97 | 2.4-3.1 | HBL | Whipple/1992 |
| TeV1654+398 | Markarian 501 | 0.034 | 0.5-100 | 1.9-2.3 | HBL | Whipple/1996 |
| TeV2347+517 | 1ES2344+514 | 0.044 | 1-5 | 2.3-2.5 | HBL | Whipple/1998 |
| TeV1136+702 | Markarian 180 | 0.045 | 0.9 | 3.3 | HBL | MAGIC/2006 |
| TeV2000+651 | 1ES1959+650 | 0.048 | 4-120 | 2.7-2.8 | HBL | Tel.Arr./2000 |
| TeV0551-323 | PKS0548-323 | 0.067 | 0.3 | 2.8 | HBL | H.E.S.S./2007 |
| TeV2203+423 | BL Lacertae | 0.069 | 0.3 | 3.6 | LBL | Crimea/2001 |
| TeV2009-488 | PKS2005-489 | 0.071 | 0.2 | 4 | HBL | H.E.S.S./2005 |
| TeV0152+017 | RGB J0152+017 | 0.080 | 2.95 | HBL | H.E.S.S./2008 | |
| TeV1221+283 | W Comae | 0.102 | 3.81 | IBL | VERITAS/2008 | |
| TeV2159-302 | PKS2155-304 | 0.117 | 2-3 | 2.3-2.5 | HBL | Durham/1999 |
| TeV1429+427 | H1426+428 | 0.129 | 1-2 | 2.6-3.7 | HBL | Whipple/2002 |
| TeV0809+524 | 1ES0806+524 | 0.138 | HBL | VERITAS/2008 | ||
| TeV0233+203 | 1ES0229+200 | 0.140 | 0.62 | 2.5 | HBL | H.E.S.S./2006 |
| TeV2359-306 | H2356-309 | 0.165 | 0.3 | 3.1 | HBL | H.E.S.S./2006 |
| TeV1221+302 | 1ES1218+304 | 0.182 | 1.3 | 3.0 | HBL | MAGIC/2006 |
| TeV1103-232 | 1ES1101-232 | 0.186 | 0.4 | 2.9 | HBL | H.E.S.S./2007 |
| TeV0349-115 | 1ES0347-121 | 0.188 | 0.45 | 3.1 | HBL | H.E.S.S./2007 |
| TeV1015+495 | 1ES1011+496 | 0.212 | 0.3 | 4.0 | HBL | MAGIC/2007 |
| TeV1556+112 | PG1553+113 | 0.3-04 | 0.1-0.2 | 4.0 | HBL | H.E.S.S./2006 |
| TeV0219+425 | 3C66a | 0.444 | IBL | Crimea/1998 | ||
| TeV1256-058 | 3C279 | 0.536 | - | 4.1 | FSRQ | MAGIC/2008 |
| TeV0716+714 | S50716+714 | ? | HBL | MAGIC/2008 |
| Object Catalog | Common Name | lII | bII | Type | Distance kpc | Discovery Group/Date |
|---|---|---|---|---|---|---|
| TeV0616+225 | IC443 | 189.03 | 2.90 | Shell (PWN?) | 1.5 | MAGIC/2007 |
| TeV0852-463 | R0852-4622 | 266.28 | 1.24 | Shell | 10.2 | H.E.S.S./2005 |
| TeV1442-625 | RCW 86 | Shell | 1 | H.E.S.S./2007 | ||
| TeV1714-398 | RX J1713.7-3946 | 347.28 | 0.38 | Shell | 1 | CANGAROO/2001 |
| TeV1714-382 | CTB37B | 348.65 | -0.38 | 10.2 | SNR | H.E.S.S./2006 |
| TeV1714-385 | CTB37A | 348.39 | 0.11 | 10.3 | SNR | H.E.S.S./2008 |
| TeV1747-282 | G0.9+0.1 | 0.87 | 0.08 | SNR (PWN?) | 8.5 | H.E.S.S./2005 |
| TeV1802-233 | W28 | 6.66 | 0.27 | Shell | 2 | H.E.S.S./2008 |
| TeV1833-105 | G21.5-0.9 | 21.5 | -0.7 | Shell (PWN?) | 4 | H.E.S.S./2008 |
| TeV1846-027 | Kes 75 | 29.9 | 0.0 | SNR (PWN?) | 6 - 19 | H.E.S.S./2008 |
| TeV2323+588 | Cassiopeia A | 111.73 | -2.1 | SNR | 3.4 | HEGRA/2001 |
| Object Catalog | Common Name | Association | lII | bII | Distance kpc | Discovery Group/Date |
|---|---|---|---|---|---|---|
| TeV0535+220 | Crab Nebula | M1 | 184.56 | -5.78 | 2 | Whipple/1989 |
| TeV0835-463 | Vela X | 263.91 | -3.01 | 0.29 | H.E.S.S./2006 | |
| TeV1418-610 | Kookaburra Rabbit | G313.3+0.1? | 313.25 | 0.15 | 5.6 | H.E.S.S./2006 |
| TeV1420-607 | Kookaburra Pulsar | P1420-6048 | 313.56 | 0.27 | 5.6 | H.E.S.S./2006 |
| TeV1514-592 | MSH 15-52 | 320.33 | -1.19 | 5.21 | H.E.S.S./2005 | |
| TeV1641-465 | G338.3-0.0 | 338.32 | -0.02 | 8.6 | H.E.S.S./2005 | |
| TeV1718-385 | 348.83 | -0.49 | 4.2 | H.E.S.S./2005 | ||
| TeV1811-193 | PSR J1809-1917 | 11.18 | -0.09 | 3.7 | H.E.S.S./2007 | |
| TeV1826-138 | PSR J1826-1334 | 17.82 | -0.74 | 3.9 | H.E.S.S./2005 | |
| TeV1913+102 | PSR J1913+1011 | 44.39 | -0.07 | H.E.S.S./2007 |
| Object Catalog | Common Name | lII | bII | Size degrees | Discovery Group/Date |
|---|---|---|---|---|---|
| TeV1908+060 | MGRO J1908+06 | 40.16 | -0.93 | 0.5 | Milagro/2007 |
| TeVJ2019+37 | MGRO J2019+37 | 75.11 | 0.54 | 1.1 | Milagro/2007 |
| TeV2031+41 | MGRO J2031+41 | 79.72 | 0.94 | 3.0 | Milagro/2007 |
| Object Catalog | Common Name | lII | bII | Type | Distance kpc | Discovery Group/Date |
|---|---|---|---|---|---|---|
| TeV0240+612 | LSI +61 303 | 135.68 | 1.09 | Binary | 2 | MAGIC/2006 |
| TeV0633+058 | 205.66 | -1.44 | Binary? | 1.6 | H.E.S.S./2007 | |
| TeV1023-575 | Westerlund 2 | 284.19 | -0.39 | Stellar cluster | 8 | H.E.S.S./2007 |
| TeV1302-638 | PSR 1259-63 | 304.19 | -0.99 | Binary | 1.5 | H.E.S.S./2005 |
| TeV1746-290 | Galactic Center | 359.95 | -0.05 | Black Hole | 8.5 | CANGAROO/2004 |
| TeV1746-290 | Galactic Ridge | 359.95 | -0.05 | Diffuse Source | 8.5 | H.E.S.S./2006 |
| TeV1759-240 | W28C | 5.7 | -0.1 | Unknown | 2 - 4 | H.E.S.S./2008 |
| TeV1800-240 | W28B | 5.90 | -0.36 | Molecular Cloud | 2 - 4 | H.E.S.S./2008 |
| TeV1800-240 | W28A | 6.14 | -0.63 | Molecular Cloud | 2 - 4 | H.E.S.S./2008 |
| TeV1826-149 | LS 5039 | 16.88 | -1.29 | Binary | 2.5 | H.E.S.S./2005 |
| TeV1958+352 | Cyg X-1 | 71.3 | 3.1 | XRB | 2.2 | MAGIC/2007 |
| Source/Parameter | PSR B1259-69 | LSI+61 303 | LS5039 | Cygnus X-1 |
|---|---|---|---|---|
| Type | B2Ve+NS | BOVe+NS | O6.5+BH? | O9.7Iab+BH |
| Distance (kpc) | 1.5 | 2.0 | 2.5 | 2.2 |
| Periodicity (days) | 1,237 | 25.5 | 3.9 | 5.6 |
| VHE | Regular ? | Irregular | Regular | Transient |
| Observatory | H.E.S.S. | MAGIC, VERITAS | H.E.S.S. | MAGIC |
| Radio Period | 48 ms, 3.4 yr | 26.5 d, 4 yr | Steady | Steady |
| L (X-rays) x1033 erg/s | 0.3 - 6 | 3 - 9 | 5 -50 | 10,000 |
| L (VHE gamma)x 1033 erg/s | 2.3 | 8 | 7.8 | 12 |
| Index (VHE) | 2.7 | 2.6 | 2.06 | 3.2 |
| EGRET Source | - | 3EG J0241+6103 | 3EG J1824-1514 | - |
| Object//Catalog | lII | bII | Index | Association (Possible) | Discovery Group/Date |
|---|---|---|---|---|---|
| TeV1303-632 | 304.24 | -0.36 | 2.4 | H.E.S.S./2005 | |
| TeV1428-608 | 314.41 | -0.14 | 2.16 | H.E.S.S./2008 | |
| TeV1614-518 | 331.52 | -0.58 | 2.46 | H.E.S.S./2005 | |
| TeV1616-509 | 332.39 | -0.14 | PSR J1617-5055 | H.E.S.S./2005 | |
| TeV1626-490 | 334.77 | 0.05 | 2.18 | H.E.S.S./2008 | |
| TeV1632-478 | 336.38 | 0.19 | 2.12 | I16320-4751 | H.E.S.S./2006 |
| TeV1635-473 | 337.11 | 0.22 | 2.4 | I16358-4726 | H.E.S.S./2006 |
| TeV1703-420 | 344.30 | -0.18 | 2.1 | P1702-4128 | H.E.S.S./2006 |
| TeV1708-410 | 345.68 | -0.47 | 2.46 | H.E.S.S./2006 | |
| TeV1732-347 | 353.57 | -0.62 | 2.3 | H.E.S.S./2008 | |
| TeV1745-304 | 358.71 | -0.64 | 1.82 | H.E.S.S./2006 | |
| TeV1805-217 | 8.40 | -0.03 | 2.7 | G8.7-0.1 | H.E.S.S./2005 |
| TeV1809-194 | 10.92 | 0.08 | PSR J1809-1917 | H.E.S.S./2007 | |
| TeV1814-178 | 12.81 | -0.03 | 2.1 | G12.82-0.02 | H.E.S.S./2005 |
| TeV1835-088 | 23.24 | -0.32 | 2.5 | W41/G23.3-0.3 | H.E.S.S./2005 |
| TeV1838-070 | 25.18 | -0.11 | 2.27 | G25.5+0.0 | H.E.S.S./2005 |
| TeV1841-056 | 26.80 | -0.2 | 2.4 | H.E.S.S./2008 | |
| TeV1857+027 | 35.96 | -0.06 | 2.39 | PSR1856+025 | H.E.S.S./2008 |
| TeV1858+021 | 35.58 | -0.58 | 2.1 | H.E.S.S./2008 | |
| TeV2032+415 | 80.25 | 1.07 | 1.9 | Cyg OB2 | HEGRA/2002 |
Outlook
Retrospective
Nearly fifty years ago the real pioneers of TeV astronomy, Chudakov and Zatsepin in the U.S.S.R. and Jelley and Porter in the British Isles, made their first brave venture into this now rich field of TeV gamma-ray astronomy; it was a major leap of faith since it was truly terra incognita. When these early experiments were planned, there were no known 100 Mev sources; indeed in 1960 there were no known X-ray sources and thus the known astrophysical electromagnetic spectrum beyond the earth effectively ended in the near ultraviolet. Although the observation of the cosmic radiation was a clear indication that high energy particles must be accelerated somewhere, commonsense would have suggested that since the cosmic particles were observed to have a steeply falling energy spectrum, it was unlikely that the first high energy sources would be apparent at the high gamma-ray energies where the fluxes would be very low. As early as 1962 it was pointed out that photon-photon absorption might be a serious limitation for TeV gamma-ray astronomy (nikishov62 ); fortunately the optical cosmic photon density was overestimated and the gamma-ray horizon was not as near as these gloomy predictions indicated. The few models of TeV source intensity that were proposed considered only pion production in hadron collisions and were speculative at best.
In fact these early pioneers were either woefully ignorant of the astrophysics or extremely optimistic; either way they had to have great self-confidence to feel that they had the ability to beat the odds!
TeV Gamma-ray Astronomy is now a mature science with cutting edge instruments, mature observatories, dedicated and experienced adherents, and catalogs of diverse sources. The question might then be asked why this discipline took so long to develop for, unlike its counterparts in the X-ray and 100 MeV gamma-ray bands, it did not have to await the development of space technology. By 1980 the concept for a new generation of telescope had already been proposed (jelleyporter ;porterhill ;grindlay76 ; turverweekes78 )
It may be that this second generation of astronomers were not imaginative enough or were too conservative to exploit the possibilities of these energy bands. But the slow progress must also be at least partially because the ground-based Cherenkov technique was not easy to categorize and thus it was difficult for funding agencies to fit it into their normal modes of support for astrophysical research. At a time when ”gamma-ray astronomy” was synonymous with space astronomy (and support therefore assumed to come from national space agencies such as NASA), there was no natural conduit for serious funding. It was not really high energy physics, it was not space astronomy, it was not traditional cosmic ray astronomy and it required the dark high remote sites traditionally associated with optical astronomy. Even the Smithsonian Astrophysical Observatory, which, with internal funding, had been prepared to gamble on such ventures in the lush days of the sixties withdrew support in 1976 when it was apparent that the early results were not promising enough for NASA to support as providing useful complementary observations to the space missions.
The first real impetus to develop the IACT in the USA came about as a direct result of the activity of neutrino astronomers who had a high profile and ready constituency of support from high energy physicists. In fact it was largely pressure from the neutrino astronomy community to build a major underwater telescope that led the High Energy Division of the U.S. Department of Energy to fund the pioneer effort in IACT at the Whipple Observatory in 1982. The thinking here was that if it could be demonstrated that there were no sources of TeV gamma rays detected with this more sensitive, but relatively inexpensive, technique, then there would be little justification for the construction of the much more expensive neutrino telescopes. The slow development of the IACT was thus justification for the agencies to delay the large investment necessary for the construction of large neutrino telescopes; high energy physics funding could then be reserved for the perceived more interesting area of high energy particle research at accelerators. The subsequent success of the IACT observatories has been a major impetus for the construction of the new generation of neutrino telescopes even though there is still not strong evidence that the progenitor particles in most TeV gamma-ray sources are hadrons and therefore likely neutrino producers.
1.1 Perspective
The present plethora of sources at TeV energies must mean that the prospects for fruitful research are bright for the coming epoch. If the number of participants means anything, then one cannot but be impressed by the fact that hundreds of scientists (if one is to judge by the list of authors) have migrated into this field; this is far in excess of the numbers at any previous epoch.
While much has been done, there is still much to be done. Among the potential sources yet to be detected are:
-
•
Pulsars (more than one)
-
•
Starburst Galaxies
-
•
Dark Matter
-
•
Auger Source Counterparts
-
•
Gamma Ray Bursts
Although there is more than enough work to do with the present instrumentation it is important, and indeed inevitable, that some effort is devoted to the development of the technology necessary for a new generation of telescopes. It is easy to envisage the extension of the IACT by simply multiplying the number of telescopes; the difficulty is to do so economically. An N-fold increase in the number of telescopes (and approximately in cost) only results in an increase in sensitivity by a factor of N0.5. In the absence of a major technical breakthrough, then we are entering into an era of extremely expensive ground-based observatories; in fact the costs will begin to be in the same ballpark as the cost of building space telescopes.
There is not a single driving scientific justification for this major upgrade in sensitivity but rather a desire to do better in all the areas currently being explored buckley08 . In the current, rather gloomy, economic climate it will be a brave effort to seek funding in excess of a hundred million dollars or euros without a single critical scientific imperative (like the nature of dark matter, the existence of dark energy or the meaning of life!). However no such single mission objective existed for Fermi (GLAST) either.
Two such efforts of IACT construction are now under consideration: the largely European CTA which aims to scale up the existing arrays and hopes to achieve savings by mass production, and the somewhat more innovative US AGIS which would attempt to develop a new approach to telescope and camera design. Some might argue that all resources could be pooled so that one major observatory could be built with the maximum sensitivity. However while it makes sense to have as much cooperation as possible between such observatories, there is a strong argument to be made for at least two independent observatories using different technologies (apart from the obvious one of needing two to fully cover both hemispheres). It is very important in extending a discipline into a new region of parameter space that marginal and threshold detections can be confirmed and that systematic effects be identified. AGILE and Fermi are in this happy situation. Given the wide range of phenomena that might be observed it is unlikely that the observation requirements can be satisfied by a single instrument without introducing serious compromises in its design. Also since some four decades of the electromagnetic are available, it may be sensible to concentrate and optimize on particular bands. The large fields of view that are optimum for the study of extended Galactic sources are generally wasteful for the study of point sources like AGN. The mapping of supernovae remnants at high energies requires instruments with very large collection areas and high angular resolution.
The ongoing observations using the IACT will be complemented by the continued operation and extension of the ground-based particle arrays. These have already demonstrated that they are capable of detecting TeV sources; long integrations are possible because of their high duty cycle. They are particularly sensitive to extended sources. Although the anticipated detection of transient sources has not materialized, the completion of HAWC (this symposium) by the Milagro group at a high elevation site in Mexico will open new possibilities in this regard.
Given the fiscal realities of 2008 it will not be surprising if, for the next few years, the ground-based IACT community must rely on incremental improvements to existing observatories, rather than order of magnitude scaling up to a new generation of observatories. It is somewhat disappointing that despite the success of the IACT, no dramatic improvement in detection technique has been proposed. A moratorium imposed by the bleak economy may be advantageous in that the results obtained with the current observatories can be thoroughly considered, new technologies may be taken advantage of, and innovative ideas for new detection strategies fostered.
In the coming decade gamma-ray astronomy in the GeV regime will surely be dominated by AGILE and Fermi; complementary observations by upgraded versions of the current ground-based observatories at energies in excess of 100 GeV where the IACT is most sensitive will extend the scientific impact of these missions and form a firm basis for new facilities, both in space and on the ground.
References
- (1) Weekes, T.C., ”TeV Gamma-ray Astrophysics”, Heidelberg Workshop, October, 1994, Space Science Reviews, 75, 1 (1996)
- (2) Weekes, T.C., ”High Energy Gamma Ray Astronomy”, Heidelberg International Symposium, June, 2000, AIP Conference Proceedings, 558, 15, (2000)
- (3) Hinton, J., Proceedings of 30th International Cosmic Ray Conference, Merida, Mexico, July 2007, (in press), astro-ph0712.3352 (2007)
- (4) De Angelis, A., Mansutti, O., Persic, M., Il Nuovo Cimento, (in press) astro-ph 0712.0315 (2008)
- (5) Aharonian, F., Buckley, J., Kifune, T., Sinnis, G., J.Phys.G: Nucl.Part.Phys. (in press) (2008)
- (6) Buckley, J., et al., APS White Paper, astro-ph:0810.0444 (2008)
- (7) Abdo, A.A. et al., ApJL, 643, L53 (2007)
- (8) Cawley, M.F, et al. 19th International Cosmic Ray Conference, La Jolla, California) 1, 131 (1985)
- (9) Weekes, T.C., et al., ApJ, 342, 379, (1989)
- (10) Fazio, G.G., Helmken, H.F., Rieke, G.H., Weekes, T.C., ApJL, 154, L83 (1968)
- (11) Otte, A.N., MAGIC Collaboration, Proceedings of 30th International Cosmic Ray Conference, Merida, Mexico, July, 2007 , astro-ph 0712.1386 (2007)
- (12) Aharonian, F. et al., A&A, 464, 235 (2007)
- (13) Djannati-Atai, A., H.E.S.S. Collaboration, Proceedings of 30th International Cosmic Ray Conference, Merida, Mexico, July, 2007, Astro-ph 0710-2418, (2007)
- (14) The Astronomer’s Telegram, 1415, 1 (2008)
- (15) Cogan, P., VERITAS Collaboration (this Symposium) (2008)
- (16) Aharonian, F. et al., ApJL, 664, L71 (2007)
- (17) Hui, M., VERITAS Collaboration, (this Symposium) (2008)
- (18) Y. I. Neshpor et al., Astronomy Letters 24 (1998) 134
- (19) The Astronomer’s Telegram, 1753, 1 (2008)
- (20) Fortin, P., VERITAS Collaboration (this Symposium) (2008)
- (21) The Astronomer’s Telegram, 1422, 1 (2008)
- (22) Albert, J. et al., 2006, ApJ, 642, L119.
- (23) The Astronomer’s Telegram, 1565, 1 (2008)
- (24) Beilicke, M., VERITAS Collaboration (this Symposium) (2008)
- (25) Aharonian, F. et al., A&A, 481, 401 (2008)
- (26) http://www.mpi-hd.mpg.de/hfm/HESS/pages/home/sources/
- (27) Horan, D., Wakely, S., http://tevcat.uchicago.edu/
- (28) Nikishov, A.J., Sov. Phys.-JETP, 14, 393 (1962)
- (29) Parades, J.M., astro-ph 0803-1097 (2008)
- (30) Jelley, J.V., Porter, N.A., M.N.R.A.S. 4, 275 (1963) 1964
- (31) Hill., D.A., Porter, N.A., Nature, 191, 690 (1960)
- (32) Grindlay, J. et al. ApJL, 559, 100 (1996)
- (33) Weekes, T.C., Turver, K.E., Proc.12th ESLAB Symp.(Frascati), 279 (1977)