Merging and splitting of clusters with the full simulation of the barrel electromagnetic calorimeter of the KLOE detector with FLUKA.
INSTITUTE OF PHYSICS
FACULTY OF PHYSICS, ASTRONOMY
AND APPLIED COMPUTER SCIENCE
JAGIELLONIAN UNIVERSITY
Merging and splitting of clusters in
the electromagnetic calorimeter
of the KLOE detector
Jarosław Zdebik
Master Thesis
supervised by
Prof. Dr habil. Paweł Moskal
prepared in Nuclear Physics Department
of the Jagiellonian University
improved version
![[Uncaptioned image]](/html/0811.1377/assets/x1.png)
KRAKW 2008
INSTYTUT FIZYKI
WYDZIAŁ FIZYKI, ASTRONOMII
I INFORMATYKI STOSOWANEJ
UNIWERSYTET JAGIELLOŃSKI
Efekty ła̧czenia i separacji klastrów
w kalorymatrze elektromagnetycznym
detektora KLOE
Jarosaw Zdebik
Praca magisterska
pod kierunkiem
Prof. dr hab. Pawła Moskala
przygotowana w Zakładzie Fizyki Ja̧drowej
Uniwersytetu Jagiellońskiego
wersja poprawiona
![[Uncaptioned image]](/html/0811.1377/assets/x2.png)
KRAKW 2008
"The next question was - what makes planets go around the sun? At the time of Kepler some people answered
this problem by saying that there were angels behind them beating their wings and pushing the planets around
an orbit. As you will see, the answer is not very far from the truth. The only difference is that the angels
sit in a different direction and their wings push inward."
"Nastȩpnym pytaniem było - co sprawia, że planety kra̧ża̧ wokół słońca?
W czasach Keplera niektórzy ludzie
odpowiadali, że za planetami sa̧ aniołowie, którzy popychaja̧ je machaja̧c skrzydłami.
Jak widzisz,
odpowiedź ta nie jest daleka od prawdy. Jedyna różnica jest taka, że aniołowie zasiadaja̧
w innej pozycji
i ich skrzydła pchaja̧ do środka."
Richard Feynman (1918 - 1988),
Character of Physical Law
Abstract
The work was carried out in the framework of the KLOE collaboration studying the decays of the meson produced in
the DANE accelerator in the collisions of electron and positron.
The main aim of this thesis was investigation of the influence of the merging and splitting of clusters in decays with the high
multiplicity of quanta, which are at most biased by these effects.
For this aim we implemented the full geometry and realistic material composition of the barrel electromagnetic calorimeter in
FLUKA package. The prepared Monte Carlo based simulation program permits to achieve a fast generation of the
detector response separately for each interested reaction.
The program was used to study the reconstruction efficiency with the KLOE clustering algorithm as a
function of the photocathode quantum efficiency.
It was also used to investigate
merging and splitting probabilities as a function of the quantum efficiency.
The conducted studies indicated that the increase of quantum efficiency does not improve significantly the identification of clusters.
The influence of these effects was estimated for meson decays into 3 and Kshort meson into 2.
Streszczenie
Praca została wykonana w ramach kolaboracji KLOE, która zajmuje siȩ badaniem rozpadów mezonu ,
produkowanego w kolizjach elektronu i pozytonu na akceleratorze DANE.
Głównym celem pracy było oszacowanie wpływu efektów "merging" i "splitting" na możliwości rekonstrukcji
rozpadw mezonu w kanały z fotonami. Właśnie rekonstrukcja topologii reakcji z duża̧ zawartościa̧
fotonów w kanale wyjściowym jest najbardziej obcia̧żona przez te efekty.
W tym celu zaimplementowaliśmy cała̧ geometriȩ kalorymetru elektromagnetycznego detektora KLOE
wraz z realistycznym opisem materiałów do programu symulacyjnego opartego na metodzie
Monte Carlo. Program symulacyjny pozwala na studiowanie wybranych kanałów
rozpadu oddzielnie. Również wysymulowaliśmy odpowiedź fotopowielaczy na całym kalorymetrze detektora KLOE.
Zbadane zostały także efekty "merging" i "splitting" w zależności od wydajności kwantowej w fotopowielaczach.
Powyższe studia pokazały, że zwiȩkszenie wydajności kwantowej fotopowielaczy nie wpływa znacza̧co na
redukcjȩ tych efektów.
Wpływ efektów "merging" i "splitting" został oszacowany dla reakcji rozpadu mezonu na trzy neutralne
piony oraz kaonu Kshort na dwa neutralne piony.
Chapter 0 Introduction
Nowadays, elementary particles and interactions among
them are described in the framework of the Quantum Mechanics and Standard Model. Tests of these theories and of
fundamental symmetries like C, P, T and their combinations are therefore crucially important for understanding the
phenomena in the world of particles [1].
Experiments aiming at the determination of the particle properties and search for processes beyond the applicability of the
domain of the Standard Model
are conducted in many particle physics laboratories.
Such studies are carried out also in the Laboratori Nazionali Di Frascati (LNF) by means of the electron-positron
collider DANE and the KLOE detector setup. The KLOE group has taken data at the colliding
electron-positron center-of-mass energy corresponding to the meson mass. The main objectives of the KLOE experimental program
are: investigations of the decays of kaons produced in pairs from the decays of the meson, the radiative
decays of the meson, the rare branching ratios of the meson and the light mesons particle properties.
One of the interesting example for the pseudoscalar mesons decay is the G-symmetry violating process
whose branching ratio cannot be described neither in the framework of the Chiral Perturbation Theory nor by the Vector Meson
Dominance Model.
At present KLOE detector is being upgrated in
order to improve the possibility of the reconstruction of the decays of the mesons. In particular in order to investigate
a CP-violating decay [2].
The and are examples of highly interested channels which are however very
challenging to study experimentally due to the large number of the quanta in the final state.
This fact is caused by difficulties of the rejection of background channels due to
merging and splitting of clusters [3]. For example, for the first mentioned reaction a background channel is with
two merged clusters leading to the same topology as in the case of the .
And in the case of the the background constitues a reaction with two splitted clusters.
In this diploma thesis we investigate the influence of the merging and splitting of clusters on decays
with the high multiplicity of quanta, which are at most biased by these effects.
For this aim we implemented the full geometry and realistic material composition of the barrel electromagnetic calorimeter into FLUKA package.
The prepared Monte Carlo based simulation program permits to achieve a fast generation of the detector response separately
for each interested reaction.
In chapter 2 we will describe the DANE collider and the KLOE detector.
Chapter 3 comprises description of the vertex
generator, used to simulate the kinematics of physical decays, and the description of the physics models used by the FLUKA Monte-Carlo program for the
generation of nuclear, hadronic and electromagnetic reactions. This chapter includes also description of implementation of materials composition
and geometry of the barrel calorimeter in the FLUKA Monte Carlo.
Chapter 4 presents a calibration of the DIGICLU program used for the reconstruction of the photomultiplier response
and for the cluster recognition. This chapter includes: i) preparation of the data sample for
reaction, ii) estimation of the attenuation length for scintillating fibers,
iii) calibration of ionization deposits and implementation of the threshold formula to the source code.
In chapter 5 we describe effects of merging of clusters for as a background for the
channel and splitting of clusters for as a background for reaction. Further on reconstruction
efficiency with the KLOE clustering algorithm as a function of the photocathode quantum efficiency is presented.
Finally, merging and splitting probabilities as a function of the quantum efficiency are studied.
Chapter 6 summarises the whole thesis and brings the conclusions and remarks.
This thesis is supplemented with appendics where section A presents a kinematic fit procedure and section B generally describes
Monte Carlo Methods. In appendix C energy distribution for is presented. Section D presents a time distribution
for single and multi-gamma hits.
The sections E and F contain an estimation of probability for multi-gamma
hits at a single calorimeter module and example of the event reconstruction for the process
,
respectively. The G section comprises a description of the energy deposition in the barrel calorimeter as a function of
azimuthal angle and the last section presents definition of the used coordinate system.
Chapter 1 KLOE2 at DANE experimental facility
The KLOE (Klong Experiment) detector is installed at the interaction point of the electron and positron beams
of the DANE (Double Annular
-factory for Nice Experiments) collider operating in the Laboratori Nazionali di Frascati (LNF).
It has been designed with the primary goal to measure the CP violation parameter R()
[4] with a sensitivity
of one part in ten thousand by using the double ratio method [5].
This detector was fully constructed by
the end of the year 1998 [1], and since then it was taking data for seven years.
The experimental program was completed with integrated luminosity of 2.5 fb-1 obtained predominantly with the center-of-mass energy
equal to the mass of the meson ( = 1019.4560.020 MeV [6]).
| Decay | BR(%) |
|---|---|
| 49.1 | |
| 33.8 | |
| / | 15.6 |
| 1.26 |
The cross section for the production of the vector meson is large and amounts to
= 3.1 b.
The meson decays predominantly into pairs of neutral or charged kaons
(see Table 1).
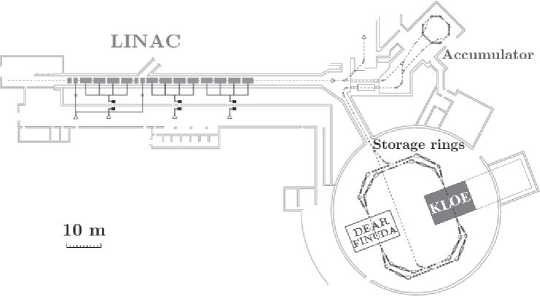
1 DANE collider
DANE at Frascati consists of two intersecting crossing accelerator rings, one for positrons and one for electrons. The main DANE parameters are presented in Table 2, and scheme of the facility is shown in Fig. 1.
| Parameter | Value |
|---|---|
| Energy [GeV] | 0.51 |
| Trajectory length [m] | 97.69 |
| RF frequency [MHz] | 368.26 |
| Bunch length [cm] | 1-3 |
| Number of colliding bunches | 111 |
| Emittance, [mmmrad] | 0.34 |
Positrons and electrons are accelerated in the LINAC (Linear Accelerator) which
delivers electron or positron beams
in the energy range from 25 to 725 MeV with intensities varying
from particle per pulse down to a single-electron [7].
This 60 meters long accelerator is the heart of the DANE injection system.
It is an S-band machine (2.865 GHz) which
delivers 10 ns pulses at a repetition rate of 50 Hz.
Electrons, after acceleration to
final energy in the LINAC, are accumulated and cooled in the accumulator and
transferred to a single bunch into ring. Positrons require first accelerating of
electrons to about 250 MeV to target in the LINAC, where
positrons are created. Afterwards the positrons follow the same accelerator elements as
electrons [1].
Positrons and electrons after acceleration and accumulation process run around in two storage rings
and hit in the collision points.
This facility is called a Frascati -Factory complex because it was able to produce about 3.3 bilions of
mesons during the years from 2000 to 2005.
The KLOE experiment was located in one of the two collision points at
DANE collider, whereas the second collision point was alternatively occupied by two other experiments: DEAR [8] and FINUDA
[9].
At present a new interaction region is being constructed [10]
in order to increase the collider luminosity up to an order of magnitude, from 1032cm-1s-2
to cm-1s-2 [3].
At the interaction point (IP) the beam pipe has the shape of a sphere which is made of a beryllium-aluminium alloy with 10 cm diameter and 50 m thickness. The beryllium, having a low atomic number, has been used to minimize the interaction of particles produced at the interaction point with the beam pipe material [6].
2 KLOE detector
The KLOE detector, which is shown schematically in Fig. 2, was designed for the study of CP violation in the neutral-kaon system. It consists of two main elements: i) an electromagnetic calorimeter (EmC) [11] for the detection of quanta, charged pions and mesons and ii) a large drift chamber (DC) [12] for the measurement of charged particles trajectories [13]. The drift chamber and the calorimeter are inserted in the field of the superconducting coil which produces a magnetic field parallel to the beam axis [11]. The field intensity is equal to 0.52 T [6].
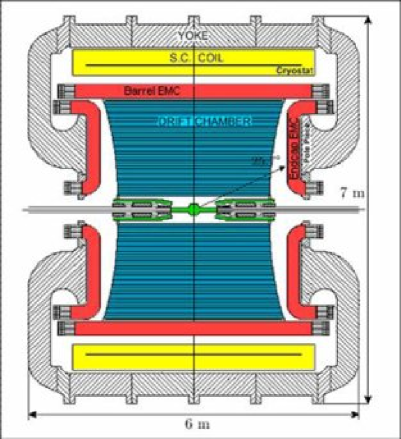
The radius of the active part of the KLOE detector is two meters. This size enables to register about 40% decays of neutral long-lived kaons [1]. In the near future KLOE will be upgraded by inner tracker and tagger in order to improve its tracking capabilities [3].
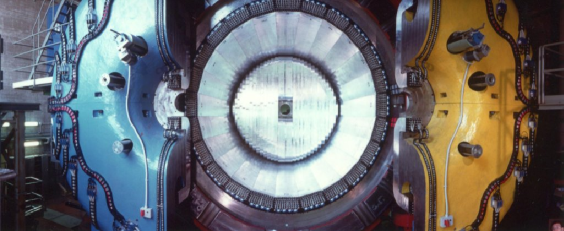
1 Drift Chamber
The KLOE Drift Chamber (DC) [12] consists of 12582 drift cells (2x2, 3x3 ) arranged in 58 cylindrical layers surrounding the beam pipe. The diameter and length of the DC is equal to 4 m and 3.3 m, respectively [14]. It is filled with 90% helium and 10% isobutane gas mixture, giving a radiation length (gas + wires) equal to 900 m. Charged particles traveling through the drift chamber are ionizing gas medium and then electrons created along the particle trajectory drift to the wires with positive voltage. A multiplication mechanism causes detectable signal at the wire’s end [1]. The DC measures the charged vertex with 1 mm accuracy. It provides fractional momentum resolution of 0.5% for low momentum tracks. It is transparent to down to 20 MeV and limits to acceptable levels the regeneration and multiple scattering.
The hit position resolution is 150 m in the central part of the cell, increasing close to the
wire
and towards the cell boundary. The spatial resolution in the " coordinate" (azimuthal angle) is well below 200 m.
The hit identification efficiency is larger than 99%, whereas the efficiency for associating an existing hit to track amounts to
about 97% [14].
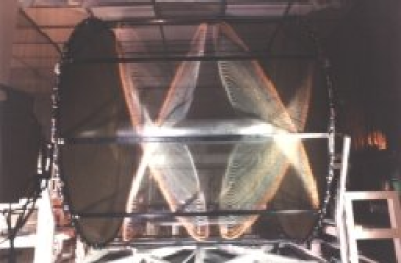
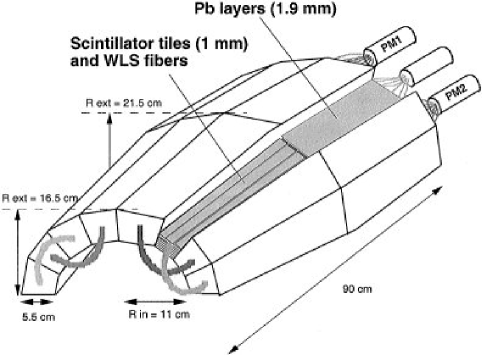
2 Electromagnetic Calorimeter
The KLOE calorimeter is made of the lead layers with about 1,2 mm thickness (200 layers per 1 module) which are filled with scintillating fibers of 1 mm diameter. The whole electromagnetic calorimeter (EmC) consists of three main parts: barrel and two endcaps. Barrel (Fig. 4) is composed of 24 modules with trapezoid shape of 23 cm thickness aligned with the beams and surrounding the drift chamber detector. Endcaps are situated over the magnet pole pieces (see Fig. 2) and hermetically close the calorimeter with 98% of 4 [1]. Each of the two endcaps calorimeters consists of 32 vertical modules with length ranging from 0.7 to 3.9 meters. The endcap modules are bent and their cross-section with plane parallel to the beam axis is rectangular with thickness of 23 cm [16].
The volume of the calorimeter consists of 50% fiber, 40% lead and 10% of glue. The measured performances for this detector are: full efficiency for quanta from 20 to 500 MeV [14], 1 cm, , .
3 Upgrade of the KLOE detector
At present the KLOE detector is being upgrated in view of the new experimental program which will extend the studies to the more precise measurement of the mesons and the production of meson in the fusion [3]. For this aim a vertex detector and the -tagger [17] are being built [26].
Vertex Detector
In the KLOE detector the first hit was measured by drift chamber at a radius of 28 cm from the interaction point (IP) [3]. Therefore in order to improve the resolution of the determination of the and decay near the interaction point a new vertex detector is constructed [17]. This detector consists of five concentric layers of cylindrical triple-GEM (C-GEM), completely realized with very thin polyimide foils [20, 21, 22, 18, 19]. The scheme of the vertex detector is presented in Fig. 5.
It will be made of light materials in order to minimize absorbtion. The resolution on r- surface is expected to be around 200 m and on z coordinate about 500 m [23].
tagger
The main task of this detector is the detection of and from reactions emitted at small angle [23, 43] with the widest possible energy ranges. tagger will provide information on the angle and the energy of the scattered electrons and positrons [24] and hence it will permit to study the production of mesons in fusion via the reaction:
| (1) |
where X is some arbitrary final state allowed by conservations laws.
The tagger consists of microstrip silicon detector and plastic scintillator hodoscope.
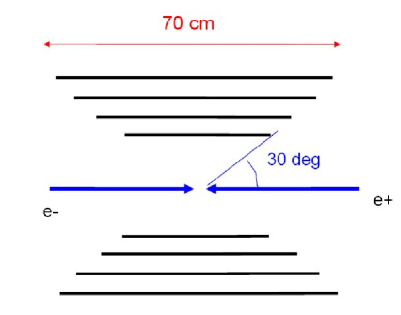
New QCAL
The upgrade of QCAL detector (Fig. 6) [25] was needed, because the interaction region was modified and in the present scheme the angle between colliding beams has been increased from 8 to 18 degrees, which practically excludes the possibility to use the existing QCAL calorimeter [26]. The schematic view of upper part of the previous QCAL detector is presented in Fig. 6.
The upgraded detector, with improved position resolution, will allow to extend the search for events also in case when three photons are reconstructed in the EmC and one photon in QCALT, thus strongly reducing the correction for acceptance [26] and the contamination from when some photons hit the detector.
Chapter 2 Simulation tools
In this chapter we will describe tools used for simulations of signals in the EmC. To compute the physical response of the barrel calorimeter we applied the following programs: i) VERTEX GENERATOR which simulates kinematics of the physical reactions ii) FLUKA package which reproduces particle interaction, propagation and a realistic light output in the scintillating fibers, and iii) DIGICLU reconstruction program which simulates the response of photomultipliers and reconstructs energy and time for particles hitting the calorimeter. FLUKA package is mostly used for low energy physic, like: hadronic interactions, medical science, neutrino beam simulation or in dosimetry science. Using FLUKA we can achieve accurate description of the physics processes in the KLOE detector.
1 Vertex generator
In order to enable a fast simulations of the meson decays in the KLOE detector we have prepared a "vertex generator" for simulations of the final state momenta of the decay products111In our group this generator is called jjpluto.. This program is compatible with FLUKA Monte Carlo and simulates decays of meson to channels with , and kaons. It is based on the CERN library procedure GENBOD which generates four-momentum vectors of particles in the final state which are homogenously distributed in the phase space [27]. This tool permits to calculate four-momenta of final state particles in the rest frame of the decaying object. Additionally we implemented an angular distribution () for quanta from the radiative meson decay ( is a vector meson with spin = 1). At present, for the purpose of this work the generator can simulate six below listed reactions:
-
1.
,
-
2.
,
-
3.
,
-
4.
,
-
5.
,
-
6.
.
It is however constructed in a way which enables an easy implementation of any further process.
2 FLUKA - a multi-particle Monte Carlo transport code
This section is based on the informations given in references [29, 32].
FLUKA is a multipurpose transport Monte Carlo code, able to treat hadron-hadron, hadron-nucleus, neutrino, electromagnetic,
and interactions up to 10000 TeV [28].
Also the transport of the charged particles is well recreated (handled in magnetic field too).
This Monte Carlo is based, as far as possible, on orginal and well tested microscopic models. Due to this "microscopic" approach
to hadronic interaction modelling, each step is self-consistent and has well confirmed physical bases [28].
FLUKA can be used in realistic simulations involving following
physical effects:
Hadron inelastic nuclear interactions - are based on resonance production and decay below a few GeV, and above on the Dual Parton
model. FLUKA can also simulate photo-nuclear interactions (described by Vector Meson Dominance, Delta Resonance, Quasi-Deuteron and
Giant Dipole Resonance models) [29].
Elastic Scattering - this process is accomplished with tabulated nucleon-nucleus cross sections. Tabulated are also
phase shift data for pion-proton and for kaon-proton scattering [29]. To this Monte Carlo also parametrised
nucleon-nucleon cross-sections were implemented.
Nucleus-Nucleus interactions - are treated through interfaces to external event generators. From 0.1 to 5 GeV
per nucleon a modified RQMD is used, whereas for higher energies DPMJET generator is applied [30].
Transport of charged hadrons and muons - a code can handle electron backscattering and energy deposition in
thin layers even in the few keV energy range. The energy loss is simulated with Bethe-Bloch theory
with account for spin effects and ionisation fluctuations [29].
Low-energy neutrons - for neutrons with energy lower than 20 MeV, FLUKA uses neutron cross-section library, containing
more than 140 different materials. The transport of these particles is realised by simulation of the standard multigroup
transport with photon and fission neutron generation [29].
Detailed kinematics of elastic scattering on hydrogen nuclei is implemented too.
Electrons - FLUKA uses an original transport algorithm for charged particles, including a complete multiple Coulomb scattering
treatment giving the correct lateral displacement even near boundary. The Landau-Pomeranchuk-Migdal suppression effect
and the Ter-Mikaelyan polarisation effect in the soft part of the bremsstrahlung spectrum are also implemented. Electrons are propagated
taking into account a positron annihilation in flight and Möller scattering effects.
Photons - to reproduce photons physics the following effects were implemented to this Monte Carlo: pair production
with actual angular distribution of electrons and positrons, Rayleight scattering, photon polarisation effect, photo-hadron production,
Compton effect with account for atomic bonds through use of inelastic Hartree-Fock form factors.
Optical photons - generation and transport is based on Cherenkov, Scintillation and Transition Radiation.
Neutrinos and muons -
FLUKA package includes also cosmic ray physics [31] and can simulate muons and neutrinos interactions.
This tool is used for basic research and applied studies in space and atmospheric
flight dosimetry and radiation damage [31]. Interactions are implemented independly of tracking procedures [29].
By default they are tracked without interactions [29].
3 Implementation of the calorimeter material composition in FLUKA
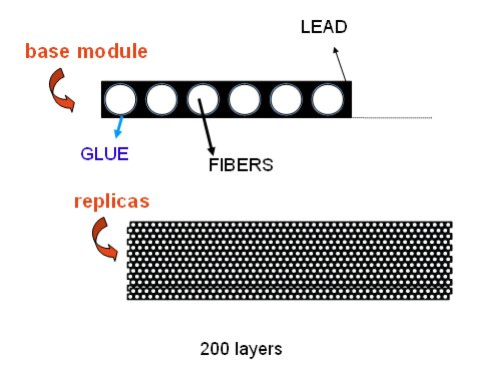
The Monte Carlo code FLUKA is used to determine the position, time and energy of the ionization deposits in the fibers caused by particles hitting the calorimeter. We used the FLUKA "lattice" tool to design the fiber structure of the calorimeter module [32]. In the base module the calorimeter is simulated in detail (see Fig. 1), both under the geometrical point of view and with respect to the used materials.
The calorimeter is built out of lead, plexi and glue [34] which are composed as follows:
-
•
lead compound is made of Pb (95%) and Bi (5%),
-
•
the scintillating fibers are made of Polystyrene (),
-
•
the glue is a mixture of the epoxy resin (, = 1.14 g/cm3) and hardener
( = 0.95 g/cm3) constituting 72% and 28% of the mixture, respectively.
The hardener has been simulated as a mixture of several materials which composition is given in Table 1.
| Compound | formula | fraction |
|---|---|---|
| Polyoxypropylediamine | 90% | |
| Triethanolamine | 7% | |
| Aminoethylpiperazine | 1.5% | |
| Diethylenediamine | 1.5% |
The module consists of two types of scintillating fibers: "Kuraray" and "Pol.hi.tech". The first are implemented until a depth of 12 cm and the remaining part of the module is built with "Pol.hi.tech" fibers [34]. A proper attenuation lenght parameter for fibers material in order to calculate a light intensity at each side of the module was taken into account. The attenuation function of fibers was described with the following formula [34]:
| (1) |
where y is distance between the place of deposited energy and the photocathode.
The attenuation factor B is the ratio between detected and generated light signal which changes as a
function of the distance (on y axis) from the generation point to the photocatode. The value of the
parameters for "Kuraray" and "Pol.hi.tech" are shown in Table 2.
However, it is worth mentioning that, as we will show in the next chapters the data can be also well described using
this formula but with only one exponential function.
| A | cm | cm | |
|---|---|---|---|
| Kuraray | 0.35 | 50 | 430 |
| Pol.hi.tech | 0.35 | 50 | 330 |
The energy deposits are computed by FLUKA [35] taking into account the Birks effect [36] (see equation 2), that is the saturation of the light output (L) of a scintillating material when the energy release is high [35]. For high densities of energy deposition, due to the quenching interactions between the excited molecules along the path of incident particles, the light output is not changing linearly with the energy deposition but instead it can be described as [37, 38, 39, 40]:
4 Implementation of the whole geometry of the barrel calorimeter in FLUKA
FLUKA simulation package is mostly used in low energy physics, for example in:
medical science, dose evaluation, neutriono beam
simulation and for simulations of the low energy hadronic interactions.
Therefore, the program is especially suited for simulations of the response of the
KLOE electromagnetic calorimeter, because at KLOE experiment we deal with particles in the rather
low energy range up to 1 GeV.
The main idea for implementation of the geometry of the KLOE detector with FLUKA
was proposed by Giuseppe Battistoni [44].
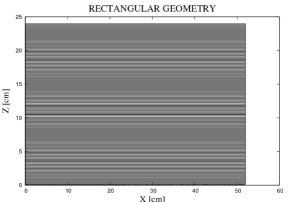
It was first realized for one calorimeter module with rectangular shape222Implementation to FLUKA package was done
by: G. Battistoni, B. Di Micco, A. Ferrari, A. Passeri and V. Patera., with accurate
description of materials.
The base cell with dimensions of 52 cm 1.2 mm 430 cm consists of the lead block filled with 385 scintillating fibers and
glue cylinders.
This cell was replicated 199 times (using FLUKA lattice tool) to build 200 layers forming the calorimeter module
(see left panel in Fig. 2).
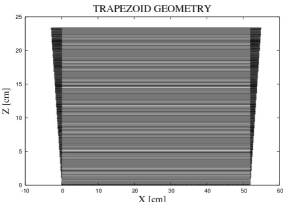
Our first step in the way to implement the whole barrel of electromagnetic calorimeter into FLUKA was the extension of the
rectangular module to the realistic trapezoid shape.
This was achieved by declaration of a new base cell consisting of a scintillating fiber and glue cylinder both inserted into
a small block of lead. The length of the cell is equal to the length of the module (4.3 m) and its cross section
corresponds to the square of 1.2 mm, where the fiber diameter is equal to 1 mm and width of the glue cylinder equals to 0.1 mm.
Then this new base cell was replicated about 4000
times to build two triangular sections on the left and right side of the module.
A complete visualisation of the new trapezoid
geometry333Visualization is based on the FLUKA sources and prepared
using a FLAIR (FLUKA advanced visualization geometry tool) [45].
is shown in Fig. 2.
In order to raise our confidence to the functioning of the programs we have simulated energy deposits in a single calorimeter module for the reaction: . The results of these simulations for 20000 events are shown in Fig. 3.
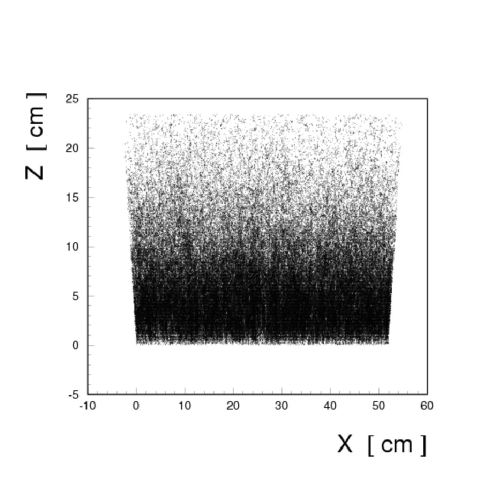
A trapezoid structure which was built with a realistic light output from the
scintillating fibers can be easily recognized. One can also see that as expected the most energy
deposits are observed in the bottom part of the module.
As a next step, it would be natural to replicate 23 times the defined geometry for one module and to build a full
barrel of the electromagnetic calorimeter.
This task was unfortunatelly impossible to realize with present
version of FLUKA444FLUKA 2006 for GNU linux operating system. [32] because this version doesn’t permit
to replicate the
region which had been replicated before. It is due to the fact that the lattice replication on the second
and higher levels is not implemented yet.
This is the reason why geometry was built in another, unfortunatelly much more complicated way.
The barrel was first defined as 24 empty volumes (containers). In one of these volumes we implemented the base cell which described
one layer of lead, fibers and glue. This cell was replicated 199 times in this volume, to build a rectangular section part of the main
trapezoid module (on the top in Fig. 4)555The same idea
was used to build a single module with rectangular shape., and these base cell was replicated 200 times in each of the remaining 23 modules.
Next in the first module we filled the full structure of lead, fibers and glue cylinder in the two triangle areas. These two regions were
then replicated at the corresponding positions in the remaining modules [46].
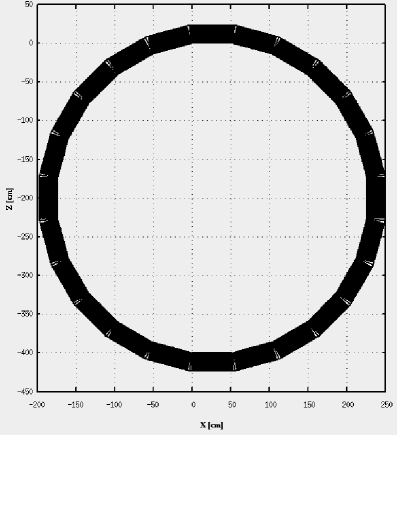
Fig. 4 shows a visualisation of the whole barrel calorimeter geometry made with FLAIR
[45].
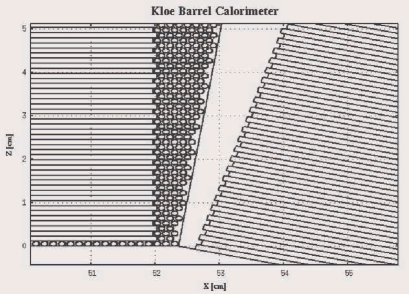
The left panel of the next figure presents
details of the edge area, between base module on the top and the first
replicated area on the right side of it. In the right panel of Fig. 5 the energy deposits in scintillating fibers for this area are
presented for reaction with statistics of 1000 events.
Using this geometry we are able to study in details energy deposits also at the edges of the modules of the calorimeter, where there are small areas without fibers [47, 48].
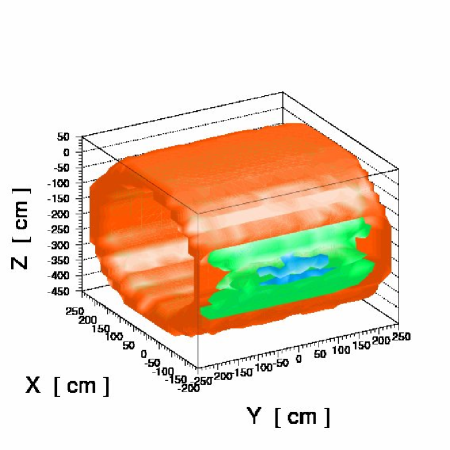
Finally in Fig. 6, as an example of the proper implementation of the geometry we show energy deposits in scintillating fibers in the whole barrel calorimeter.
5 Simulations of the photomultipliers response
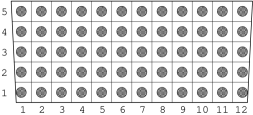
After simulation of energy deposits in scintillating fibers with FLUKA program we calculated amplitude of signals in photomultipliers using DIGICLU program. This program also enables to reconstruct the time, position and energy for all readout segments (cells) of each calorimeter module [11]. Each module is divided into 60 cells which are situated in 5 layers and 12 columns (see Fig. 7). Each cell is read out on both sides by photomultiplers. This segmentation provides the determination of the position of energy deposits in the calorimeter. Altogether, the barrel calorimeter consists of 1440 cells, which are read out by photomultiplayers on two sides (referred to as side A and side B in the following).
For each cell two time signals , (digitized by the Time to Digital Converter (TDC)) and two amplitude signals , (measured by Analog to Digital Converter (ADC)) are recorded. The arrival time and position of the impact point along the fiber direction (the zero being taken at the fiber center) is calculated with the aid of times measured at two ends as:
| (3) | |||||
| (4) |
with , where are the TDC calibration constants, denotes overall time offsets, L stands for length of the cell (cm) and v is the light velocity in fibers (cm/ns). The energy signal is calculated according to the formula:
| (5) |
where are the zero-offsets of the amplitude scale, corresponds to the response for the minimum ionizing particle crossing the calorimeter center and K factor gives the energy scale in MeV, and it is obtained from signals of particles with known energy.
The total energy deposited in a cell is calculated as the mean of values determined at both ends for each cell [11]. The energy read-out has been simulated by including both the generation of photoelectrons with the Poisson distribution and the threshold on the constant fraction discriminator.
6 Description of the KLOE clustering algorithm
As we presented in the previous section the DIGICLU program simulates photomultipliers response and reconstructs energy deposit, position and time for particles passing through each cell. These values are used to recognize groups of cells (clusters) belonging to particles entering the calorimeter. For this aim a clustering algorithm is used [11]. Ideally, to each particle it should assign exactly one cluster but in practice it is not always the case. After the recognision of clusters the program reconstructs the spatial coordinates and time of each shower with high accuracy, needed to reconstruct the decay vertex of the [49]. In particular the algorithm is based on the following steps. First for each cell the position and energy of the shower is reconstructed. Next preclusters are built by connecting the neighboring cells in time and space in order to recreate a full shower [11]. Cells are taken into account in searching of preclusters only if times and energy signals are available on both sides, otherwise these cells in the most cases are added to the already recognized clusters [6]. Subsequently, preclusters are splitted if the spread of the time of the assigned cells is larger than 2.5 ns. On the other hand cells are merged in one cluster if a distance between them and the center of the precluster is less than 20 cm. After this check the groups of cells are defined as clusters which position and time are computed as energy-weighted averages of the contributing cells.
Chapter 3 Adjustment of the detector properties in simulations
In order to simulate a realistic response of photomultipliers we have adjusted parameters used in the programme by comparing the output of simulations to results from the experimental sample of events identified as process.
1 Preparation of the data sample ()
At a first stage, an experimental data sample for the reaction has been extracted [50] applying the kinematic fit procedure to the 3 events with the following conditions:
where, c is the light velocity, denotes the time of each reconstructed cluster and ri stands for the distance from the vertex collision point to the cluster centroid position. and denote the total energy and momentum of the meson, respectively. The first and second condition results from energy and momentum conservation rules. The third requirement ensures that we take events which orginate only from the collision point.
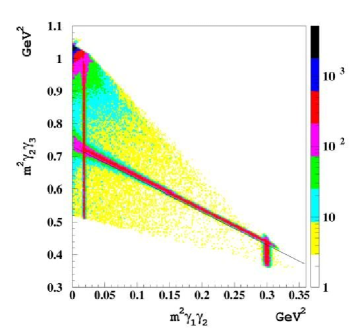
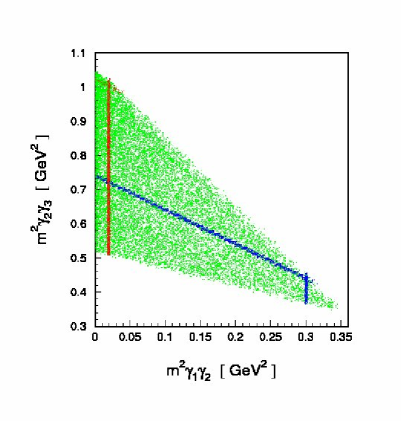
As a next step, the distributions of the square of the invariant mass for pairs of the quanta for process have been constructed. The results are shown in the left panel of Fig. 1. The numbers were assigned to the quanta such that they are ordered according to the increasing energy: . Thus is the photon with the highest energy and with the lowest. The right panel presents results of simulations for the following reactions:
-
1.
,
-
2.
,
-
3.
.
The blue bevel line and the vertical band at the mass squared denote signals from the first reaction.
The channel where meson decays to is described by the red line with value of m equal
to 0.018 GeV2.
And finally the green "triangular" region orginates from reactions where meson decays directly to
3 quanta.
For the further analysis we took all events from the vertical band which are positioned below the red bevel line
(see left panel
in Fig. 1) [50].
2 Determination of the simulation parameters
In this section we describe determination of the attenuation length for the scintillating fibers, determination of the threshold function, and calibration of the ionization deposits in the electromagnetic calorimeter.
1 Estimation of the attenuation length of the scintillating fibers
The first step for estimation of the attenuation length
was the selection of events corresponding to the reaction
and identification of monoenergetic from the radiative decay.
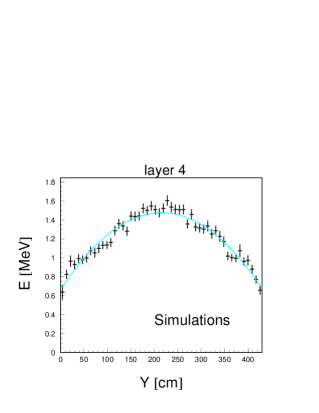
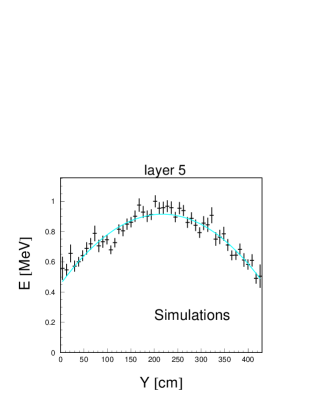
In the next step we simulated the total energy deposited in cells of a given plane as a function of Z coordinate
[51].
We used the following selection cuts:
1. Monochromatic photons (361 < < 365 MeV) from meson decay ,
2. | Z - | < 20 cm .
The first condition guarantees that we take only events with quanta from meson decay directly.
The second condition guarantees that we take only events where the distance between position where quanta
hit the module in simulation
and reconstructed position of the cluster must be less than 20 cm.
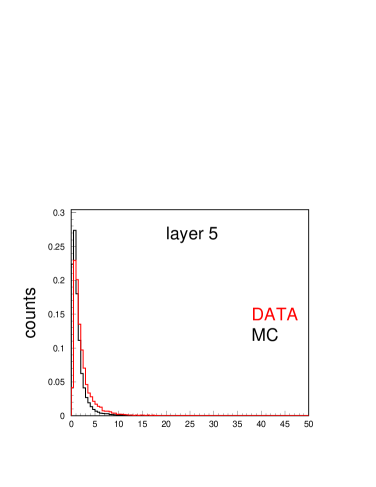
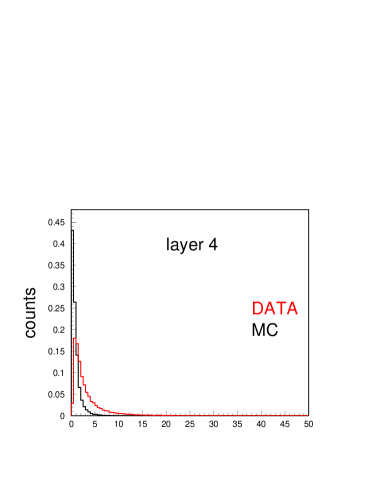
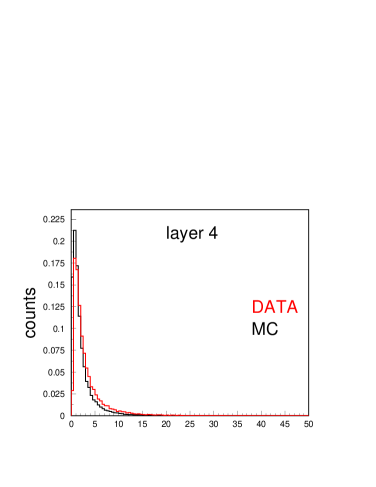
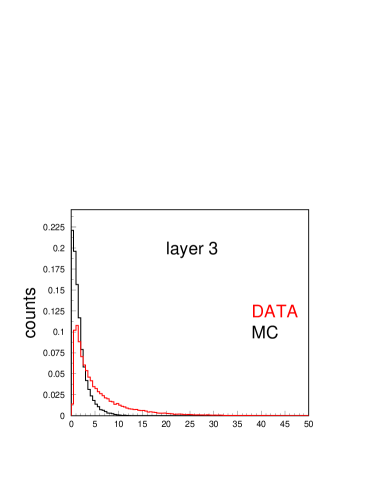
The results for 5 layers are shown in Fig. 2.
One can see that distribution of the average
energy depositions in cells are not uniform, and therefore for the studies of the attenuation length
it is mandatory to divide the experimental data by the Monte Carlo distributions.
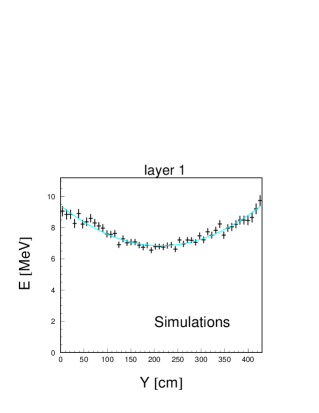
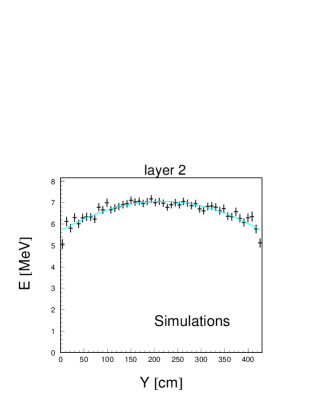
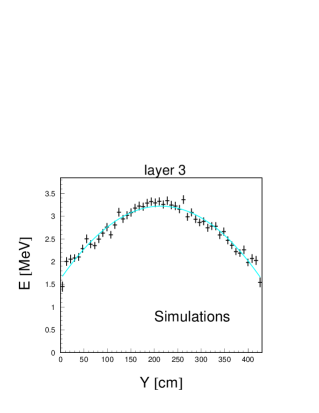
In case of the first layer, which is the nearest one with respect to the collision point, the shape of the energy distribution is mostly related (i) with the angular distributions of the quanta from the decay, (ii) with the changes of the solid angle distribution along the module, and (iii) with the change of the input angle into calorimeter surface. The angular distributions for these particles are presented in Fig. 3.


The angular distribution for quanta from the decay is described with the formula: . Interestingly, Fig. 3 indicates that also quanta from subsequent meson decay have still small contribution in the form of cos. The decrease along the module of the solid angle as seen from the interaction point is shown in Fig. 4.

The variation of the solid angle decrease the events population towards the edges. The third effect which play a role in this context is the angle at which particle hits the detector surface and hence the angle of the shower propagation (see Fig. 5).
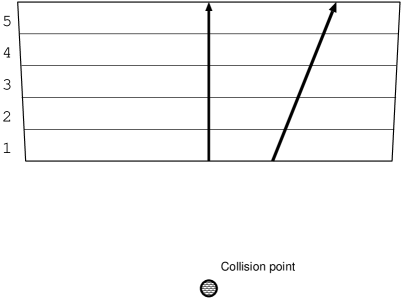
Due to this fact in the first layer the energy deposited by showers in the middle of the module is lower than on the sides.
Therefore, in subsequent layers relatively larger fraction of the energy of the shower will be deposited in the middle of the module
and less on its sides. Hence, the shapes of distributions observed in Fig. 2 is determined by three discussed effects:
angular distribution of quanta, changes of the solid angle, and variation of the fractional length of the showers in the
layers as a function of the impact angle.
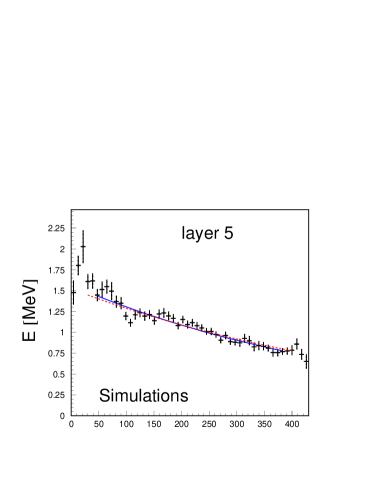
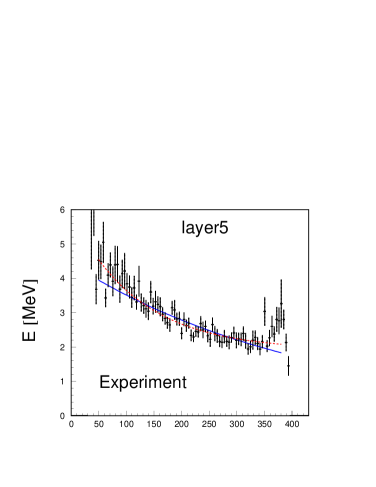
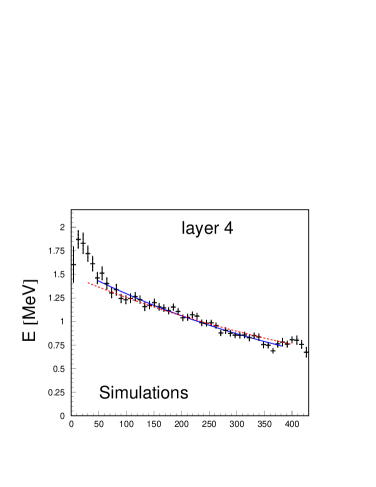
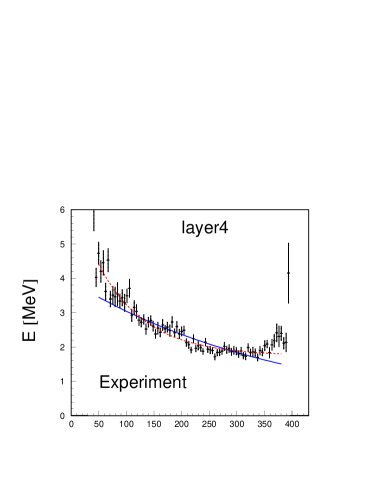
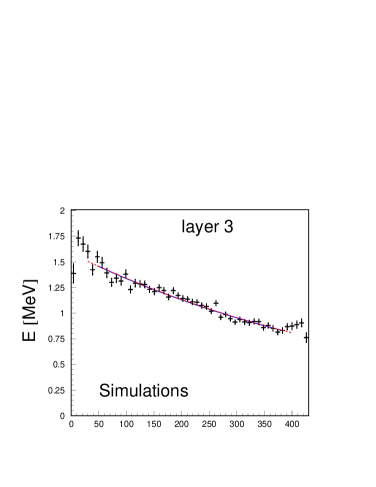
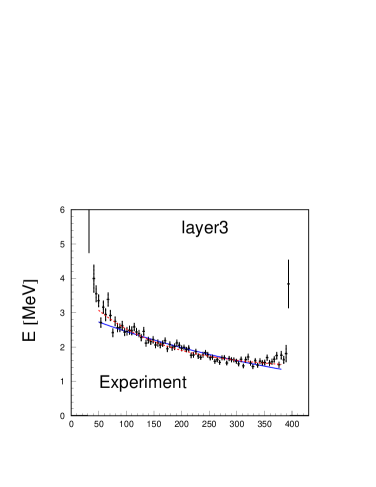
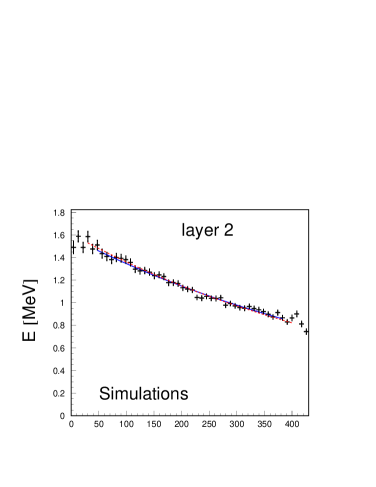
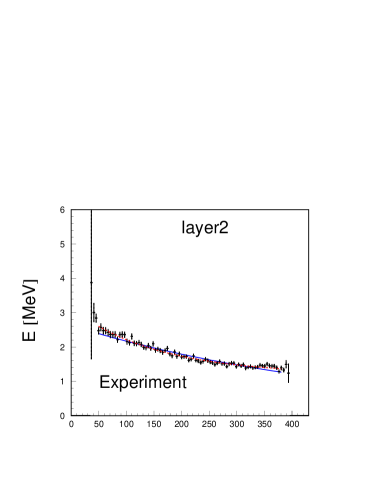
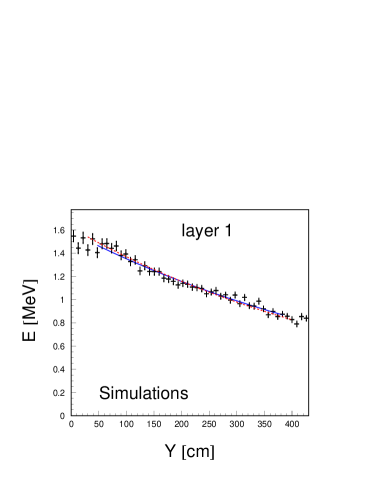
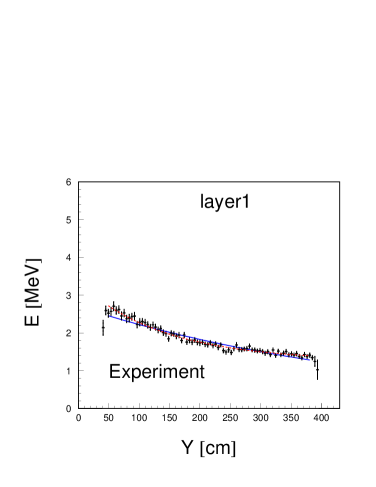
In order to achieve a uniform, energy deposition along the module a simulated energy deposit distributions (Fig. 2) were fit with second order polynominal functions which were then used to normalize the experimental spectra and for the check also simulated spectra were normalized in the same way. Fig. 6 presents an energy of signals registered at one side of the module as a function of the distance between the edge of the module and the hit position. In order to establish a value of the light attenuation length () we fit to the spectra from Fig. 6 (right column) an exponential function:
| (2) |
with and being a free parameters [54].
The result of the fit is shown as dark blue, continuous line in Fig. 6 (right column).
The weighted averages of attenuation length determined at both sides (A and B) amounts to 5227 cm and 4079 cm, for
1,2,3 layers and for 4,5 layers, respectively.
The result is shown as a red, dashed curve in Fig. 6 (right).
As a next step the determined attenuation length were used to simulate the light output
at the edges of the module with the DIGICLU program. The result is shown in Fig. 6 (left).
These studies were made to check if results from simulations are in agreement with results which were achieved
from the experimental data sample.
The code of the lines is the same as in the right panel.
The simulated and experimental spectra are in very good agreement except a region below 50 cm and above 400 cm.
This is due to the fact that this part of the barrel is situated behind the endcap modules. And in the simulations presented
in this thesis only a barrel part of the calorimeter is taken into account.
Furthermore we tested also a fit with a function with two attenuations lengths [34]:
| (3) |
The result is presented in Fig. 6 where left column indicates results from simulations and right column shows experimental data. As one can see both presented fits describe the data well.
2 Parametrization of the energy threshold function
In the experiment the signals which amplitude is lower than a given threshold are not read by the TDC board and information about their times is missing. In order to account for this effect in simulations the threshold curve was determined using the ratio between the number of cells with time information over all cells as a function of the cell energy. This ratio is shown in Fig. 7.
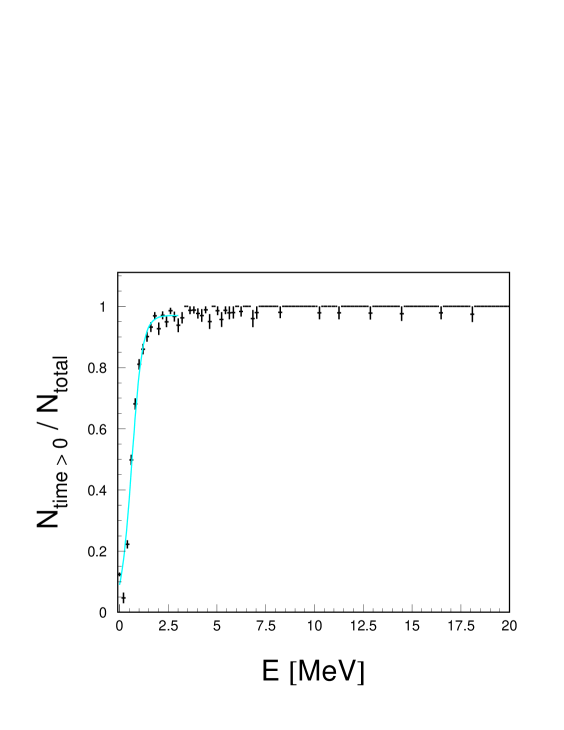
One can see that the distribution is not a step-like function but rather a smooth increase of the ratio in the range from 0 to 2 MeV is observed. The shape of this increase can be described by the Fermi-Dirac distribution [55, 52, 53]:
| (4) |
with free parameters and . A fit for the range of energy near the threshold resulted in the following values:
3 Calibration of the ionization deposits
The next step in the tuning of the simulation program is the adjustment of the absolute scale of the energetic response of the calorimeter. For this purpose we compared results of simulations with experimental distribution of energy deposits in the calorimeter module. The results for five layers are shown in Fig. 8 (left column).
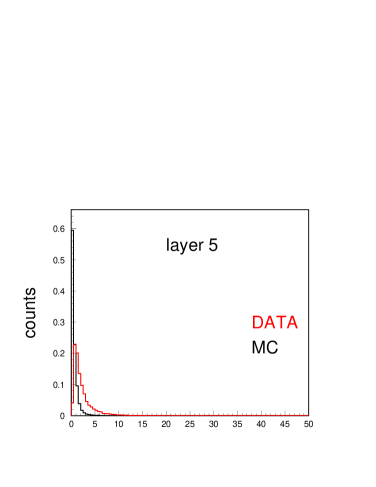
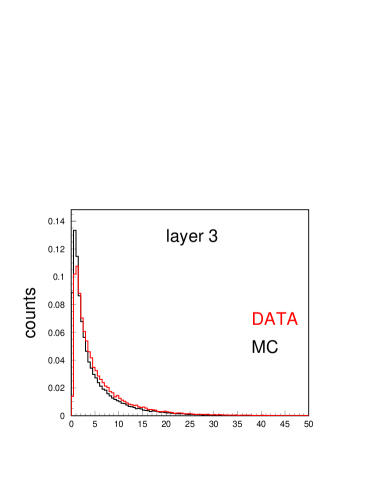
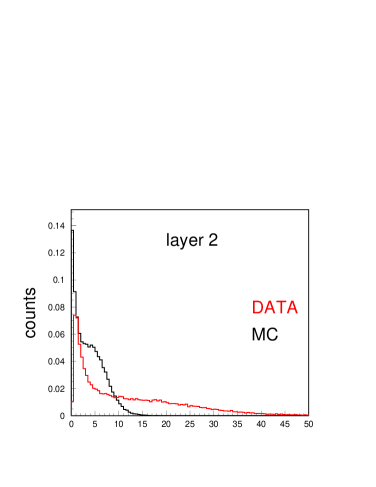
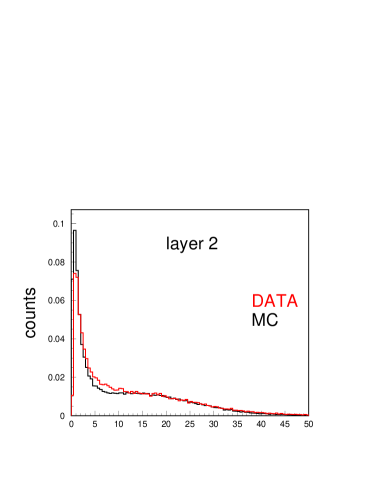
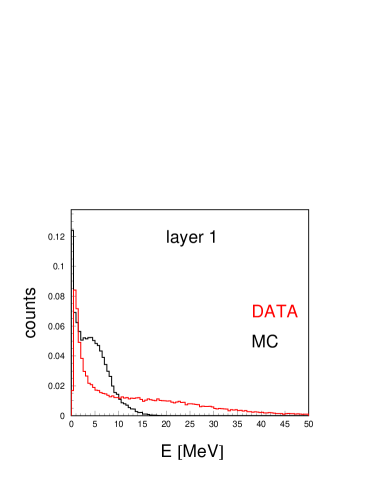
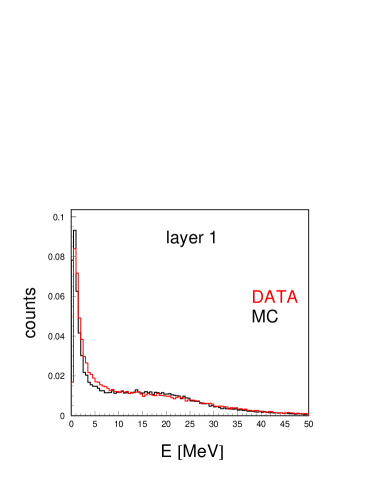
One sees that the energy deposits reconstructed for simulated events are much smaller then for the experimental data.
In order to correct this discrepancy, the simulated values of energy deposits were multiplied by the factor of 3.74.
The shape of the corrected spectra is in a very good agreement with experimental distributions for each layer (Fig. 8 right).
Next, correction was needed because the clustering algorithm not always is able to reconstruct
the entire energy deposited in the clusters. That’s why sum of energy deposits which were simulated is greater than sum
of energy in reconstructed clusters. For this case a linearity correction was needed and it was obtained with
requiring straight line with slope 1 (blue line in Fig. 9).
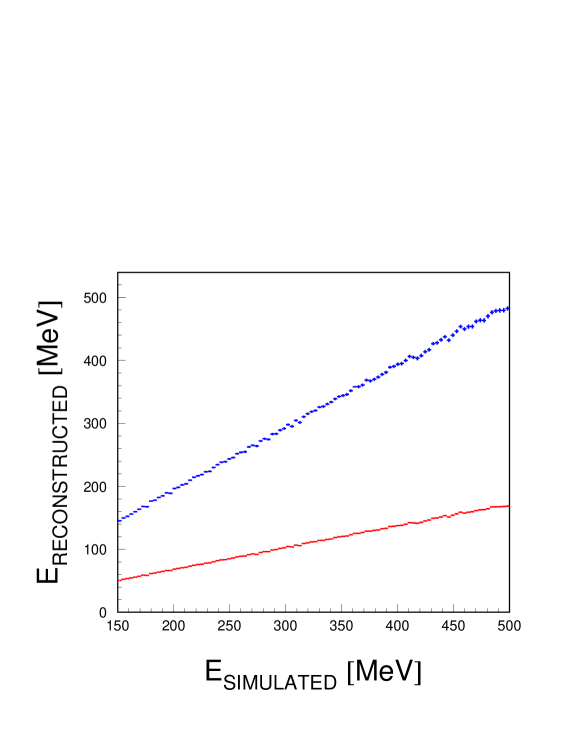
The red curve represents the situation before calibration (slope parameter is not equal 1) and blue after. Applying the corrections described in this section we achieved very good agreement between data and simulations of energy response of the calorimeter when using FLUKA and DIGICLU procedures [54].
Chapter 4 Estimations of background due to the merging and splitting of photon clusters
The main motivation of this work is the estimation of merging and splitting effects for reactions like e.g. or which may constitue background in studies of the and reactions, respectively. In Table 1 we present a Branching Ratios (BR) for the main investigated reactions and for the background channels.
| Main Decay | BR (%) | Background Channel | BR (%) | Effect |
|---|---|---|---|---|
| (4.4 1.6) | (32.51 0.28) | merging | ||
| < 1.2 | (30.69 0.05) | splitting | ||
| (8.69 0.04) | (19.56 0.14) | merging |
In this Table one can see that all the background reactions have much bigger BR (many orders of magnitude) than the investigated channels. Therefore, even small merging and splitting effects may obscure considerably observation of signals from , or decays.
1 Merging of clusters from as a background for the channel
The example of the merging effect, inducing a wrong cluster counting, comes from analysis of the events [6]. The Branching Ratio (BR) for is by several orders of magnitude more frequent than (see Table 1).
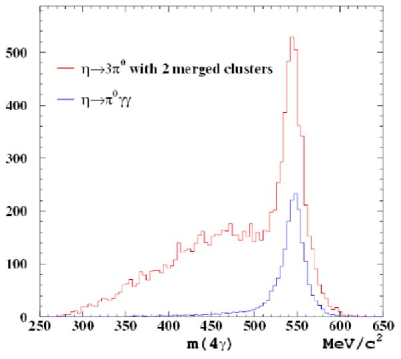
In Fig. 1 a consequence of the merging of clusters is presented for the case
when 6 quanta from 3 decay were reconstructed as 4 clusters.
In this case the topology of becomes equal to that of the reaction.
And as a result on 4 invariant mass distribution one can see a big peak from background channel exactly at the mass
of the meson [3].
The next very interesting example of reactions for which problems with merging of
clusters is significant and which can be studied with the KLOE
calorimeter [11] is CP violating decay . An example of such
event is presented in Fig. 2.
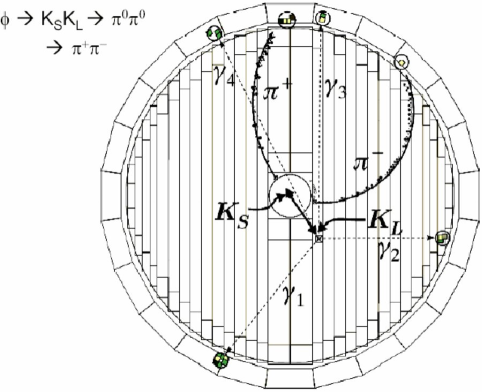
The meson decays into near the collission point. The meson
decays into and then these pions decaying through electromagnetic interaction
to 4 quanta. Those four photons are detected by the EmC.
Thus with two merged clusters may obscure a signal from the
reaction.
Implementation of the full barrel geometry into the FLUKA program allowed us to study the effect of merging and splitting quantitatively. And hereafter we will present the results for the reconstruction of clusters from the and in view of the merging and splitting which estimation is crucial for the study of the and decays.

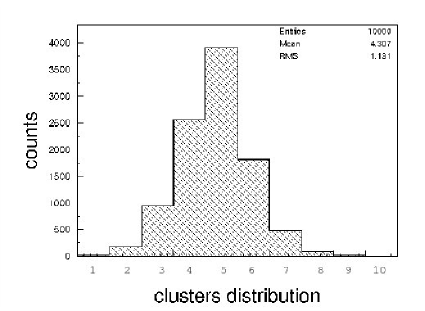
The Fig. 3 shows a distribution of the total number of cells which given signal. Whereas distribution of the total number of preclusters and the total number of reconstructed clusters are presented in the next Figure.
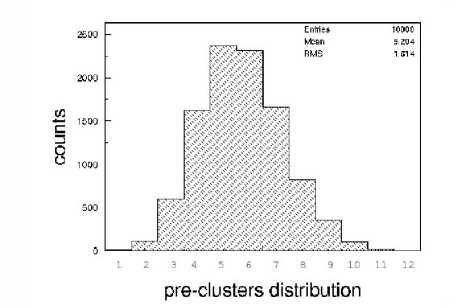
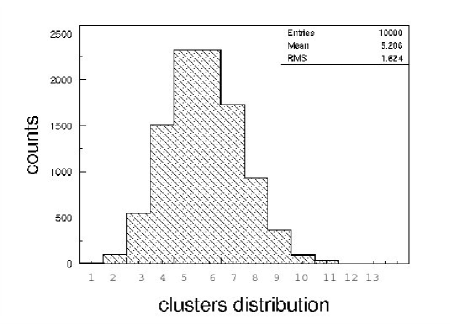
The reconstruction possibilities of the clustering algorithm
are presented in Fig. 4.
One can see that the most
probably the clustering algorithm reconstructs 5 or 6 clusters even though 7 photons had hit the detector.
The frequencies of reconstructed clusters are presented in
Table 2.
| Number of reconstructed | Frequency for | Frequency for |
|---|---|---|
| preclusters and clusters | preclusters (%) | clusters (%) |
| 1 | 0.12 | 0.12 |
| 2 | 1.11 | 1.02 |
| 3 | 5.99 | 5.50 |
| 4 | 16.22 | 15.13 |
| 5 | 23.70 | 23.23 |
| 6 | 23.09 | 23.26 |
| 7 | 16.60 | 17.27 |
| 8 | 8.25 | 9.35 |
| 9 | 3.59 | 3.71 |
| 10 | 1.06 | 0.97 |
| 11 | 0.22 | 0.36 |
| 12 | 0.27 | 0.05 |
| 13 | 0.00 | 0.03 |
One can see that the topology of this channel could be interpreted both with 4 quanta (15.13%) as well as with 6 photons (23.26%). In the first case this channel could constitute a background for reaction (merging effect).
2 Splitting of clusters for as a background for
Splitting is related with the features of the EmC detector and with reconstruction possibilities of the KLOE clustering algorithm which not always
correctly reconstructs positions and energies of particles interacting with detector
material and may assign more then one cluster to signals induced by a single particle.
Fig. 5
shows that data with 6 quanta in the final state gives in most cases much lower
when fit under the hypothesis of 2 then for the 3 hypothesis whereas for a real
6 events originating from the decay one expects
to be small and to be large as it is seen in the sample of the MC
data (Fig. 5).
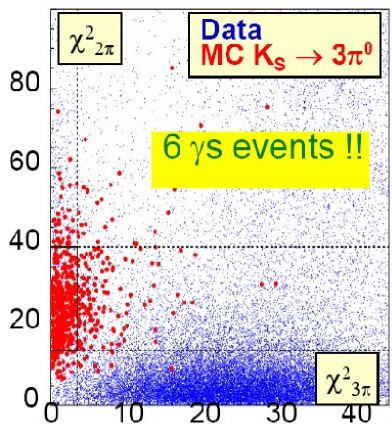
Therefore, the decay with two splitted clusters gives the same event topology as expected for the reaction. We investigated reaction with condition that all four quanta hit the barrel calorimeter. We performed approximation that KS meson decays exactly in the collision point. However, we suppose that this approximation hasn’t significant influence on the results because a distance between collision point and hit position at calorimeter surface is at least 2 meters. We present the distribution of the active cells in Fig. 6.

We also investigated the distribution of pre-clusters and clusters for this channel (Fig. 7). One can see that in 18.08% a clustering algorithm reconstructed 6 quanta. Therefore for this case the topology of investigated channel with 6 reconstructed photons (two splitted clusters) is the same as for K reaction and it constitute a background for this decay.
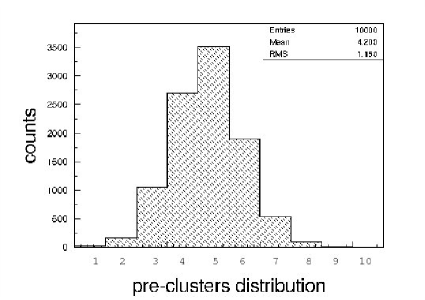
The fractions of numbers of reconstructed clusters are presented in the Tab. 3.
| Number of reconstructed | Frequency for | Frequency for |
|---|---|---|
| preclusters and clusters | preclusters (%) | clusters (%) |
| 1 | 0.26 | 0.26 |
| 2 | 1.70 | 1.72 |
| 3 | 10.47 | 9.38 |
| 4 | 26.97 | 25.59 |
| 5 | 35.23 | 39.05 |
| 6 | 18.94 | 18.08 |
| 7 | 5.42 | 4.84 |
| 8 | 0.94 | 0.86 |
| 9 | 0.06 | 0.21 |
| 10 | 0.01 | 0.01 |
One can see that correct reconstruction of four clusters constitutes only about 26% of total number of events.
Both merging and splitting effects could be reduced by the better shower shape reconstruction induced
by a finer read-out granularity. But also the identification of particles based on the shower shape analysis
would greatly take advantage of an increase in the calorimeter granuality [3].
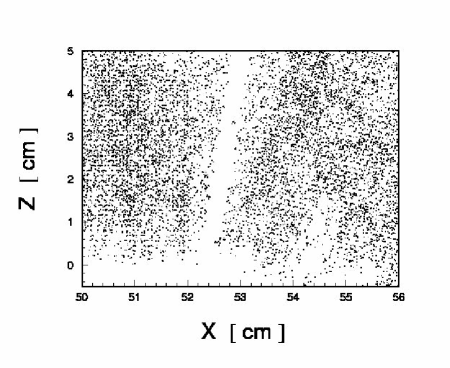
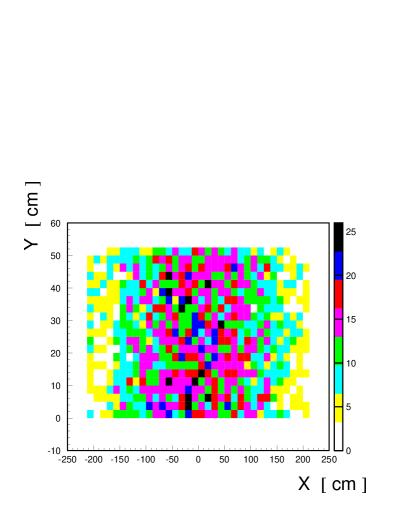
3 Reconstruction efficiency with the KLOE clustering algorithm
In order to estimate the
reconstruction efficiency of the present KLOE clustering algorithm we
investigated detector response for two quanta with momentum of 500 MeV/c.
The response was generated as a function of the distance between the quanta.
Subsequently we have reconstructed a total
number of clusters which were
recognized by clustering algorithm.
The two investigated situations are
shown in Fig. 8 and in Fig. 9.
In the first case the distance between photons on x axis is 0 cm and the distance on y axis
was varried between 0 and 200 cm.
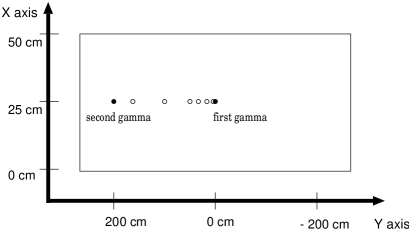 Figure 8: Hit positions of quanta for X = 0 cm.
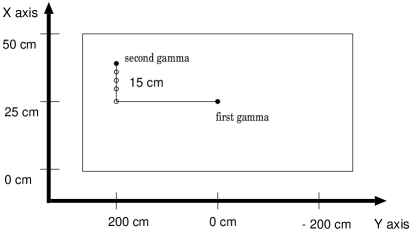 Figure 9: Hit positions of quanta for Y = 200 cm.
If the reconstruction efficiency of the KLOE algorithm was 100%, this algorithm would always reconstruct two clusters which we interpret as two photons which hit the module. But results of simulations show (see Fig. 11 and Fig. 10) that reconstruction efficiency is changing as a function of distance between these two particles.
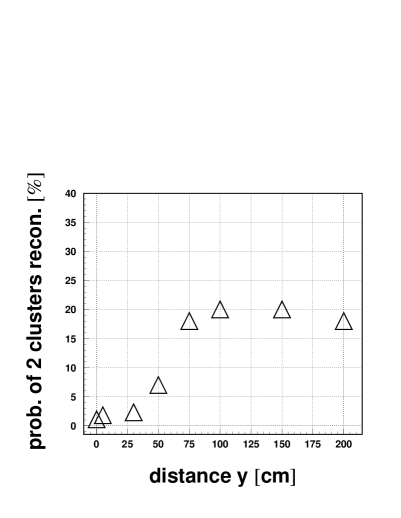 Figure 10: The efficiency of the two clusters reconstruction as a function of the distance along y axis provided that x coordinate for both photons
was the same.
Figure 10: The efficiency of the two clusters reconstruction as a function of the distance along y axis provided that x coordinate for both photons
was the same.
 Figure 11: The efficiency of the two clusters reconstruction as a function of the distance between photons along the x axis.
As expected the reconstruction efficiency is increasing with increasing distance between two quanta. This result shows that the biggest problem with reconstruction is in the case when particles hit with the small difference in the x coordinate.
4 Reconstruction efficiency as a function of the photocathode quantum efficiency
We have performed investigations of the influence of the quantum efficiency of the photocatode on the merging and splitting effects. We carried out our simulations using a vertex generator for reactions: and . Then we simulated the calorimeter response using FLUKA program, reconstructed PM response by means of the DIGICLU procedure and finally reconstructed clusters by means of the present KLOE clusterisation algorithm. The studies presented in this section were performed for one module only. The efficiency is defined by the following formula:
| (1) |
where: N is the total number of events with a condition in parenthesis. This condition assures that we take events for which the module was hit by at least one .
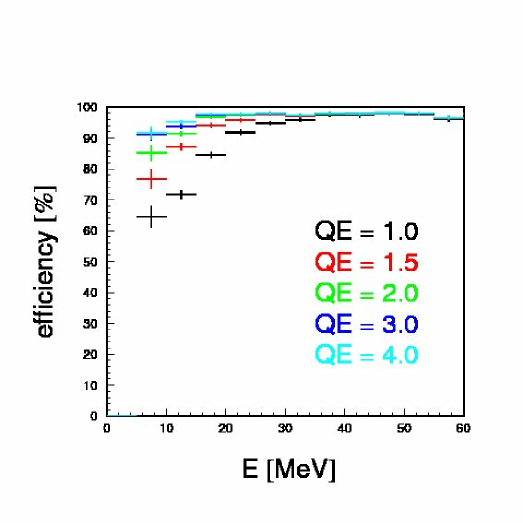
The results of simulations for the single calorimeter module are shown in Fig. 12. We have studied [54] the reconstruction efficiency as a function of the energy in the cluster for five values of the quantum efficiency as depicted inside the Figure. QE = 1 represents results for a present quantum efficiency of photomultipliers used at KLOE, amounting to 23% [51, 60]. Remaining values of QE indicates a factors by which the efficiency was increased in our investigations. From these studies one can see that as expected with the increasing value of the quantum efficiency for photomultipliers the efficiency of reconstruction is increasing too.
5 Merging and splitting probabilities as a function of the quantum efficiency
Subsequently, we determinated the influence of value of the quantum efficiency on the magnitude of the merging and splitting effects. The results of these simulations are shown in Fig. 13.
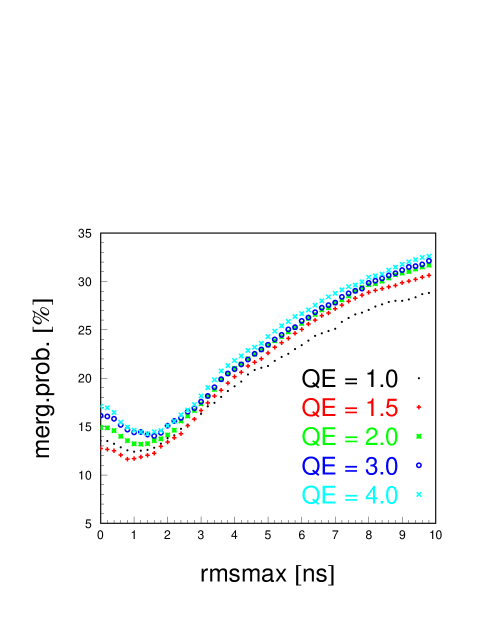
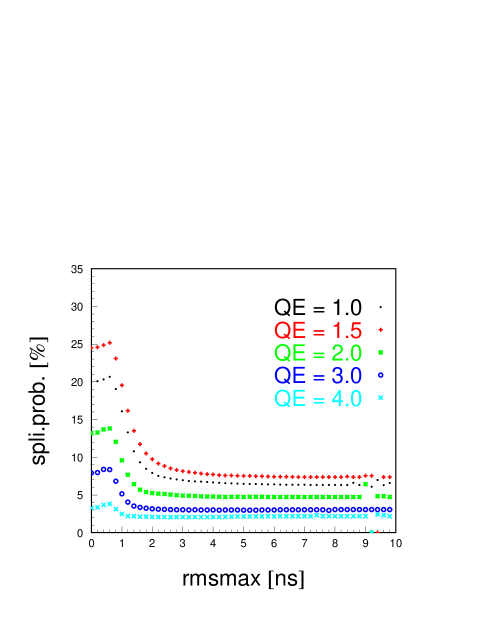
The merging probability was defined according to the following formula:
| (2) |
and the splitting probability was defined as:
| (3) |
Fig. 13 shows that the splitting probability increase with increasing of the quantum efficiency of photomultipliers [54] but one can see that merging effect is much less sensitive to the changing of the quantum efficiency.
Chapter 5 Conclusions
We have built a full simulation of the Barrel Calorimeter of the KLOE detector with FLUKA Monte Carlo package.
This implementation of the geometry was used for simulations of the physical energy response of the calorimeter. The Monte Carlo
cooperates with vertex generator which reproduces kinematics of the physical reactions.
We estimated influence of merging and splitting of clusters for reconstruction possibilities of the particles
on the whole barrel calorimeter with a present clustering algorithm. In particular we estimated these effects as a function of the
quantum efficiency of photomultipliers [54].
As a results we found that increase of the quantum efficiency does not improve significantly the cluster reconstruction in view
of merging and splitting effects.
The prepared program with geometry of the 24 modules of the barrel calorimeter enables fast simulations of a choosen reaction channel
and facilitates studies of the detector response to different reactions separately.
This geometry may be used to test response of photomultipliers with higher granularity of cells,
especially for testing performances of the multianode photomultiplier.
Implemented geometry of the barrel calorimeter in FLUKA reproduces the merging and the splitting effects,
and permits also to study the efficiency of clusterisation algorithm
at the edges of the modules in the barrel calorimeter.
These all usefull options come out from the fact that the smallest parts of detector
(the fibers structure) were realistically implemented in FLUKA Monte Carlo.
We investigated a shapes of peaks for time distribution of reconstruction of clusters, the shapes are changing as a function
of distance between photons. This information could be very useful for the upgrade of the clustering
algorithm [61].
We estimated also the influence of merging and splitting of clusters for
and
reactions. The studies were made determining the response of the
whole barrel calorimeter with DIGICLU program.
Finally, it is worth mentioning that our study encouraged the authors of the FLUKA to upgrade the program
and in the near future a new version permitting to
replicate the cells more than once will be available.
Chapter 6 Kinematic fit procedure
The kinematic fit procedure is used to correct measured quantities () in case of redundancy in the measured set of variables. In most cases is normal distributed around with standard deviation .
| (1) |
where is a average of the all xi values. Variables could be constrained by some physical law (in our investigations by energy and momentum conservation) in this case they must satisfy k equations, which can in general be written in the form:
| (3) |
The main purpose of using fit procedure is to find a new approximation () of value by minimizing the quantity:
| (4) |
and imposing the (3) constraints on . This purpose can be achieved using langrangian multipliers method, that consists of minimizing the quantity:
| (5) |
related with the variables and [6].
To minimize a value an iterative procedure is needed to be used.
The detailed description of the distribution can be found e.g. in [56].
Chapter 7 Monte Carlo Methods
Monte Carlo simulations are methods of solving numerical assignments with the aid of adequate constructed statistical computations.
They are frequently used in experimental and theoretical physic [57].
Although computer memory and processor
performance have increased dramatically over the last two decades, many physical problems are too complicated to be solved
without approximations of the physics processes, quite apart from the approximations inherent in any numerical method. Therefore,
most calculations done in computational physics involve some degree of approximation [58].
Solving a physical problem often requires to solve an ordinary or partial differential equation. This is the case in for example
classical mechanics, electrodynamics, quantum mechanics and fluid dynamics. On the other hand in statistical physics we must calculate
sums or integrals over large numbers of degrees of freedom.
Whatever type of problem we try to solve, it is only in very few cases that analytical solutions are possible.
In most cases we therefore resort to numerical calculations to obtain useful results [58].
These methods are used in physic for the last sixty years [57].
Chapter 8 Energy distributions for quanta
We have investigated111We used the BXDRAW subroutine in this investigations [32]. the distribution of the energy and the position of the quanta on the bottom surface of a single calorimeter module. We performed simulations for reactions: and . The result is presented in Fig. 1 in upper and lower panel, respectively.


In the left column in Fig. 1, one can see hit distributions for particles entering the module. In the right panels in this figure the sharp signals orginate from a monenergetic quanta from meson decay with energy equal to 363 MeV. In the case of the reaction we observe more events at the lower energy range. These signals orginate from quanta from meson decays. As a further example in Fig. 2 we present energy spectra separately for the radiative photon and for the photon from the and pion decays.


In the left panel the monoenergetic signal for photon from meson decay is shown. The middle panel presents energy distribution for photons from the meson decay and the third panel presents the energy distribution for quanta from mesons decays.
Chapter 9 Time distribution for single and multi-gamma hits
In this appendix we investigated distributions of the sum and difference of times of light signals from the sides of the module. Our studies show that distributions are changing as a function of the distance between quanta hitting the module. This information could be used to improve efficiency of the KLOE clustering algorithm in the near future [61]. In Fig. 1 result for the situation where one quanta hit in the middle of the calorimeter module is presented. One can see only one peak for both difference and sum of time of signals from sides A and B.


For the two quanta which hit the surface111Two studing cases of hit positions of photons entering the calorimeter surface are presented in Fig. 8 and Fig. 9. Positions of quanta are marked as black circles. at the same x but different y the result is different (see Fig. 2). One can see that distribution of difference of times for signals from side A and B consists of three separated peaks and the distribution of the sum of times from sides A and B shows two maxima.


Next we investigated the situation where distance on x axis between two quanta is equal to 15 cm. In this case we observe only one maximum in the distribution of the sum and two maxima in the distribution of the difference of times (Fig. 3).


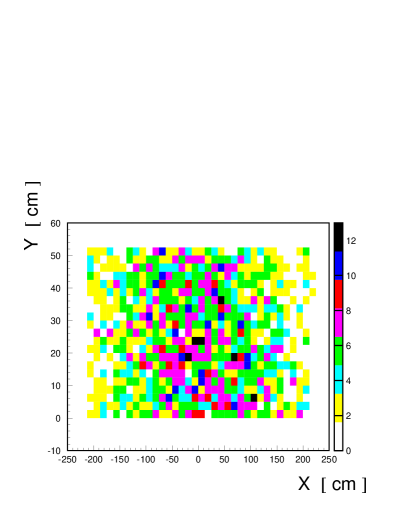
In the following we present an example of results of cell distributions simulated for several distances on x axis between places where photons hit the module and for several angle between a surface and a photon direction. The results of the sum of energy deposited in cells for side A and B we present using a displayer program222This program written in a Fortran code [54] is based on the CERN library tool [62].. Fig. 4 presents a photomultipliers energetic response for one quanta which hit the middle of the module at an angle of 90 degrees.
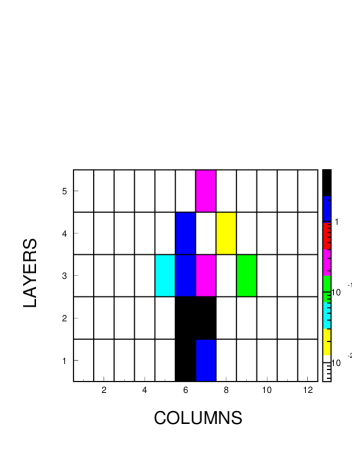 Figure 4: Distribution of cells for one quantum hitting with 90 degrees in the middle of the module.
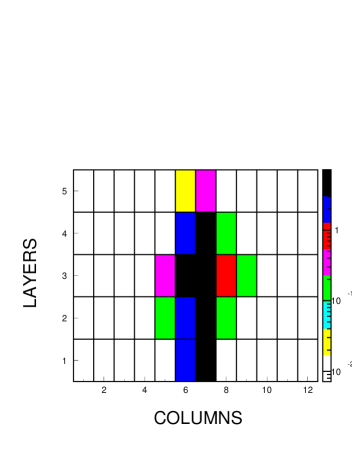 Figure 5: Distribution of cells for two quanta hitting with 90 degrees with a distance on y axis equal to 200 cm and with the same
coordinate on x axis.
Figure 5: Distribution of cells for two quanta hitting with 90 degrees with a distance on y axis equal to 200 cm and with the same
coordinate on x axis.
Comparing this result with the case (see Fig. 5) where two quanta hit the module at a distance on y axis equal to 200 cm but with the same x coordinate, we can see that it is not possible to distinguish these two situations due to the fact that the second case can be interpreted for example as one particle which hit the module but with higher energy. However, we can easily identify two particle events when a distance on the x axis between hit positions is larger than 15 cm (see also Fig. 11). In Fig. 7 a distribution for the case when the distance between two photons was equal to 25 cm is presented.
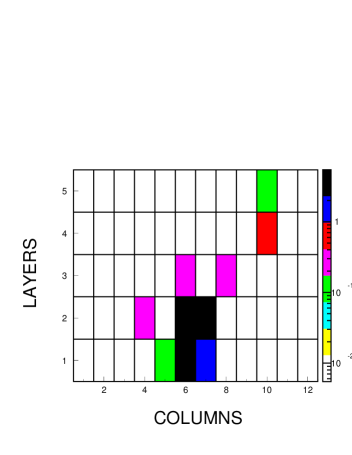 Figure 6: The distribution of cells for one quantum hitting the module with the angle equal to 30 degrees with respect to the surface.
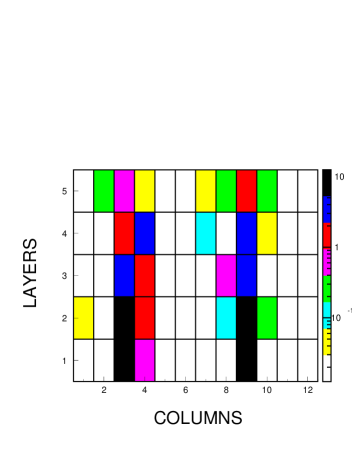 Figure 7: The distribution of cells for two quanta hitting the module with 25 cm distance along x axis.
We simulated also a situation where photon hit the module with the angle equal to 30 degrees (see Fig. 6) with respect to the surface. One can see two cells on the right side on this plot which aren’t connected to the main cluster. It is worth to mention that such distributions may be interpreted as two hits.
Chapter 10 Estimation of probability for multi-gamma hits at a single calorimeter module
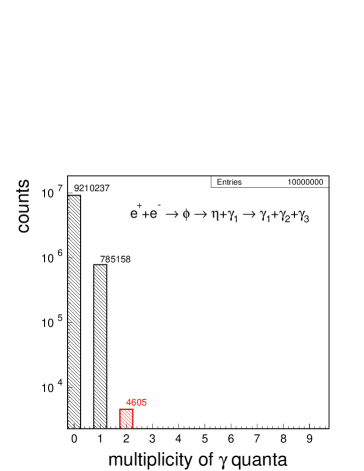
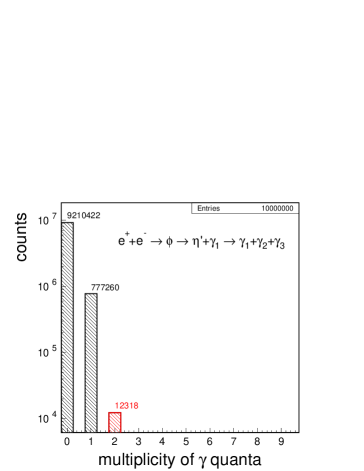
Using FLUKA Monte Carlo with vertex generator we were able to estimate a probability on the multi-gamma hits at calorimeter module orginating from the meson decays. We estimated a multiplicity of the quanta on one module of the KLOE calorimeter. By multiplicity we define the number of quanta hitting one module (Fig. 1).

If it is equal to zero, it signifies that our tested
module did not seen any , if it is equal to one than the module
registered one gamma quantum. Due to the axial symmetry of KLOE
this result is valid for all detection modules.
Thus, we see that for the reaction
only for 0.6% of the total number of events the 2 quanta hit one module and in the rest 99.4%
only one is registered by one module.
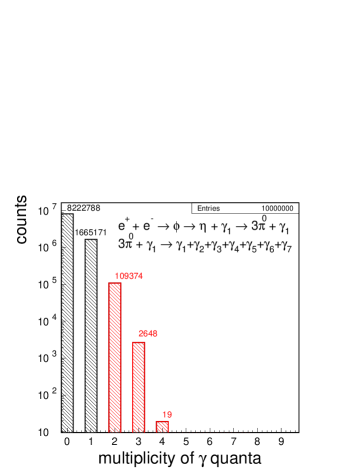
However, for the reaction where meson decays into 3
the situation changes drastically and already in 6.3% cases there is two
or more quanta hitting the module.
In the situation where more than one photon hit the calorimeter module it is possible that merging effect
will appear for some distances between hit positions of particles on the surface. The estimations of the order
of multiplicity effect was shown in Fig. 11 and
Fig. 10.
In the following we will describe the distribution of the distance
between the quanta in the case when two hits the module.
This result is relevant in view of the reconstruction possibilities of the clustering algorithm
(see Fig. 11 and
Fig. 10).
The result for the is shown in Fig. 2.
The corresponding reactions are
written inside the figures.


And the result for the is shown in Fig. 3. The distribution determined for the is not very intuitive. The maximum at 1.7 m is due to the fact that the pions from the decay are very fast and both quanta from one pion can hit one module. The pion decays immediately in the target and the distance between the two quanta from its decay at the calorimeter surface is indeed around 1.7 m.


We did also one more check by decreasing in the simulations the mass of the pion to 10 MeV. In such a case these "pions" are much faster and the laboratory angle between gamma quanta is decreasing significantly, and the distance between them in the calorimeter is as expected to be much smaller. The result of this simulation is shown in Fig. 4.
Chapter 11 Example of the event reconstruction for reaction
The capabilites of the prepared program to reproduce a merging and splitting effects in light output from scintilating fibers are ilustrated in Fig. 1.

One can see seven significant energy deposits belonging to 7 photons from the
reaction, and also some small deposits
of energy which don’t orginate directly from photons are well seen.
The splitted energy deposits may cause reconstruction of the false clusters.
On the other hand
two very close tracks of photons
(near z = -250 cm) may be reconstructed as one merged cluster since the distance
between particles is only about 4 cm, leading with a large probability to false reconstruction (see Fig. 1).
After simulating the energy response of the scintillating fibers, on 24 modules with FLUKA, we extended appropriately the DIGICLU program
in order to perform reconstruction of signals from photomultipliers on the whole barrel calorimeter.
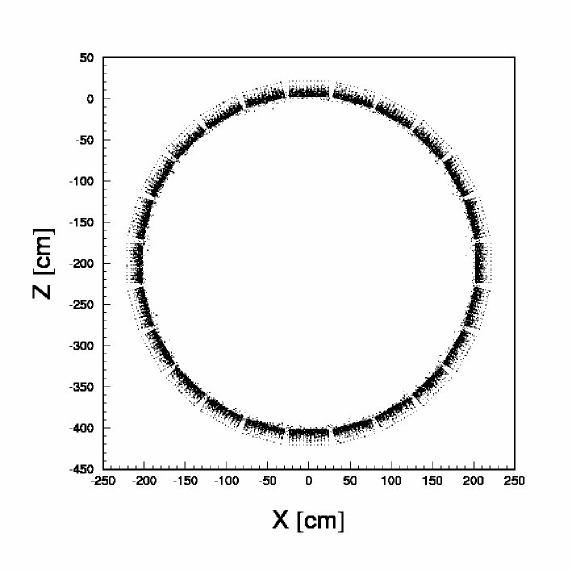
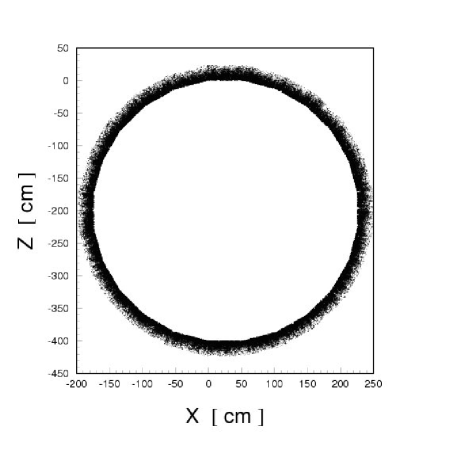
Fig. 2 presents distribution of reconstructed clusters on the barrel part of the calorimeter for the 1000 events simulated with vertex generator and FLUKA program. One can see that the clusters aren’t reconstructed on the edges of modules.
Chapter 12 Energy deposition as a function of azimuthal angle
We studied energy deposits in scintillating fibers as a function of the azimuthal angle of quanta producted in the interaction region. The results for the upper part of barrel calorimeter is shown in Fig. 1.
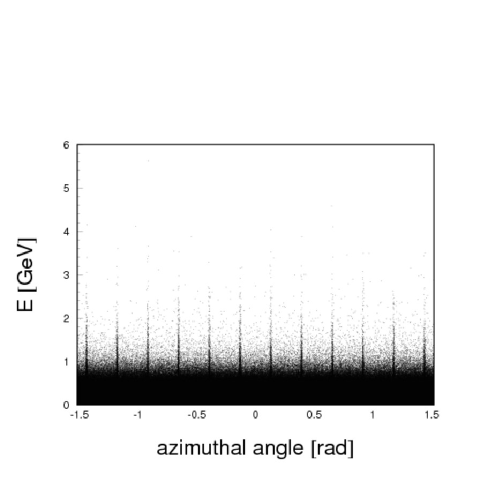

One can see that at the edges of the module a maximum of the energy deposits appears. To some extent it may be explained by the fact that on the edges the value of the solid angle for the same angle interval is larger than in the middle (see Fig. 2).
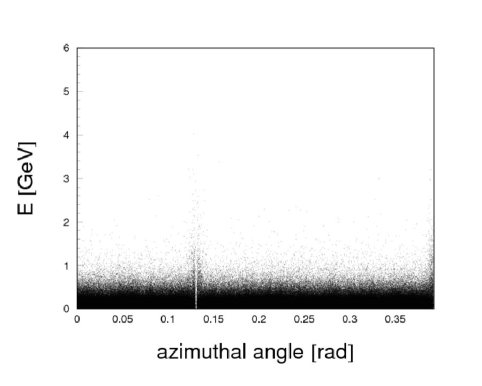
In the simulations we did not include fibers which were near the edge since in a real detector the trapezoid shape of the module was acomplished by cutting some parts from rectangular piece [11] and hence the scintillating fibers at the sides were broken. In Fig. 3 one can see that for value of an angle around 0.15 rad particles didn’t deposited energy. This is because this position is exactly between the edge of the first and second trapezoid modules.
Chapter 13 Definition of the coordinate system
The coordinate systems which were used in simulations are shown in Fig. 1. The blue axis denote the frame which was used for simulations with FLUKA and with the VERTEX GENERATOR. The red coordinate system which is the same as coordinate frame of the KLOE detector has been used in simulations of clusterization effects and simulations of the photomultipliers response with DIGICLU111Digiclu frame is called the reconstruction geometry system..
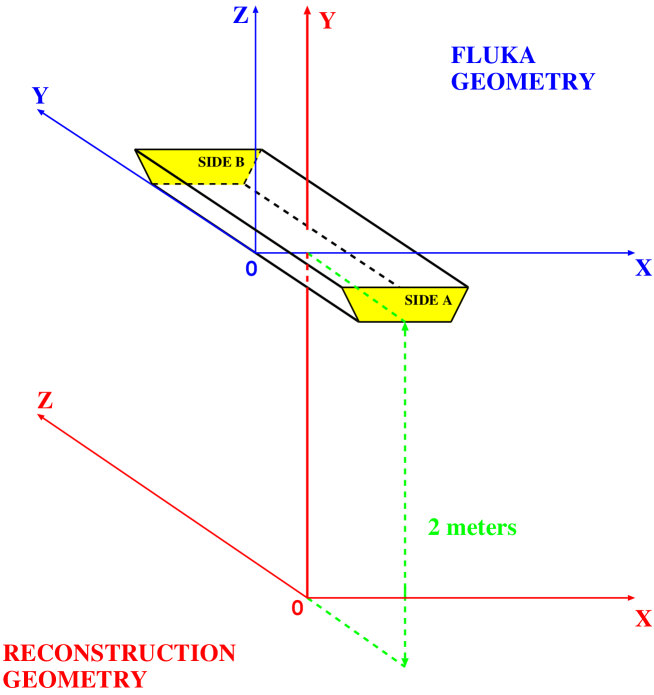
Throughout this thesis we plot all figures using the coordinate frame of the FLUKA.
The world is given to me only once, not one existing and one perceived.
Subject and object are only one. The barrier between them cannot be said to
have broken down as a result of recent experience in the physical sciences,
for this barrier does not exist.
Świat dany mi jest tylko raz, nie ten istnieja̧cy i nie ten doświadczany.
Podmiot i obiekt sa̧ jednym. Bariera pomiȩdzy nimi nie może być
złamana jako wynik ostatnich doświadczeń w naukach fizycznych, bariera ta nie
istnieje.
Erwin Schrödinger (1887 - 1961)
Education is what remains after one has forgotten everything he learned in school.
Edukacja jest tym co zostaje jak zapomni siȩ wszystko czego nauczyło siȩ w szkole.
Albert Einstein (1879 - 1955)
Acknowledgment
At first I wish to thank Prof. dr hab. Paweł Moskal for organizing for me an additional place in
travel to COSY Summer School in the year 2006. Since this event my real adventure with physic has begun. I also would like to thank you Paweł
for great patience in checking this diploma thesis, for giving me a chance to study a wonderfuld world of particle physics, for learning me
to ask myself why, and in which purpose I do my present job. And for many suggestions in the moments when I didn’t know what I should
do in the next step. And of course for coffees and discussions about many interesting topics.
I would like to thank dr Biagio Di Micco for many hours of working together with FLUKA geometry, with reconstruction of particles
on the 24 modules of the barrel calorimeter. I am greatly indebted to you for sitting in Frascati till late evening and trying to explain me
where I should look for mistakes, and of course for great patience.
I would like to thank dr Anna Ferrari for explaining me Birk effect and details related with machinery of FLUKA Monte Carlo.
Also I am very grateful to you for checking this thesis and for reassuring when I was very tired.
I am very grateful to Dr Antonio Passeri for financial support of my stay in Frascati, for very nice atmosphere during the work and
for help with numbering of channels in cosmic ray displayer.
I wish to thank Dr Catherina Bloise for letting me work in Laboratori Nazionali di Frascati and for financial support of my stays in Frascati.
Also I am very grateful for nice atmosphere in the work.
I would like to thank Dr Federico Nguyen for patience when I was talking with Biagio all the time and disturbed him in his work, and
for talkig during the lunch about football players and situation in the group during eliminations.
I wish to thank Master of Science Simona Bocchetta for nice atmosphere during the work.
I would like to thank Prof. dr hab. Bogusław Kamys for financial support of my stays in Jülich and in Frascati and for
teaching me how to understand nucleus complex reactions.
Klaja for coffees, cakes and discussions about
military weapons used during the Second World War.
I thank Master of Science Eryk Czerwiński for many explanations related with his work and patience in precise checking of this diploma thesis.
I would like to thank all the people from COSY-11 group and working in room 222 for wonderful atmosphere during the work.
Especially,
I have in my mind: Master of Science Dagmara Rozpȩdzik, Master of Science Barbara Rejdych,
Dr Rafał Czyżykiewicz, Ewelina Czaicka, Jakub Bożek and Michał Silarski.
On my personal side I would like to thank my family: my parents Lucyna and Józef Zdebik and my brother Rafał for love, patience and support
during many last years.
I thank very much Master of Science Izabela Perużyńska for being close to me in hard moments, in my life.
And at the end I would like to thank all people without whom this thesis would never be accomplished, and with whom I could work with pleasure
in Kraków, Frascati and Jülich.
Podziȩkowania
Na pocza̧tku chciałem podziȩkować Prof. dr hab. Pawłowi Moskalowi za zorganizowanie mi dodatkowego miejsca
na Szkole Letniej COSY Summer School w 2006 roku. Poczynaja̧c od tego wydarzenia rozpoczȩła siȩ moja prawdziwa przygoda z fizyka̧.
Jak rwnież chciałem Ci podziȩkować Pawle za wielka̧ cierpliwość, która Ci towarzyszyła podczas sprawdzania tej pracy,
za danie szansy
badania wspaniałego świata cza̧stek elementarnych, za uczenie mnie stawiania sobie celu w swojej bieża̧cej pracy. Jak również za wiele
sugestii w momentach gdy nie wiedziałem, w którym kierunku dalej pójść, oraz oczywiście za wspólne kawy i interesuja̧ce dyskusje.
Chciałbym podziȩkować doktorowi Biagio Di Micco za wiele godzin wspólnej pracy z geometria̧ programu FLUKA, jak
rwnież z rekonstrukcja̧
cza̧stek na całym "barrel calorimeter". Jestem bardzo wdziȩczny za siedzenie późnymi wieczorami w Instytucie we Frascati
i tłumaczenia gdzie powinienem szukać błȩdów, oraz za wielka̧ cierpliwość.
Chciałbym podziȩkować Pani doktor Annie Ferrari za wytłumaczenie mi efektu Birka i detali funkcjonowania program Fluka Monte Carlo.
Jak również jestem bardzo wdziȩczny za sprawdzenie tej pracy i za słowa otuchy gdy byłem bardzo zmȩczony.
Jestem bardzo wdziȩczny doktorowi Antonio Passeri za wsparcie finansowe moich pobytów we Frascati, za miła̧ atmosferȩ
podczas pracy oraz
za pomoc z numeracja̧ kanałów w wyświetlaczu promieni kosmicznych.
Chciałbym podziȩkować Pani doktor Catherine’a Bloise za umożliwienie mi pracy w Laboratorium Narodowym we Frascati
oraz za wsparcie finansowe
moich pobytw we Frascati. Jak rwnież jestem bardzo wdziȩczny za miła̧ atmosferȩ w pracy.
Chciałbym podziȩkować doktorowi Federico Nguyen za cierpliwość w momentach gdy rozmawiałem z Biagio i
przeszkadzałem mu w jego pracy,
jak również za rozmowy o zawodnikach piłkarskich oraz o sytuacji w grupie podczas eliminacji.
Chciałbym podziȩkować Pani magister Simonie Bocchetta za miła̧ atmosferȩ podczas pracy.
Chciałbym podziȩkować Prof. dr hab. Bogusławowi Kamysowi za wsparcie finansowe moich pobytów w Jülich i Frascati oraz za
tłumaczenia
reakcji ja̧drowych przez ja̧dro złożone.
Jestem bardzo wdziȩczny Prof. dr. hab. Lucjanowi Jarczykowi za trafne uwagi i sugestie podczas czwartkowych spotkań w Zakładzie Fizyki Ja̧drowej
Uniwersytetu Jagiellońskiego.
Jestem bardzo wdziȩczny magistrowi Marcinowi Zielińskiemu za dwa lata wspólnej pracy w pokoju 222 w Zakładzie Fizyki Ja̧drowej.
Przez te dwa lata miałem zawsze wielkie wsparcie z Twojej strony we wszystkich sytuacjach w moim życiu. Chciałem podziȩkować za
dyskusje, kawy
i wspaniała̧ atmosferȩ podczas pracy w tym pokoju.
Chciałbym podziȩkować magistrowi Wojciechowi Krzemieniowi za wiele dyskusji i pomoc w zawodowym i prywatnym życiu.
Również jestem bardzo
wdziȩczny za pracȩ z Toba̧.
Chciałem podziȩkować doktorowi Markowi Jacewiczowi za dyskusje i kawy.
Chciałem podziȩkować Pani magister Joannie Przerwie i magistrowi Pawłowi Klaji za kawy, ciastka i dyskusje o
broni wojskowej używanej podczas Drugiej Wojny Światowej.
Chciałbym podziȩkować magistrowi Erykowi
Czerwińskiemu za wiele wyjaśnień odnośnie jego pracy i cierpliwość w dokładnym sprawdzaniu tej pracy
magisterskiej.
Chciałbym podziȩkować wszystkim członkom grupy COSY-11 i pracuja̧cym w pokoju 222, za wspaniała̧ atmosferȩ podczas pracy.
Szczególnie, mam na myśli: magister Dagmarȩ Rozpȩdzik, magister Barbarȩ Rejdych, doktora Rafała Czyżykiewicza,
Ewelinȩ Czaicka̧, Jakuba Bożka i Michała Silarskiego.
Z mojej prywatnej strony chcȩ podziȩkować mojej rodzinie: moim rodzicom Lucynie i Józefowi Zdebikom i bratu Rafałowi, za
miłość,
cierpliwość i wsparcie przez wiele ostatnich lat.
Bardzo dziȩkujȩ magister Izabeli Perużyńskiej za bycie blisko mnie w trudnych momentach, w moim życiu.
I na końcu chciałem podziȩkować wszystkim ludziom, bez których ta praca nigdy by nie powstała, i z którymi praca
była przyjemnościa̧ w Krakowie, Frascati i Jülich.
References
- [1] J. Lee-Franzini and P. Franzini, e-Print: hep-ex/0702016v2, (2007).
- [2] D.H. Perkins, Wstȩp do Fizyki Wysokich Energii, PWN, Warszawa, (1989).
-
[3]
R. Beck et al., KLOE-2 Letter of Intent, (2006),
http://www.lnf.infn.it/lnfadmin/direzione/roadmap/LoIKLOE.pdf - [4] P. Ciambore, A. Passeri, The KLOE calorimeter front end electronics, Frascati Physics Series Vol. XXI, (2000), pp. 161-167.
- [5] M. Palutan, The KLOE calorimeter trigger, Frascati Physics Series Vol. XXI, (2000), pp. 169-176.
- [6] B. Di Micco, Ph. D. Thesis, Roma Tre University, (2004).
- [7] M. Zobov, e-Print: arXiv:0709.3696, (2007).
- [8] V. Lucherini et al., Nucl. Instr. & Meth. in Phys. Res. A 496 (2003) 315-324.
- [9] M. Agnello et al., Nucl. Instr. & Meth. in Phys. Res. A 570 (2007) 205-215.
- [10] D. Alesini et al., LNF-06/33 (IR), (2006).
- [11] M. Adinolfi et al., Nucl. Instr. & Meth. in Phys. Res. A 482 (2002) 364-386.
- [12] M. Adinolfi et al., Nucl. Instr. & Meth. A 488 (2002) 51.
- [13] F. Ambrosino et al., e-Print: physics/0404100v1, (2004).
- [14] S. Dell’Agnello, The KLOE detector, Frascati Physics Series Vol. XVI, (1999), pp. 381-391.
- [15] KLOE experiment homepage, http://www.lnf.infn.it/kloe/
- [16] M. Adinolfi et al., Nucl. Instr. & Meth. in Phys. Res. A 494 (2002) 326-331.
- [17] D. Domenici et al., Frascati Physics Series XLVI (2008), in print.
- [18] G. Bencivenni et al., The Full Scal Prototype of the Cylindrical-GEM Detector as Inner Tracker in KLOE2, Laboratori Nazionali di Frascati - INFN Via Enrico Fermi 40, I-00044 Frascati, Italy, (2008).
- [19] D. Domenici, The upgrade of the KLOE detector: KLOE2, Frascati Physics Series Vol. XLVI (2007), pp. 000-000.
- [20] G. Bencivenni, D. Domenici An ultra-light cylindrical GEM detector as inner tracker at KLOE-2, Laboratori Nazionali di Frascati - INFN, Frascati, Italy, (2007).
- [21] G. Bencivenni, D. Domenici, Nucl. Instr. & Meth. A 581 (2007) 221.
- [22] G. Bencivenni et al., Nucl. Instr. & Meth. A 572 (2007) 168.
- [23] G. Venanozi The Physics case of DAFNE-2, XXXI International Conference of Theoretical Physics "Matter To The Deepest" Ustron, Poland, (2007).
- [24] A.D’Angelo, Progress Report on the tagger, Laboratori Nazionali di Frascati - INFN, Frascati, Italy, (2007).
- [25] M. Adinolfi et al., Nucl. Instr. & Meth. in Phys. Res. A 483 (2002) 649-659.
-
[26]
R. Beck et al., A proposal for the roll-in of the KLOE-2 detector, INFN Frascati, (2007),
http://www.lnf.infn.it/kloe/kloe2/roll/rollin_proposal.pdf - [27] F. James, Monte Carlo phase space, CERN 68-15 (1968).
- [28] A. Fassò et al., e-Print: hep-ph/0306267v1 (2003).
- [29] A. Ferrari et al., Fluka: a multi-particle transport code, CERN, (2005).
- [30] J. Ranft, Phys. Rev. D 51 (1995) 64-84.
- [31] G. Battistoni et al., e-Print: hep-ph/0612075v1, (2006).
-
[32]
FLUKA organization homepage,
http://www.fluka.org -
[33]
A. Ferrari et al., Status of the KLOE EmC Simulation with FLUKA, KLOE-2 meeting, LNF July 25th, (2006),
http://www.lnf.infn.it/kloe/kloe2/calorimeter/20060725_ferrari.ppt - [34] B. Di Micco et al., Nuclear Physics B (Proc. Suppl.) 172 (2007) 243-245.
- [35] M. Anelli et al., Nucl. Instr. & Meth. in Phys. Res. A 581 (2007) 368-372.
- [36] J.B. Birks, The Theory and Practice of Scintillation Counting, Pergamon Press, London, (1964).
-
[37]
GEANT, Detector Description and Simulation Tool,
http://wwwasdoc.web.cern.ch/wwwasdoc/pdfdir/geant.pdf - [38] S. Agostinelli et al., Nucl. Instr. & Meth. in Phys. Res. A 506 (2003) 250-303.
- [39] R. Leo, Techniques for Nuclear and Particle Physics Experiments, Springer-Verlag, Berlin Heidelberg, New York, London, Paris, Tokyo, (1987).
- [40] M. N. Peron and P. Cassette, Nucl. Instr. & Meth. in Phys. Res. A 369 (1996) 344-347.
- [41] G. D. Badhwar et al., Nucl. Instr. & Meth. 57 (1967) 116-120.
- [42] A. Ferrari, Dipartamento di Fisica dell’Universitá e Sezione INFN, "Roma Tre", Italy, private communication (2008).
- [43] E. Ambrosino et al., e-Print: hep-ex/0603056v2, (2007).
-
[44]
G. Battistoni homepage,
http://www.mi.infn.it/b̃attist/ -
[45]
FLAIR project homepage,
http://www.fluka.org/flair/index.html -
[46]
J.Zdebik et al., Implementation of the geometry of the Barrel Calorimeter with FLUKA,
KLOE-2 General Meeting, LNF 8th, (2008),
http://www.lnf.infn.it/kloe/kloe2/agenda_8May08.htm/ - [47] A. Di Domenicco, Dipartamento di Fisica, Universita’ "La Sapienza" and Sezione INFN, Italy, private communication, (2008).
- [48] F. Nguyen, Dipartamento di Fisica, Universita’ "Roma Tre" and Sezione INFN, Italy, private communication (2008).
- [49] W. Kim, The Clustering Algorithm for the KLOE Calorimeter, Laboratori Nazionali di Frascati, I-00044 Frascati, Italy, (1995).
- [50] B. Di Micco, Dipartamento di Fisica, Universita’ "Roma Tre" and Sezione INFN, Italy, private communication (2008).
- [51] E. Czerwiński, Jagiellonian University, Poland, private communication (2008).
-
[52]
J. Filipowicz, Laboratorium Fizyki I, Uniwersytet Warszawski,
http://www.if.pw.edu.pl/ labfiz1p/cmsimple2_4/1instrukcje_pdf/21.pdf - [53] A. Strzałkowski, Wstȩp do Fizyki Ja̧dra Atomowego, PWN, Warszawa, (1979).
- [54] E. Czerwiński and B. Di Micco, private communications (2007-2008).
- [55] S. Miscetti, Laboratori Nazionali di Frascati dell’INFN, Frascati, Italy, private communication (2008).
- [56] R. Nowak, Statystyka dla fizykw, Wydawnictwo Naukowe PWN, Warszawa, (2002).
- [57] R. Zieliński, Metody Monte Carlo, Wydawnictwo Naukowo-Techniczne, Warszawa, (1970).
- [58] J.M. Thijssen, Computational Physics, Cambridge University Press, (1999).
- [59] Particle Data Group, W. M. Yao et al., J. Phys. G 33, (2006) 1.
-
[60]
A. Di Domenico, High quantum efficiency PM upgrade: overview, status of Hamamatsu RD,
and MC studies on efficiency and KSI3, Symposium on KLOE-2 Calorimeter 27-30th March, Cracow, (2008),
http://www.lnf.infn.it/kloe/kloe2/calorimeter/symposiumcracow/didomenico_cracow_web.pdf - [61] P. Moskal, Jagiellonian University, Poland, private communication (2008).
- [62] http://wwwinfo.cern.ch/asd/paw/