Testing the Possible Intrinsic Origin of the Excess Very Strong MgII Absorbers Along GRB Lines-of-Sight
Abstract
The startling discovery of Prochter et al. (2006) that the frequency of very strong ( Å) Mg ii absorbers along gamma-ray burst (GRB) lines of sight () is more than three times the frequency along quasar lines of sight (), over similar redshift ranges, has yet to be understood. In particular, explanations appealing to dust anti-bias in quasar samples, partial covering of the quasar sources, and gravitational-lensing amplification of the GRBs have all been carefully examined and found wanting. We therefore reconsider the possibility that the excess of very strong Mg ii absorbers toward GRBs is intrinsic either to the GRBs themselves or to their immediate environment, and associated with bulk outflows with velocities as large as . In order to examine this hypothesis, we accumulate a sample of 27 Å absorption systems found toward 81 quasars, and compare their properties to those of 8 Å absorption systems found toward 6 GRBs; all systems have been observed at high spectral resolution () using the Ultraviolet and Visual Echelle Spectrograph on the Very Large Telescope. We make multiple comparisons of the absorber properties across the two populations, testing for differences in metallicity, ionization state, abundance patterns, dust abundance, kinematics, and phase structure. We find no significant differences between the two absorber populations using any of these metrics, implying that, if the excess of absorbers along GRB lines of sight are indeed intrinsic, they must be produced by a process which has strong similarities to the processes yielding strong Mg ii systems associated with intervening galaxies. Although this may seem a priori unlikely, given the high outflow velocities required for any intrinsic model, we note that the same conclusion was reached, recently, with respect to the narrow absorption line systems seen in some quasars.
1 Introduction and Motivation for This Study
Intervening metal absorption line systems have been routinely observed along the lines of sight to cosmological gamma-ray bursts (GRB) since the first optical/UV spectrum of a GRB afterglow was obtained in 1997 (Metzger et al., 1997). In particular, Mg ii resonance doublet absorption, observable from the ground over redshifts , has been detected in many GRB afterglow spectra, at redshifts well separated from that of the highest-redshift absorber in the system, which is typically associated with the GRB host galaxy.
Strong intervening Mg ii absorbers are a familiar subject of quasar absorption-line studies, and have been used for decades in studies of intermediate-redshift galaxies and their environments. Indeed, it is now known that the presence of absorption with Mg ii 2796 rest frame equivalent width Å (so called “strong” absorption systems) is commonly (% of all cases) associated with the presence of a nearby (within 60 kpc projected distance) 0.1–5 galaxy along the line-of-sight (Kacprzak et al., 2008).
The detailed physical picture of the strong Mg ii absorbers continues to be elaborated.
Among the strongest ( Å) Mg ii absorbers at , approximately 80% are also damped Lyman-alpha systems (DLAs; Rao et al. 2006). Imaging of the quasar fields for a subset of even-stronger ( Å) Mg ii absorbers at low redshift () indicates that interactions, pairs, and starburst related phenomena are likely to be responsible (Bouché et al., 2007). In roughly the same redshift range, Bouché et al. (2006) find an anti-correlation between Mg ii equivalent width for each system and the mass of its associated dark matter halo based on halo masses predicted from clustering analysis. Since the Mg ii equivalent width of strong absorbers is determined primarily by the velocity dispersion of its constituent absorbing clouds, this relationship is consistent with a starburst picture for the strongest Mg ii systems, but not with structure within individual virialized haloes. Finally, Prochter et al. (2006) concluded, over a larger redshift range (), based on the kinematics of Å absorbers, that these structures are related to superwinds, rather than to large-scale gas infalls in galaxy halos. Indeed, Nestor et al. (2005) find a rapid decline in the incidence of Å systems with decreasing redshift, consistent with the expectations from superwinds since these are thought to increase in concert with the global star formation rate.
GRBs and their afterglows are promising probes of the high-redshift Universe due to their brightness and observed redshift distribution, now extending beyond . High-resolution spectroscopy of the brightest afterglows has been used to study GRB host galaxies, and the subgalactic environs of GRBs, up to . With respect to intervening absorption systems, one would naively expect GRB lines of sight to be equivalent to quasar lines of sight, including strong Mg ii absorbers. However, for very strong ( Å) Mg ii absorbers, a puzzling difference in the redshift path density, dN/dz, between GRB and QSO sightlines has been discovered. The frequency of these absorbers along GRB lines of sight is more than three times larger () than the frequency along quasar sightlines () covering a similar range of redshifts (Prochter et al., 2006).
Since the discovery of this factor of 3 discrepancy, several hypotheses have been advanced to explain it: (1) The number of Mg ii systems along quasar lines of sight has been suppressed, due to a bias within quasar samples towards brighter objects lacking, e.g., dusty foreground systems along the line of sight; (2) The relative beam sizes of quasar and GRB afterglow emitting regions lead to partial covering in quasar spectra, and increased numbers of strong absorption systems in GRB spectra; (3) Gravitational lensing by the mass concentrations associated with strong absorption systems magnifies the GRB and its afterglow, increasing the probability of detection and spectroscopic observation; (4) A dominant number of the strong absorption systems in GRB spectra are physically associated with the GRB environment, the GRB itself, or both.
We will now briefly review the status of each of these hypotheses as a way of motivating the present study, which focuses on the fourth hypothesis, that the excess of very strong Mg ii absorption systems in GRB afterglow spectra is intrinsic to the GRB or its environment. For any of the other hypotheses to provide an explanation of the full effect, the resulting biases would have to be quite large. The intrinsic hypothesis, by contrast, is required to produce on average roughly one intrinsic, high-velocity absorption system per GRB.
1.1 Bias Due to Dust
If the very strongest intervening Mg ii absorbers tended to arise in the dustiest environments they would diminish the observed magnitude of a background quasar. In such a way, optical magnitude-limited quasar absorption-line surveys might be biased toward the brighter quasars that do not have the strongest Mg ii systems in the foreground. Although gamma ray bursts would suffer the same dust bias effect, this effect is less important in determining whether a high signal-to-noise, high-resolution spectrum can be obtained than is the speed at which follow-up observations are possible. Thus we would expect that gamma ray bursts that have very strong, dusty Mg ii absorbers in the foreground would still be present in a sample of high-resolution GRB optical spectra. GRB spectra should therefore have more very strong Mg ii absorbers on average than do quasar spectra.
The main problem with this explanation for the excess of Å absorbers in GRB spectra is that the magnitude of the effect is not nearly large enough to explain a factor of more than three excess. Ménard et al. (2008) found that % of quasars are absent from optical surveys due to reddening and extinction from strong Mg ii systems ( Å). Even for Å systems, which are too rare to affect enough quasars to explain the observed excess, slightly less than half of the quasars with such foreground absorbers would be missed in a magnitude-limited sample. More directly, Ellison et al. (2006) estimated the extinction due to a Å intervening system along the line of sight of GRB 060418 at redshift . The amount of extinction derived is mag, which is not sufficient to obscure sufficient quasars to explain the observed discrepancy in .
1.2 Partial Beam Coverage Explanations
An interesting explanation has been proposed by Frank et al. (2007), assuming that GRB emitting regions are generally smaller than those of quasars. In order to avoid obvious signatures of partial covering in the case of quasar strong Mg ii absorbers, Frank et al. (2007) derived a cloud density profile with a constant density core surrounded by a power-law density profile. The density profile sampled by the beam depends on the size of the beam relative to the core size of the absorber and on the impact parameter. Small beams that pass through only the center of the cloud sample much higher column densities than beams larger than the core for which high optical depth absorption is diluted. Because the GRB beam size changes in time, one prediction of this scenario is variability in the strength and the structure of their absorption lines. Such variability has not yet been seen (Thöne et al., 2008), although it was once suggested (Hao et al., 2007) in the case of GRB 060206. More importantly, Pontzen et al. (2007) point out that signatures of partial covering should still be seen in high-resolution spectra unless the cloud density profiles are fine-tuned to an unreasonable degree. They also show that it is unlikely that an excess of the needed magnitude could arise from this effect. Finally, there is no way to set up the clouds producing the numerous distinct absorption components seen in strong Mg ii absorbers such that the line of sight passes through the inner high-density core of all of the clouds (Porciani et al., 2007).
1.3 Lensing Amplification of GRB Beam-size
Following an analogy with BL Lac objects as studied by Stocke & Rector (1997), the idea that a GRB line of sight intersects more absorbers because the emitting region is microlensed by a gravitational potential has also been considered (e.g. Loeb & Perna (1998); Garnavich et al. (2000); Baltz & Hui (2005); Hirose et al. (2006)). In particular, considering binary lensing and double magnification bias, Baltz & Hui (2005) estimate that there is a 60% chance that a given GRB is microlensed. On the other hand, using a sample from Sloan Digital Sky Survey (SDSS) quasars, the magnification factor has been calculated to be (Ménard et al., 2008). This value is not sufficient to lead to the observed excess of very strong Mg ii absorbers towards GRBs. Furthermore, if the lensing effect is significant for GRBs, we would expect strong lensing in some cases, along with associated multiple images, “repeating” GRBs, and “bumps” in GRB optical light curves (Loeb & Perna, 1998), none of which are commonly seen.
At the same time, it is important to consider whether a significant magnification bias could result from an underlying source luminosity distribution (i.e. –) that is steep at its faint end. Nardini et al. (2006, 2008) have argued that this is the case, with power-law index ; however, a statistical sample will be needed to test this hypothesis which is based on energetic arguments. Zitouni et al. (2008) found that using an internal shock model the faint end slope of the GRB optical luminosity function can be fitted by a power law index with , as also noticed by Porciani et al. (2007), which would be too flat to explain the discrepancy.
1.4 An Origin Intrinsic to GRBs or Their Environments
In view of the dramatic excess of Å absorbers toward GRBs and the problems with the explanations discussed above, we should consider further the idea that the GRBs themselves or their immediate environments are responsible for material observed as Mg ii absorption. Since the observed excess is apparent over a substantial redshift range, the material would have to be accelerated to at least – relative to the GRB host galaxy. At first glance it might seem implausible that such high velocity ejection could be consistent with such narrow lines as are observed as components in the strong Mg ii absorbers (Prochter et al., 2006). However, it is important to note that similar high velocity narrow absorption lines are known to be ejected in the accretion disk winds of quasars (Misawa et al., 2007a; Ganguly & Brotherton, 2008; Rodriguez Hidalgo et al., 2007; Narayanan et al., 2004, 2007). This phenomenon also has yet to be explained by accretion disk wind models. Clearly it is possible for dense, coherent clouds of gas to hold together, even in mildly-relativistic outflows, at least in this case. So it seems possible that the same could be the case for GRBs.
We know that the GRB forward shock reaches distances of cm from the central engine, after which it is decelerated by the ambient medium. Over this distance it interacts with the circumstellar (and interstellar) medium, generating a relativistic shock that produces the afterglow emission via synchrotron radiation of accelerated electrons. The highly-relativistic motion of this shock, expected to have a Lorentz factor of at early times and evolving according to the Blandford-McKee solution (Blandford & McKee 1976), sets severe constraints on the properties of any burst-related gas that might be responsible for absorption features in the afterglow spectrum.
Beyond the region affected by the physical shock, GRB high-energy photons are able to ionize gas within pc from the central engine, as demonstrated by X-ray spectroscopy of GRB 050904, which exhibited a time-variable absorbing column (Campana et al., 2007; Watson et al., 2007).
At distances greater than pc, there are signatures of absorption by neutral hydrogen, dust, and metal enriched and molecular gas (Prochaska et al., 2009). UV pumping of atomic states by the burst prompt and early afterglow emission is estimated to occur at distances of pc (for Mg i absorption in GRB 050111; Prochaska et al. 2006) to 1.7 kpc (for Ni ii and Fe ii absorption in GRB 060418; Vreeswijk et al. 2007).
If the GRBs emission photoionizes Mg ii clouds out to pc, this should lead to an increase in temperature to K. It would thus be necessary to rely on the existence of a dense, metal-rich cloud which is not penetrated by the relativistic shock and which cools faster than the surrounding material. As proposed by van Marle et al. (2007), the progenitor’s Wolf-Rayet wind is capable of providing dense material at the required distance. Unfortunately, the likely velocities are an order of magnitude less than is needed to explain the velocities of the GRB excess absorbers considered here.
The need to supply the near vicinity of GRBs with a copious amount of iron-enriched, fast-moving gas provided one of the initial motivations for the “supranova” model (Wang et al., 2002; Königl & Granot, 2002; Vietri et al., 2001), which proposed that a supernova mere weeks to months prior to the GRB was responsible for dispersing this gas, and that the collapse of the metastable, fast-spinning neutron star born in the supernova later generated the burst itself. The original observational stimulus to these models was provided by claims of detection of high equivalent-width iron emission lines in afterglow X-ray spectra (Piro et al., 2000, e.g.,); these claims are no longer favored (Sako et al., 2005). However, given that the model produces fast-moving gas with speeds of it may be worth mentioning again in the present context.
Even if it is necessary for a supernova to explode prior to the GRB, to produce fast-moving gas along the line of sight, it may not be necessary for the two to be directly related. Wang et al. (2003) suggest that GRB 021004 was located in a region where the ISM was metal-rich due to high velocity ejecta from a hydrogen-rich “supernova” that exploded a few months before the GRB. In this particular case, the detected Lyman- components also indicate absorption by a clumpy medium. This material has been accelerated then by the GRB blast wave (see Wang et al. (2002) for a detailed analysis). In the limiting case where the absorbing gas must be relativistic, , it may be necessary to invoke a “hypernova” (SN 1998bw-like SN) rather than a more ordinary type of SN (mdm02; mvd08; sbp08).
Ultimately, the required apparent velocities needed to explain the excess GRB absorbers are not unusual for quasar outflows. Intrinsic narrow absorption lines, C iv and Si iv, have been observed in quasar spectra (Misawa et al., 2007a; Ganguly & Brotherton, 2008; Rodriguez Hidalgo et al., 2007; Narayanan et al., 2004, 2007) showing blueshifts consistent with an ejection velocity in the range 5,000–70,000 . A comprehensive model to understand these intrinsic feature has still to be developed, but the similarities with the GRB case are intriguing.
Whether or not these ideas for fast-moving absorption systems are reasonable, it is necessary in addition to understand how they fit into the larger context of the GRB immediate environs and host galaxy, and their associated absorption features. The bulk of the host galaxy absorption is apparently coming from kpc, that is, from the host galaxy at large rather than the immediate GRB environment; yet it is clearly affected by the GRB radiation field, at least in those cases where metastable lines are observed. These systems are not counted in the excess of very strong Mg ii absorbers found by Prochter et al. (2006), but it is important to consider how the absorption signature from high-velocity material more local to the GRB might compare to that of the host galaxy.
1.5 Motivation for This Study
We aim to consider the similarities and differences between the absorption profiles of: (1) very strong Mg ii absorbers found in quasar spectra; (2) very strong Mg ii absorbers found in GRB spectra, which are a combination of the same objects found in quasar spectra and a separate population yet to be understood; and (3) the GRB host galaxy absorption. Naively we might expect that the absorbers responsible for the factor of three excess of very strong Mg ii absorbers along GRB sightlines should differ in some way from the usual quasar absorption line systems. We thus compare quasar absorption line systems taken from the VLT/UVES archive with systems seen in absorption in GRB spectra obtained with the same instrument and configuration. We consider the kinematics of the Mg ii profiles; the ratios of Mg ii equivalent widths to those of other transitions, including dust tracers; the relationship between high and low ionization transitions; and the possible presence of metastable lines.
In the next section, we describe the VLT/UVES datasets and our analysis methods. In §3 we present the results of our comparisons between the very strong Mg ii absorbers seen toward quasars and GRBs. In §4 we discuss the implications of our result that there are no apparent differences between these populations, in particular, considering the implications for the hypothesis of an intrinsic origin for a majority of the GRB absorbers. §5 summarizes our conclusions.
2 Dataset and analysis
Our GRB dataset consists of 6 GRBs observed with the Ultraviolet and Visible Echelle Spectrograph (UVES) mounted on VLT. These include all high resolution UVES spectra that were accessible to the public before August 2008. The details of the observations, including the time that the observations were obtained, the wavelength coverage, and the exposure time, are listed in Table 1. In the last column of the table we report previous works on the GRBs host galaxy.
The quasar dataset included 81 QSOs, also obtained with UVES/VLT. These quasars, listed in Table 1 of Narayanan et al. (2007), are those for which data were available before June 2006. All observations of a given quasar were combined with weighting, after scaling by the ratio of the median ratio of the number of counts in the best exposure to the counts in the given exposure.
The GRB and quasars spectra were reduced using standard UVES/VLT tools under the MIDAS environment. Because of possible variability, the different exposures of the same GRB were not combined. A conversion to a heliocentric vacuum scale was applied to the final spectra. Continuum fitting and normalization was performed using the IRAF SFIT procedure111IRAF is distributed by the National Optical Astronomy Observatories, which are operated by AURA, Inc., under cooperative agreement with NSF, by dividing the spectrum into 3000 pixels segments and fitting each segment separately. The spectra were normalized by the resulting continuum fit.
The signal-to-noise ratio ratio (S/N) of the QSO spectra ranges from per pixel over most of the wavelength coverage. The GRB spectra are somewhat noisier due to the limitations caused by the need for rapid followup before the GRB fades. We searched both the QSO and GRB spectra for Mg ii doublets in regions redward of the Ly forest. Formally, we applied a detection limit to absorption features. We first assumed that every detection represents the Mg ii 2796 component of the Mg ii doublet. A candidate Mg ii system was considered if there was at least a 2.5 detection of the corresponding line for the same redshift. We also compared the two line profiles, which should show similar subcomponents, and then we calculated the equivalent width of the blue component via Voigt-profile fitting.
Since our focus is on very strong Mg ii absorbers, with equivalent width Å, we are easily detecting all systems of interest. For detected systems we then searched the expected locations of other ions, including Ly, Ly, Mg i , Fe ii 2374, 2383, 2587, and 2600, Si ii 1260, C ii 1335, Si iv , C iv (the complete list can be found in Tables 3, 4, and 5).
Several of these transitions are only covered for the very highest redshifts in our sample, and thus could not be used for a statistical comparison. We also considered dust tracers such as Zn ii 2026,2063, Crii 2056,2062,2066, Ni ii 1710,1752, and Mnii 2577,2594,2606. Whenever these transitions are covered we measured the equivalent widths or equivalent-width upper limits. When blends with transitions from systems at other redshifts were identified we considered the measured equivalent width as an upper limit.
3 Results
In our search of the 6 GRB spectra listed in Table 1, we found 8 Å Mg ii doublets. The redshift path length for our GRB search was 9.9, giving a , consistent with the value from Prochter et al. (2006), obtained from 14 GRBs spectra. Similarly, we identified Å Mg ii doublets over a redshift pathlength of 77.3 towards 81 QSOs. We derive for very strong Mg ii absorbers observed toward quasars, which is also consistent with the much larger Sloan sample of Nestor et al. (2005). Some GRBs of our sample were already present in (Prochter et al., 2006), so this consistency is not completely surprising. System plots for the GRB absorbers, including various transitions that provide useful constraints, are shown in velocity space in Fig. LABEL:fig:fig1a-h. Similar plots for the quasar absorbers are given in Fig. LABEL:fig:fig2a-aa. Basic information about the absorbers, for both GRBs and quasars, is given in Table 2. Rest frame equivalent widths of selected transitions that were detected in one or more systems are given in Tables 3, 4, and 5, along with equivalent width limits in cases where the transition was covered but not detected.
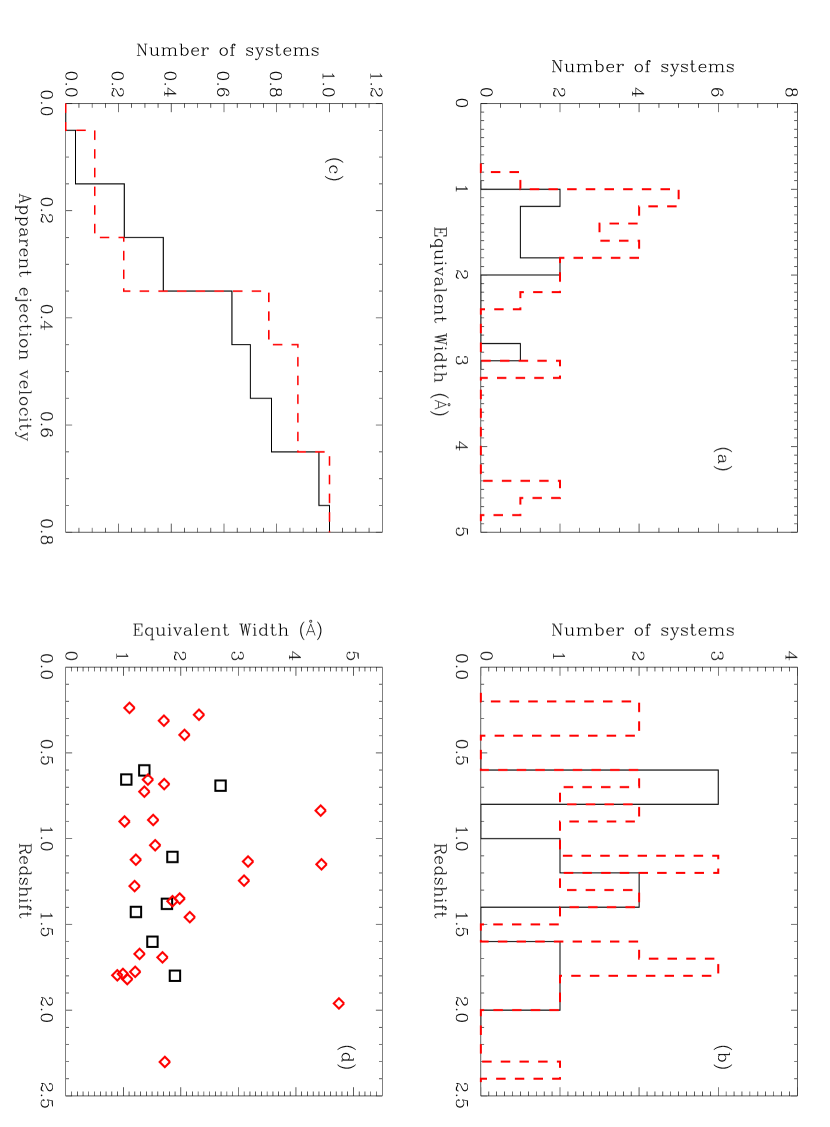
The excess of strong Mg ii absorbers along GRB lines of sight, as compared to quasars, applies only for Å, though there appears to be no greater an effect for even stronger systems (Prochter et al., 2006). For our VLT/UVES samples we plot as a function of redshift in Fig. 3d. The equivalent width distributions of the GRB and quasar Mg ii absorbers were compared (including only those with Å) using a Kolmogorov-Smirnov test (K-S test) and it was found that they are consistent with being drawn from the same distribution ().
It is also important to consider whether the redshift distributions of the two samples are the same, since Å Mg ii absorbers are known to evolve in the sense that they are less common at low redshift. A redshift difference could therefore lead to a difference in the equivalent width distributions. We find, however, that a K-S test shows that the redshifts of the GRB and quasar Mg ii absorber samples are consistent of being drawn from the same distribution ().
A difference in the redshift distributions between the two samples could also be indicative of a concentration of GRB Mg ii absorbers at lesser ejection velocities. We therefore also show in Fig. 3b the cumulative distributions of relative velocities for the two samples, normalized to 1. We convert the quasar Mg ii absorber redshifts to relative velocities merely to facilitate the comparison. There is no significant difference between these distributions, though we note that only one of the GRB absorbers has an apparent ejection velocity greater than .
In this section we describe various comparisons of the kinematics and the absorption in numerous chemical transitions for the 8 very strong Mg ii absorbers seen towards GRBs and the 27 seen towards quasars. These detailed comparisons are facilitated by the high resolution of the UVES/VLT spectra. Fig. 4 shows the absorption profiles of the Mg ii 2796 line for the 8 GRB Mg ii systems in the left panel and a selected sample of 8 quasar systems at similar redshift in the right panel. At face value, the profiles are similar in terms of their equivalent widths and kinematic structures. We will now examine this quantitatively, considering also other elements and ions and their relation to the Mg ii absorption properties. We also note that there is no evidence for partial covering for the Mg ii absorbers, neither for the quasar or GRB cases. Most lines/components are saturated over a finite extent in wavelength.
3.1 Mg ii Kinematics
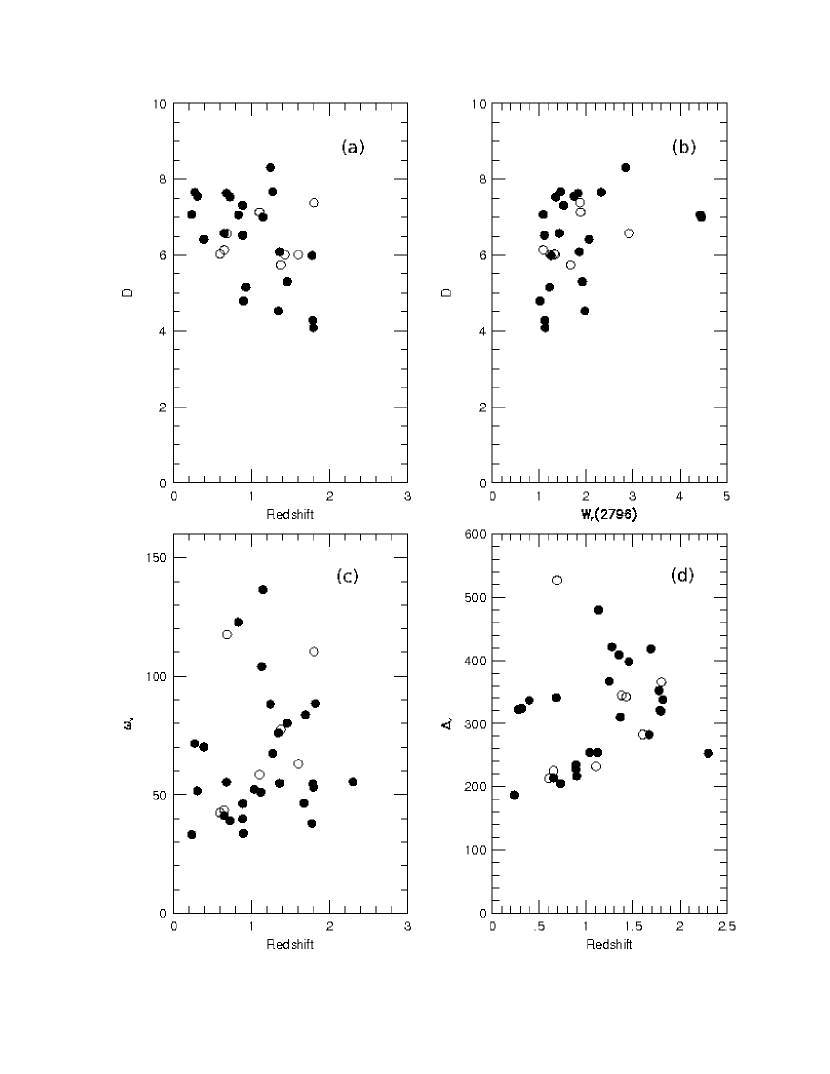
We make quantitative comparisons of the Mg ii 2796 profiles of the quasar and GRB absorbers using some of the same statistics that Mshar et al. (2007) used to consider evolution of strong Mg ii absorbers. In addition to the equivalent widths, we describe the Mg ii 2796 absorption profiles by several kinematic indicators, namely, the full velocity range, , kinematic spread, , and -index, . The full velocity range of a system is the difference between the minimum and maximum velocities at which absorption is detected while the kinematic spread, as defined in detail in Appendix A of Churchill & Vogt (2001), is the optical depth weighted second moment of the velocity. This kinematic indicator is particularly sensitive to weak components at high velocities from the central absorption. Finally, we estimated the -index (Ellison, 2006; Ellison et al., 2009), defined as Å, in order to indicate a distinction between DLAs and lower column-density absorbers. gives an indication of the fraction of the profile that has saturated absorption in Mg ii 2796.
Figure 5 presents the three kinematic indicators, , , and , for quasar and GRB Mg ii 2796 profiles as a function of redshift. There is no evolution apparent in or for the quasar population. There is a suggestion of an increase in with decreasing , but it is only significant at the 4% level according to the Kendall rank order test (Ferguson et al., 1995). If this trend is real it would indicate that low-redshift, very-strong Mg ii absorbers are more likely to have black absorption across their profiles. Figure 5 also shows the dependence of on . There is no significant correlation between these two quantities.
The main purpose of Figure 5, for the purpose of this study, is to compare the quasar and GRB Mg ii 2796 profiles. We found no significant differences between the distributions of , , or between the two populations as evaluated using a Kolmogorov-Smirnov (K-S) test. In particular, a K-S test comparing the D-values between GRBs and QSOs are consistent of being drawn from the same distribution ().
3.2 Equivalent Width Comparisons
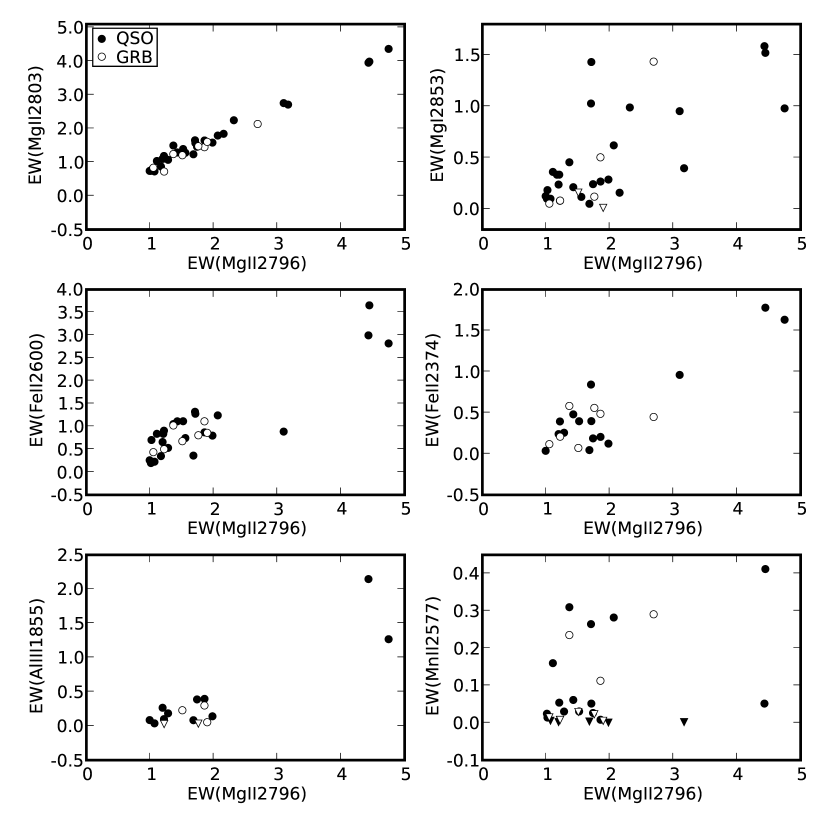
Fig. 6 plots the rest-frame equivalent widths of selected transitions versus those of Mg ii 2796. These particular transitions were selected for display because they were accessible to analysis in our spectra and/or because they represent important tracers of the physical conditions in the gas. Rest frame equivalent widths and equivalent width limits for other transitions are given in Tables 3, 4 and 5. The basic result from Fig. 6 is that there are no significant differences between the GRB and quasar samples. The Mg i 2853, Fe ii 2600, and Fe ii 2374 transitions are almost always covered and detected, but the values for GRB absorbers span the range of values for quasar absorbers of similar . The detection of Mg i absorption implies that the absorbing gas cannot be located within 50 pc of the GRB afterglow (Prochaska et al., 2006). We therefore note that several of the GRB absorbers are among the lowest Mg i equivalent widths for our sample, though there is no statistically significant difference in the overall distributions.
The dust tracer Mnii 2577 is covered in many cases, though often not detected. Again, the GRB and quasar absorbers have a similar distribution in Fig. 6. Dust will be discussed further in § 3.4. The higher-ionization line Al iii 1855 is only covered for the highest-redshift quasars and GRBs but it can be noted that the few GRB absorbers do not deviate significantly from the quasar absorbers in their high-ionization content. Details of the high-ionization kinematics, as traced by CIV, will be discussed in § 3.5.
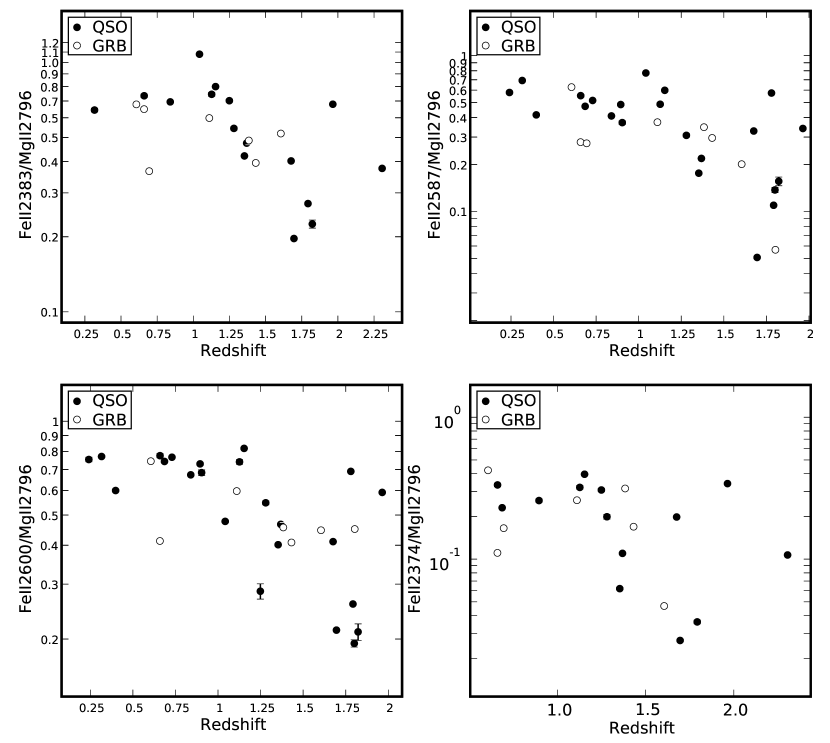
3.3 Fe ii to Mg ii Ratio
The ratio of Fe ii to Mg ii provides a good measure of the ionization parameters for values greater than -4.0, where is the ionization potential for the particular transition. Also, if the Fe/Mg ratio is small it could suggest that the gas is -enhanced, while if it is large it is clear that Type Ia supernovae have played a role in enriching the gas. Alternatively, a lower Fe ii to Mg ii ratio can arise in lower density gas, with a higher ionization parameter. From Fig. 7 we see, for the QSOs in particular, an evolution in the equivalent width ratio of Fe ii to Mg ii, with an absence of small values at (Wessels et al., 2009). We interpret this as an absence of -enhanced very-strong Mg ii absorbers at low redshifts due, presumably, to a diminishment of contributions of superwinds to this class of absorber at .
There are not enough very strong Mg ii absorbers found toward GRBs to confirm whether the same trend in evolution of the Fe ii to Mg ii ratio holds for the GRB absorbers. However, there are two GRBs with among the lowest Fe ii to Mg ii equivalent width ratios for low redshift absorbers (the GRB 060418 system at and the GRB 050820 system at ). If this tendency were supported by a larger dataset, it would suggest that the low-redshift GRB absorbers do indeed differ from the quasar population supporting an origin at high redshift in the GRB environment. However, we do not have sufficient GRB data at this time to support this conclusion.
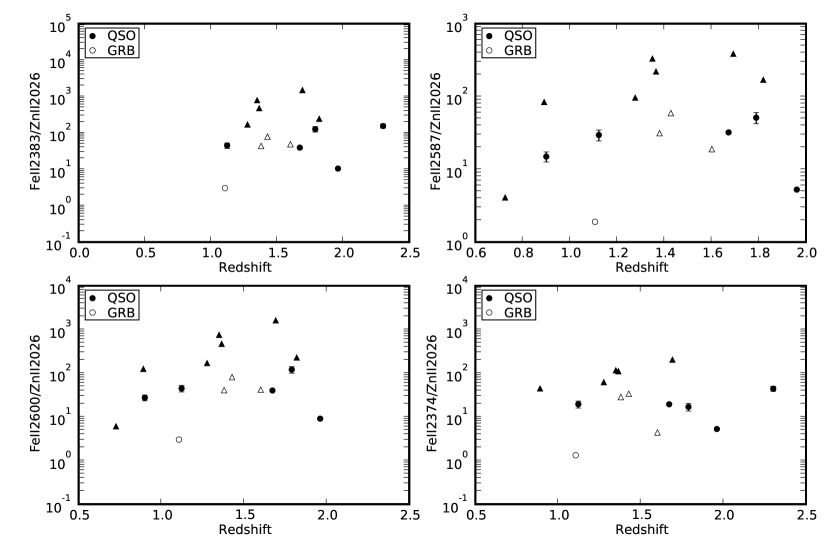
3.4 Dust
To estimate the dust depletion we used the ratio Fe/Zn. This quantity is a good tracer of depletion due to the diference in these elements’ refractory properties. As shown in Savaglio (2006), dust depletion tends to be higher for a higher Zn ii column density. Specifically, we used the equivalent width ratio of Fe ii 2374 to Zn ii 2026 as a dust indicator, since we could directly measure this from our data. Although a column density ratio would be more physically meaningful, our goal is only to make a comparison between the GRB and quasar absorbers, so we have chosen to use the direct observable.
Based on the derived values of, for exampple, , as shown in Fig. 8, we find again that the quasar and GRB populations are similar. However, the lowest data point, arising from the system toward GRB 060418, deserves further comment. We confirm the finding of Ellison et al. (2006) that this absorber is particularly dusty. However, as mentioned in § 1.1, this amount of dust in quasar Mg ii absorbers would not be sufficient to prevent a typical quasar from being observed in large-area surveys. It might be an indication of a particularly unusual environment in that GRB absorber.
3.5 C iv Kinematics and Phase Structure
Photoionization modeling of Mg ii absorbers has shown that C iv and Mg ii absorption does not usually arise in the same phase (gas with the same density and temperature). The C iv arises in a lower-density phase that produces generally broader lines that are often aligned in velocity with components arising in higher-density gas that gives rise to low-ionization absorption (Ding et al., 2003a, b; Masiero et al., 2005). C iv components without associated Mg ii are also often detected at other velocities. There also exists a subset of strong Mg ii systems, so-called C iv-deficient absorption, with only weak or even non-detected C iv (Churchill et al., 2000).
The very strong quasar Mg ii absorbers in our sample, with C iv covered, share those general features. Churchill et al. (2000) found two different categories of very strong Mg ii absorbers: one in which the C iv absorption was also very strong (called double), interpreted as consistent with galaxy pairs and one in which the C iv was typical of that found in Å strong Mg ii absorbers (called DLA/H i-rich), consistent with a particularly dense region producing Mg ii within a normal galaxy and its halo. Unfortunately, in only three GRB absorbers from our sample does the C iv coverage provide information. In the absorber toward GRB 060607 the C iv traces the Mg ii in velocity, but two phases are required to explain the relative strengths. There is also a separate C iv component in this absorber without associated detected Mg ii. The system toward GRB 021004 has quite a noisy spectrum, but it appears that C iv is only detected in the bluer components of the system. The same phenomenon is observed for the Al iii associated with that system. Finally, with the system toward GRB 021004, again the spectrum is noisy, but it appears that the C iv roughly traces the Mg ii. We conclude that the GRB C iv absorber profiles appear to have similar kinematic properties to the quasar absorber C iv profiles. It is interesting to note that the dN/dz for such highly ionized transition does not show significant difference between GRB and Quasars samples, as shown by Tejos et al. (2007).
3.6 Fine Structure and Metastable Transitions
It is common to detect fine structure transitions in the highest-redshift – presumed host galaxy – absorbers of GRBs. These host galaxy absorbers are often DLAs, and are characterized by strong low-ionization absorption with accompanying high-ionization absorption. Among the six GRBs that we have studied here, GRB 050730 (Starling et al., 2005), GRB 060418 (Vreeswijk et al., 2007) and GRB 050820 (Prochaska, 2006; Berger et al., 2005; Vreeswijk et al., 2007) have this type of absorber at the GRB redshift. On the other hand, for GRB 060607, Prochaska et al. (2008) have reported host galaxy absorbers with only high ionization absorption features. It is possible the host galaxy absorption for GRB 060607 might actually be at a lower redshift, and the detected C iv absorption at might be due to material moving with positive relative velocity along the line of sight towards the GRB at the host redshift.
In the case of our six GRBs, fine structure transitions have been reported in GRB 060418, GRB 021004, and GRB 050730. Ordinary intervening DLAs often have detected C ii∗, but do not have the Si ii∗ and Fe ii∗ transitions that are evident in some of these GRB hosts. Two major mechanisms have been discussed for producing these fine structure lines: UV pumping or collisional excitation. The UV pumping mechanism, generally thought to be more likely (Prochaska et al., 2006), requires the host absorber to be located within the same galaxy as the GRB..
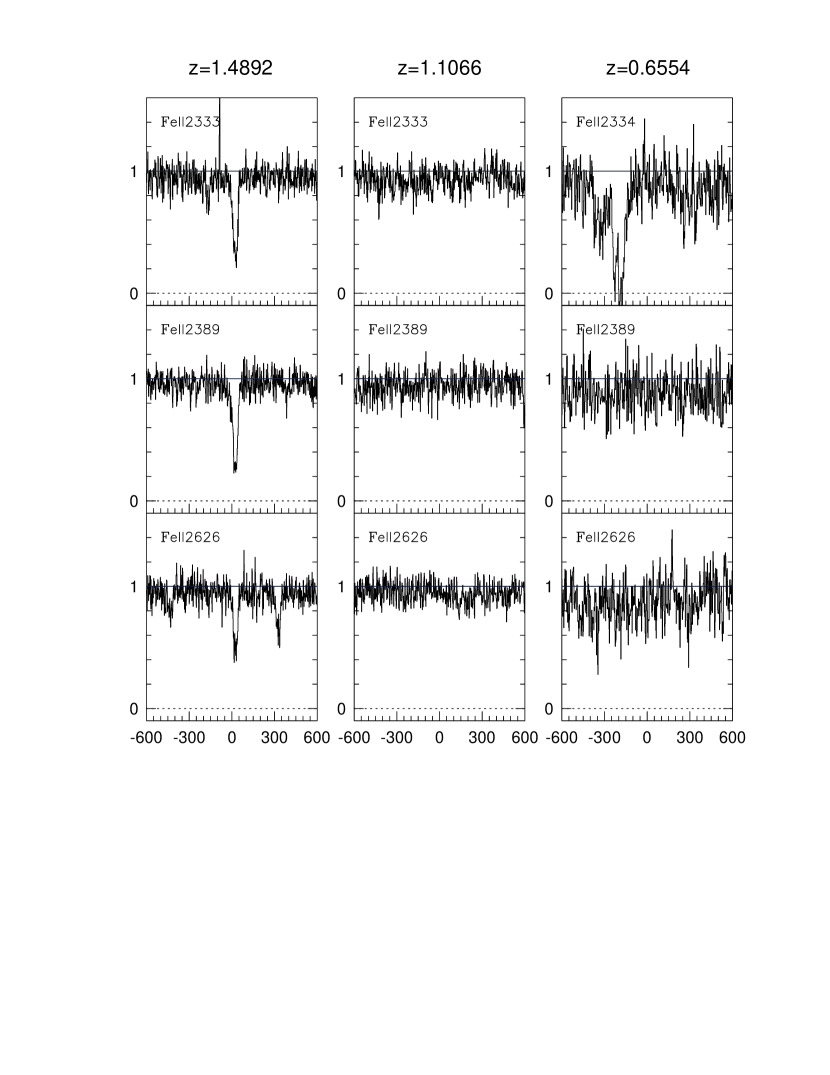
If the excess of strong Mg ii absorbers in GRBs are proximate to the GRB radiation field, we might expect to observe fine structure transitions from them as well. We find that these fine structure transitions are not detected in any of the cases here. Fig. 9 shows an example of the regions where we would expect to detect Fe ii* and Ni ii* for the system toward GRB 060418, and they are not detected. We conclude that if the excess absorption arises in material intrinsic to the GRB, it must have properties distinct from the “host galaxy absorbers”, for example, it might be at a closer location but have a much higher density, as we discuss further in § 4.
Absorption in the meta-stable levels of Fe ii∗ and Ni ii∗ was detected in the host galaxy absorption associated with GRB 060418, providing further evidence that a UV pumping mechanism is favored over collisional excitation (Vreeswijk et al., 2007). A distance of at least 1.7 kpc was derived for the absorber in this case, using the variability of the fine structure and metastable transitions. We have examined the metastable transitions for all of the very strong Mg ii absorbers in our GRB sample and do not detect any of these transitions.
4 Discussion of Intrinsic Origin of Excess GRB Very Strong Mg ii Absorbers
Our conclusion is that there is no significant evidence in support of a difference between the populations of very strong Mg ii absorbers found toward GRBs as compared to quasars. Any such difference could have been used to argue for a difference in the nature of the GRB absorbers. Given the outstanding issues with explanations involving dust bias, gravitational lensing, and partial beam covering, as discussed in § 1, we would expect such a difference to arise from an origin close to the GRB. The question now is how we should interpret the negative result, that is, an absence of any difference in the observed properties of GRB and quasar absorbers.
The most straightfoward explanation would be to say that material ejected from the GRB environment either does not exist or does not produce very strong Mg ii absorption. Indeed, the required velocities up to or are a challenge to models of the regions surrounding GRBs.
We could also say that, in view of the small sample size of GRB absorbers and the great diversity in the population of very strong Mg ii absorbers toward quasars, a difference would be hard to recognize. Another option is to embrace the similarity in physical conditions of the two population of Mg ii absorbers, quasars and GRB, and consider whether there could be similarities between their environments even in a model where GRB absorbers have an intrinsic origin.
As described in § 1, very strong Mg ii absorbers toward quasars are thought to arise from a mix of processes, with significant contributions from dense star-forming regions and from condensations in superwinds (Rao et al., 2006; Nestor et al., 2005; Beardmore et al., 2006b). Some GRBs also are thought to arise within star forming regions. It is intriguing to note that in the nearby universe, the Carina nebula, an indication of the structure of the interstellar medium near O stars, has absorption profiles very similar to those of some of the very strong Mg ii absorbers we are studying (Walborn et al., 2002). Perhaps similarities in the quasar intervening and GRB absorbers are the result of similar processes being involved.
On the other hand, it is worth noting that Hammer et al. (2006) have recently identified observational evidence for GRBs being associated with “runaway” type massive stars, rather than those that remain near their stellar nursery until death. At the same time, the host galaxies of these GRBs are Wolf-Rayet galaxies with luminous super star clusters and galaxy-scale outflows.
Of course, perhaps the most important difference between the intervening quasar absorbers and the immediate vicinity of the GRB is supplied by the intense radiation of the GRB itself. We have noted that there is an expectation that the GRB radiation field should destroy Mg i within tens of parsecs. Fox et al. (2008) proposed that high velocity components (– km s-1 relative to the GRB) detected in C iv absorption could be the result of Wolf-Rayet winds on such small scales. They suggest that only the cases without detected low-ionization absorption would be consistent with an origin in the immediate GRB environment. The GRB radiation field should also lead to populating the fine structure levels of various transitions at distances up to the kiloparsec scale, thus producing absorbers consistent with the claimed host galaxy absorption of many GRBs. These host galaxy absorbers are close to the redshift of the GRB and distinct from the absorbers that would produce the excess of very strong Mg ii absorption toward GRBs. There may seem to be little parameter space left for absorbers near to the GRB to have the physical conditions required.
However, one important analogy, already mentioned in § 1.4, makes us pause before dismissing an origin for the excess GRB absorbers close to the GRB. There is a population of intrinsic narrow absorption line systems observed in quasar spectra which appear to have their origin in the accretion disk wind of the quasar. In many cases these absorbers have relativistic ejection velocities, and they have ionization parameters and kinematic structures that are virtually indistinguishable from intervening absorbers, particularly C iv absorbers. In some cases, related low-ionization gas is detected. The obvious similarity in properties between these intrinsic quasar absorbers and some intervening quasar absorption line systems is despite the location of the intrinsic absorbers in the immediate vicinity of the quasar radiation flux. In order that they have the same ionization level they have to have gas densities many orders of magnitude higher than those in intervening absorbers. Despite their different acceleration mechanism and environment, their kinematic properties are somehow similar to those of the intervening absorbers. The only way to distinguish intrinsic from intervening narrow absorption line systems is through partial covering analysis, which is observed in only a subset of the intrinsic population (Misawa et al., 2007b). The other members of that intrinsic population remain hidden in intervening quasar absorption line samples.
We conclude by considering the requirements in order that excess very strong Mg ii absorbers seen toward GRBs arise in the GRB environment/host galaxy. The general similarity between the kinematics of the Mg ii profiles of GRB and quasar absorbers indicates that there are similar physical processes involved which are likely to be related to star formation. There is a requirement that the kinematic spread is large and, specifically, that the apparent ejection velocity is relativistic. Superwinds are not adequate for the latter, but interaction of the GRB shock wave with pre-existing material around it due to “hypernova” explosion could produce material with the required apparent ejection velocity.
To achieve relativistic velocities, it seems the absorbing material must be relatively close to the GRB radiation field, yet it must still be possible for Mg i to exist. For this, it seems that high densities and shielding would be necessary, in analogy with the situation for intrinsic narrow absorption lines in quasars. Also, we need to understand why absorption is not observed in fine structure transitions in view of the proximity to the GRB. Clearly, these requirements are restrictive and lead to some skepticism about an intrinsic origin. On the other hand, there is currently no more obvious explanation for the puzzling excess of very strong Mg ii absorbers toward GRBs.
In the small sample of GRB absorbers that we examined, we saw no clear difference with the quasar absorber population, but given the wide range of quasar absorber properties, a larger sample of GRB absorbers might be needed to see any such trend, if it is present. For example, perhaps some of the GRB absorbers that we have examined have particularly small Mg i equivalent widths. Given the small number of high-quality datasets in the present sample, detailed studies of the high resolution profiles of GRB absorbers are quite worthwhile to pursue for future GRBs. As here, future studies should take into account all of the observed chemical transitions and their kinematics. Through such an expanded sample, it may be finally possible to tell if the excess GRB Mg ii absorbers are telling us something about intervening absorbers or if they are telling us about some component of the environment of the GRB.
5 Summary of Results
We compared the properties of 8 very strong Mg ii absorbers ( Å) observed along 6 GRB line of sights to the properties of absorbers at similar redshifts along 81 quasar line of sights. Our aim was to investigate if the reported excess of found by Prochter et al. (2006) is caused by excess material in the immediate proximity of the GRB. More specifically, Prochter et al. (2006) found 14 absorbers toward 14 GRBs, where 3.8 would be expected from quasar statistics. Similarly, we would expect very strong Mg ii absorbers toward the GRBs in our sample and we find . This is not an independent datapoint from Prochter et al. (2006) since there is overlap between our samples, moreover the probability of us finding or very strong Mg ii absorbers in our GRB sample is not negligible. So, among the absorbers in our GRB sample, we might expect about half should have an origin in the GRB environment if an intrinsic hypothesis is valid. From Table. 2, we see that such an interpretation of the excess would require relativistic velocities, to at least .
Our challenge, then, was to find differences between an unknown subset of or of the GRB absorbers and the quasar absorbers which themselves constitute a varied sample of intervening environments and processes. Nonetheless, in the intense radiation field of a GRB, and in regions that are directly associated with active star formation, we might expect some differences. If the material is directly related to the GRB, and ejected relativistically from its immediate environment, we might expect strong kinematic and ionization differences compared to ordinary intervening absorbers.
In our analysis of GRB and quasar Mg ii absorption systems we have found no statistically significant differences:
- 1.
-
2.
The equivalent widths of low-ionization transitions (Mg i and Fe ii), dust tracers (Crii and Mnii), and intermediate/high-ionization transitions (Al iii and C iv) cover the same range of values for GRB absorbers as for quasar absorbers. The equivalent width distributions of Mg ii 2796 were not different between the two samples (among the Å absorbers), so it is meaningful to compare the absolute values of the equivalent widths of other transitions, rather than ratios. Many of the other transitions were only covered for the higher-redshift GRBs in our sample, and so the statistics for this comparison were more limited. We do note that several GRBs have particularly weak Mg i compared to quasar absorbers. If this is found to be common in a larger sample it would be of great interest, since it is expected that Mg i should not survive within 50 pc of a GRB (Prochaska et al., 2006);
-
3.
The distributions of the ratios of Fe ii to Mg ii equivalent widths did not differ significantly between the two samples. This statement applies to saturated Fe ii transitions as well as to Fe ii 2374, which was rarely saturated for these systems. There is a possible evolutionary trend found in this ratio for quasar very strong Mg ii absorber, with few large ratios of Fe ii to Mg ii at ; the GRB sample is not large enough to determine wether a similar trend holds;
-
4.
We used the ratio of the equivalent widths of various Fe ii transitions to that of Zn ii 2026 as an indication of the Fe/Zn ratio, which indicates dust depletion since zinc depletes more readily than iron. There is no statistical difference in the distributions, although one GRB absorber according to this metric ( toward GRB 060418) is confirmed to be particularly dusty (Ellison et al., 2006);
-
5.
The C iv doublet is covered for three of the GRB absorbers in our sample, and that region of the spectrum is noisy for two of the three. In these cases we find that kinematics and strength of the C iv absorption is not exceptional, compared to the range of these properties among the quasar absorbers;
-
6.
Fine structure and metastable transitions were not detected for any of the GRB absorbers in our sample. The fine structure lines are typically detected in association with the absorption systems that are believed to represent the GRB host galaxies. Such host galaxy absorption systems are observed and interpreted as occurring in regions tens of parsecs to several kiloparsecs from the GRB, where gas has been excited by UV pumping from the burst prompt emission or the early afterglow emission (Prochaska et al., 2006; Thöne et al., 2008; Vreeswijk et al., 2007). The absence of such fine structure lines in our sample suggests that a different region, or gas with a different density, must be responsible for the intervening very strong Mg ii absorption seen in many GRB afterglow spectra.
| GRB | UT start | Exposure (min) | coverage(nm) | References |
|---|---|---|---|---|
| 021004 | 2002, April 5.22 | 30 | 376-498;670-852; 866-1043 | (1)(2) |
| 021004 | 2002, April 5.23 | 30 | 302-392;473-580;576-680 | (1)(2) |
| 021004 | 2002, April 5.23 | 10 | 565-660 | (1)(2) |
| 021004 | 2002, April 5.24 | 60 | 452-560;568-665 | (1)(2) |
| 021004 | 2002, April 5.25 | 60 | 302-392;473-580;576-680 | (1)(2) |
| 021004 | 2002, April 5.28 | 60 | 376-498;670-852;866-1043 | (1)(2) |
| 050730 | 2005, July 31.01 | 3 | 302-392;473-580;576-680 | (2)(3) |
| 050730 | 2005, July 31.04 | 5 | 373-505;665-854;864-1008 | (2)(3) |
| 050820 | 2005, August 20.29 | 30 | 328-452;452-560;568-665 | (2)(4) |
| 050820 | 2005, August 20.32 | 30 | 328-452;452-560;568-665 | (2)(4) |
| 050820 | 2005, August 20.35 | 40 | 373-505;665-854;864-1008 | (2)(4) |
| 050922C | 2005, September 22.98 | 50 | 302-392;473-580;576-680 | (2)(4)(5) |
| 050922C | 2005, September 23.02 | 50 | 373-505;665-854;864-1008 | (2)(4)(5) |
| 060418 | 2006, April 14.13 | 3 | 328-452;452-560;568-665 | (6) |
| 060418 | 2006, April 14.14 | 5 | 328-452;452-560;568-665 | (6) |
| 060418 | 2006, April 14.15 | 10 | 328-452;452-560;568-665 | (6) |
| 060418 | 2006, April 14.15 | 20 | 328-452;452-560;568-665 | (6) |
| 060418 | 2006, April 14.17 | 40 | 328-452;452-560;568-665 | (6) |
| 060418 | 2006, April 14.20 | 80 | 376-498;670-852;866-1043 | (6) |
| 060607 | 2006, June 7.22 | 3 | 328-452;452-560;568-665 | (2)(4) |
| 060607 | 2002, June 7.23 | 5 | 328-452;452-560;568-665 | (2)(4) |
| 060607 | 2002, June 7.23 | 10 | 328-452;452-560;568-665 | (2)(4) |
| 060607 | 2002, June 7.24 | 20 | 328-452;452-560;568-665 | (2)(4) |
| 060607 | 2002, June 7.25 | 40 | 328-452;452-560;568-6650 | (2)(4) |
| 060607 | 2002, June 7.28 | 80 | 376-498;670-852;866-1043 | (2)(4) |
| 060607 | 2002, June 7.28 | 42 | 376-498;670-852;866-1043 | (2)(4) |
| Object | |||
|---|---|---|---|
| GRB060418 (1) | 1.49 | 0.6021 | 0.41 |
| GRB060418 (2) | 1.49 | 0.6554 | 0.38 |
| GRB060418 (3) | 1.49 | 1.1066 | 0.16 |
| GRB021004 (1) | 2.328 | 1.3800 | 0.32 |
| GRB021004 (2) | 2.328 | 1.6015 | 0.24 |
| GRB050820 (1) | 2.612 | 0.6910 | 0.64 |
| GRB050820 (2) | 2.612 | 1.4280 | 0.37 |
| GRB060607 | 3.08 | 1.7996 | 0.36 |
| 3C336 (1) | 0.9273 | 0.6561 | 0.1505 |
| 3C336 (2) | 0.9273 | 0.8913 | 0.0188 |
| Q1229-021 | 1.038 | 0.3951 | 0.3618 |
| Q1127-145 | 1.18 | 0.3127 | 0.4677 |
| Q1629+120 | 1.795 | 0.9002 | 0.3677 |
| Q0328-272 | 1.816 | 1.1228 | 0.2753 |
| Q1331+170 | 2.084 | 1.7766 | 0.1046 |
| HE1341-1020 | 2.134 | 1.2767 | 0.3091 |
| PKS0237-23 (1) | 2.224 | 1.3651 | 0.3003 |
| PKS0237-23 (2) | 2.224 | 1.6723 | 0.1855 |
| Q0551-3637 | 2.318 | 1.9609 | 0.1134 |
| Q0109-3518 | 2.35 | 1.3496 | 0.3405 |
| HE1122-1648 | 2.4 | 0.6822 | 0.6066 |
| HE2217 | 2.406 | 1.6922 | 0.2309 |
| Q0453-423 (1) | 2.66 | 0.7261 | 0.6361 |
| Q0453-423 (2) | 2.66 | 1.1498 | 0.3642 |
| Q0100+130 (1) | 2.681 | 0.2779 | 0.7848 |
| Q0100+130 (2) | 2.681 | 1.7969 | 0.2679 |
| Q0002 (1) | 2.76 | 0.8366 | 0.6147 |
| Q0002 (2) | 2.76 | 2.3019 | 0.1292 |
| Q1151+068 | 2.762 | 1.8191 | 0.2808 |
| Q0112+300 | 2.81 | 1.2452 | 0.4800 |
| Q0130-4021 | 3.03 | 0.9315 | 0.6264 |
| HE0940 | 3.083 | 1.7891 | 0.3636 |
| CTQ0298 | 3.37 | 1.0387 | 0.6427 |
| Q1418-064 | 3.689 | 1.4578 | 0.5689 |
| Q1621-0042 | 3.7 | 1.1335 | 0.6583 |
Note. — List of GRB and QSO systems identified, in increasing object redshift order, with rest frame EW( Å). The redshift of the object () is the quasar or GRB redshift, estimated by emission lines (in the QSO case) or multiple absorption features associated with the host galaxy redshift (for the GRB). The system redshifts are estimated combining information from different features aligned with the strong Mg iisystems. The last column reports the apparent “ejection” velocity, estimated assuming that the absorbing system is actually moving at a positive velocity respect the quasar or the GRB host galaxy.
| System | MgII2796 | MgII2803 | MgII2853 | FeII2383 | FeII2374 | FeII2587 | FeII2600 | MnII2577 | MnII2594 | MnII2606 | |
|---|---|---|---|---|---|---|---|---|---|---|---|
| GRB060418 (1) | 0.6021 | … | … | ||||||||
| GRB060418 (2) | 0.6554 | ||||||||||
| GRB050820 (1) | 0.6910 | … | |||||||||
| GRB060418 (3) | 1.1066 | ||||||||||
| GRB021004 (1) | 1.3800 | ||||||||||
| GRB050820 (2) | 1.4280 | ||||||||||
| GRB021004 (2) | 1.6015 | ||||||||||
| GRB060607 | 1.7996 | … | … | ||||||||
| Q0100+130 (1) | 0.27795 | … | … | … | … | … | … | … | |||
| Q1127-145 | 0.3127 | ||||||||||
| Q1229-021 | 0.3951 | … | … | ||||||||
| 3C336 (1) | 0.6561 | ||||||||||
| HE1122 | 0.6822 | … | |||||||||
| Q0453 (1) | 0.7261 | … | … | ||||||||
| Q0002 (1) | 0.8366 | … | |||||||||
| 3C336 (2) | 0.8913 | … | … | ||||||||
| Q1629+120 | 0.90025 | … | … | ||||||||
| Q0130-4021 | 0.9315 | … | … | … | … | ||||||
| CTQ0298 | 1.0387 | … | … | … | |||||||
| Q0328-272 | 1.1228 | ||||||||||
| Q1621-0042 | 1.1335 | … | … | … | … | … | … | ||||
| Q0453 (2) | 1.1498 | ||||||||||
| Q0112+0300 | 1.2452 | … | … | … | |||||||
| HE1341 | 1.2767 | ||||||||||
| Q0109 | 1.3496 | ||||||||||
| PKS0237 (1) | 1.3651 | ||||||||||
| Q1418-064 | 1.458 | … | … | … | … | … | … | … | |||
| PKS0237 (2) | 1.672334 | … | |||||||||
| HE2217 | 1.6922 | ||||||||||
| Q1331+170 | 1.777 | … | … | … | |||||||
| HE0940 | 1.789 | … | … | ||||||||
| Q0100+130 (2) | 1.79698 | … | … | ||||||||
| Q1151+068 | 1.8191 | … | … | ||||||||
| Q0551-3637 | 1.9609 | … | … | … | |||||||
| Q0002 (2) | 2.302 | … | … | … | … |
Note. — This table reports all the species searched in this study. Equivalent widths are reported at confidence level. Error values, in mÅ, are quoted in parenthesis. Upper limits are also reported.
| System | CrII2056 | CrII2062 | CrII2066 | AlIII1855 | AlIII1863 | NiII1710 | NiII1752 | CII | CIV | CIV | |
|---|---|---|---|---|---|---|---|---|---|---|---|
| GRB060418 (1) | 0.6021 | … | … | … | … | … | … | … | … | … | … |
| GRB060418 (2) | 0.6554 | … | … | … | … | … | … | … | … | … | … |
| GRB050820 (1) | 0.6910 | … | … | … | … | … | … | … | … | … | … |
| GRB060418 (3) | 1.1066 | 0. | … | … | … | ||||||
| GRB021004 (1) | 1.3800 | … | … | … | … | ||||||
| GRB050820 (2) | 1.4280 | … | … | … | … | … | … | … | … | … | … |
| GRB021004 (2) | 1.6015 | … | … | … | … | … | … | … | … | … | … |
| GRB060607 | 1.7996 | … | … | … | … | … | … | … | … | … | … |
| Q0100+130 (1) | 0.27795 | … | … | … | … | … | … | … | |||
| Q1127-145 | 0.3127 | … | … | … | … | … | … | … | … | … | … |
| Q1229-021 | 0.3951 | … | … | … | … | … | … | … | … | … | … |
| 3C336 (1) | 0.6561 | … | … | … | … | … | … | … | … | … | … |
| HE1122 | 0.6822 | … | … | … | … | … | … | … | … | … | … |
| Q0453 (1) | 0.7261 | … | … | … | … | … | … | … | … | … | … |
| Q0002 (1) | 0.8366 | … | … | … | … | … | … | ||||
| 3C336 (2) | 0.8913 | … | … | … | … | ||||||
| Q1629+120 | 0.90025 | … | … | … | … | … | … | … | … | ||
| Q0130-4021 | 0.9315 | … | … | … | … | … | … | … | … | ||
| CTQ0298 | 1.0387 | … | … | … | … | … | … | … | … | ||
| Q0328-272 | 1.1228 | … | … | … | … | ||||||
| Q1621-0042 | 1.1335 | … | … | … | … | … | … | … | |||
| Q0453 (2) | 1.1498 | … | … | … | … | … | … | … | … | … | |
| Q0112+0300 | 1.2452 | … | … | … | … | … | … | … | … | … | |
| HE1341 | 1.2767 | … | … | … | |||||||
| Q0109 | 1.3496 | … | … | … | … | ||||||
| PKS0237 (1) | 1.3651 | … | … | ||||||||
| Q1418-064 | 1.458 | … | … | … | … | … | … | … | … | … | … |
| PKS0237 (2) | 1.672334 | … | … | … | |||||||
| HE2217 | 1.6922 | … | |||||||||
| Q1331+170 | 1.777 | … | … | … | … | … | … | … | … | … | … |
| HE0940 | 1.789 | … | … | … | … | … | … | … | |||
| Q0100+130 (2) | 1.79698 | … | … | … | … | … | … | … | |||
| Q1151+068 | 1.8191 | … | … | … | … | … | … | ||||
| Q0551-3637 | 1.9609 | … | … | … | |||||||
| Q0002 (2) | 2.302 | … | … |
Note. — This table reports all the species searched in this study. Equivalent widths are reported at confidence level. Error values, in mÅ, are quoted in parenthesis. Upper limits are also reported.
| System | ZnII2026 | ZnII2063 | SiIV | SiIV | OI | NV | NV | |
|---|---|---|---|---|---|---|---|---|
| GRB060418(1) | 0.6021 | … | … | … | … | … | … | … |
| GRB060418 (2) | 0.6554 | … | … | … | … | … | … | … |
| GRB050820 (1) | 0.6910 | … | … | … | … | … | … | … |
| GRB060418 (3) | 1.1066 | … | … | … | … | … | ||
| GRB021004 (1) | 1.3800 | … | … | … | … | … | ||
| GRB050820 (2) | 1.4280 | … | … | … | … | … | ||
| GRB021004 (2) | 1.6015 | … | … | … | … | … | ||
| GRB060607 | 1.7996 | … | … | … | … | … | … | … |
| Q0100+130 (1) | 0.27795 | … | … | … | … | … | … | … |
| Q1127-145 | 0.3127 | … | … | … | … | … | … | … |
| Q1229-021 | 0.3951 | … | … | … | … | … | … | … |
| 3C336 (1) | 0.6561 | … | … | … | … | … | … | … |
| HE1122 | 0.6822 | … | … | … | … | … | … | … |
| Q0453 (1) | 0.7261 | … | … | … | … | … | … | |
| Q0002 (1) | 0.8366 | … | … | … | … | … | … | … |
| 3C336 (2) | 0.8913 | … | … | … | … | … | ||
| Q1629+120 | 0.90025 | … | … | … | … | … | … | |
| Q0130-4021 | 0.9315 | … | … | … | … | … | … | |
| CTQ0298 | 1.0387 | … | … | … | … | … | … | … |
| Q0328-272 | 1.1228 | … | … | … | … | … | ||
| Q1621-0042 | 1.1335 | … | … | … | … | … | … | … |
| Q0453 (2) | 1.1498 | … | … | … | … | … | … | … |
| Q0112+0300 | 1.2452 | … | … | … | … | … | … | … |
| HE1341 | 1.2767 | … | … | … | … | … | ||
| Q0109 | 1.3496 | … | … | … | … | |||
| PKS0237 (1) | 1.3651 | … | … | … | … | … | ||
| Q1418-064 | 1.458 | … | … | … | … | … | … | … |
| PKS0237 (2) | 1.672334 | … | … | … | … | … | ||
| HE2217 | 1.6922 | … | … | … | … | |||
| Q1331+170 | 1.777 | … | … | … | … | |||
| HE0940 | 1.789 | … | … | … | … | … | … | |
| Q0100+130 (2) | 1.79698 | … | … | … | … | … | ||
| Q1151+068 | 1.8191 | … | … | … | … | … | … | |
| Q0551-3637 | 1.9609 | … | … | |||||
| Q0002 (2) | 2.302 | … | … | … |
Note. — This table reports all the species searched in this study. Equivalent widths are reported at confidence level. Error values, in mÅ, are quoted in parenthesis. Upper limits are also reported.
Fig. Set1. GRB sample
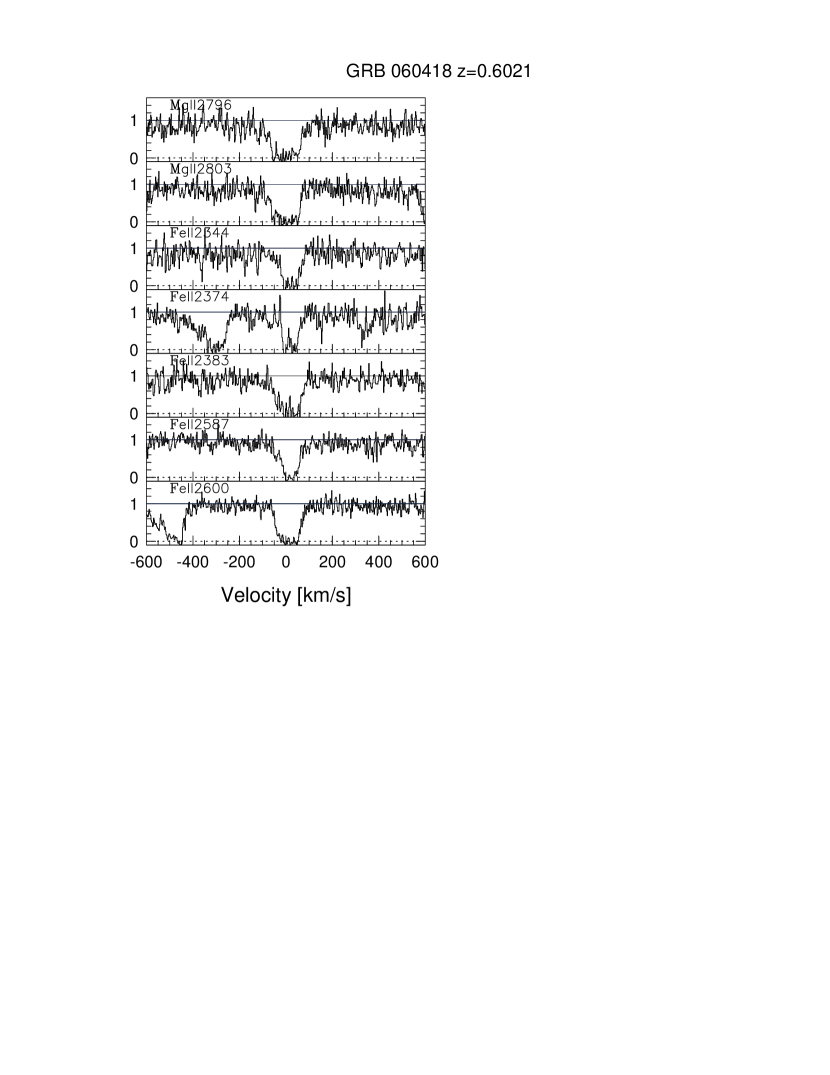
Fig. Set2. GRB sample


References
- Baltz & Hui (2005) Baltz, E. A. & Hui, L. 2005, ApJ, 618, 403
- Beardmore et al. (2006b) Beardmore, A., Mateos, S., & Page, K. 2006b, GCN notice 4733
- Berger et al. (2005) Berger, E., Penprase, B. E., Fox, D. B., Kulkarni, S. R., Hill, G., Schaefer, B., & Reed, M. 2005, ArXiv Astrophysics e-prints
- Blandford & McKee (1976) Blandford, R. D. & McKee, C. F. 1976, Physics of Fluids, 19, 1130
- Bouché et al. (2006) Bouché, N., Murphy, M. T., Péroux, C., Csabai, I., & Wild, V. 2006, MNRAS, 371, 495
- Bouché et al. (2007) Bouché, N., Murphy, M. T., Péroux, C., Davies, R., Eisenhauer, F., Förster Schreiber, N. M., & Tacconi, L. 2007, ApJ, 669, L5
- Campana et al. (2007) Campana, S., Lazzati, D., Ripamonti, E., Perna, R., Covino, S., Tagliaferri, G., Moretti, A., Romano, P., Cusumano, G., & Chincarini, G. 2007, ApJ, 654, L17
- Churchill et al. (2000) Churchill, C. W., Mellon, R. R., Charlton, J. C., Jannuzi, B. T., Kirhakos, S., Steidel, C. C., & Schneider, D. P. 2000, ApJ, 543, 577
- Churchill & Vogt (2001) Churchill, C. W. & Vogt, S. S. 2001, AJ, 122, 679
- D’Elia et al. (2007) D’Elia, V., Fiore, F., Meurs, E. J. A., Chincarini, G., Melandri, A., Norci, L., Pellizza, L., Perna, R., Piranomonte, S., Sbordone, L., Stella, L., Tagliaferri, G., Vergani, S. D., Ward, P., Angelini, L., Antonelli, L. A., Burrows, D. N., Campana, S., Capalbi, M., Cimatti, A., Costa, E., Cusumano, G., Della Valle, M., Filliatre, P., Fontana, A., Frontera, F., Fugazza, D., Gehrels, N., Giannini, T., Giommi, P., Goldoni, P., Guetta, D., Israel, G., Lazzati, D., Malesani, D., Marconi, G., Mason, K., Mereghetti, S., Mirabel, F., Molinari, E., Moretti, A., Nousek, J., Perri, M., Piro, L., Stratta, G., Testa, V., & Vietri, M. 2007, A&A, 467, 629
- Ding et al. (2003a) Ding, J., Charlton, J. C., Bond, N. A., Zonak, S. G., & Churchill, C. W. 2003a, ApJ, 587, 551
- Ding et al. (2003b) Ding, J., Charlton, J. C., Churchill, C. W., & Palma, C. 2003b, ApJ, 590, 746
- Ellison (2006) Ellison, S. L. 2006, MNRAS, 368, 335
- Ellison et al. (2009) Ellison, S. L., Murphy, M. T., & Dessauges-Zavadsky, M. 2009, MNRAS, 392, 998
- Ellison et al. (2006) Ellison, S. L., Vreeswijk, P., Ledoux, C., Willis, J. P., Jaunsen, A., Wijers, R. A. M. J., Smette, A., Fynbo, J. P. U., Møller, P., Hjorth, J., & Kaufer, A. 2006, MNRAS, 372, L38
- Ferguson et al. (1995) Ferguson, T. S., Genest, C., & Hallin, M. 1995, Kendall s tau for autocorrelation
- Fiore et al. (2005) Fiore, F., D’Elia, V., Lazzati, D., Perna, R., Sbordone, L., Stratta, G., Meurs, E. J. A., Ward, P., Antonelli, L. A., Chincarini, G., Covino, S., Di Paola, A., Fontana, A., Ghisellini, G., Israel, G., Frontera, F., Marconi, G., Stella, L., Vietri, M., & Zerbi, F. 2005, ApJ, 624, 853
- Fox et al. (2008) Fox, A. J., Ledoux, C., Vreeswijk, P. M., Smette, A., & Jaunsen, A. O. 2008, A&A, 491, 189
- Frank et al. (2007) Frank, S., Bentz, M. C., Stanek, K. Z., Mathur, S., Dietrich, M., Peterson, B. M., & Atlee, D. W. 2007, Ap&SS, 312, 325
- Ganguly & Brotherton (2008) Ganguly, R. & Brotherton, M. S. 2008, ApJ, 672, 102
- Garnavich et al. (2000) Garnavich, P. M., Loeb, A., & Stanek, K. Z. 2000, ApJ, 544, L11
- Hammer et al. (2006) Hammer, F., Flores, H., Schaerer, D., Dessauges-Zavadsky, M., Le Floc’h, E., & Puech, M. 2006, A&A, 454, 103
- Hao et al. (2007) Hao, H., Stanek, K. Z., Dobrzycki, A., Matheson, T., Bentz, M. C., Kuraszkiewicz, J., Garnavich, P. M., Howk, J. C., Calkins, M. L., Worthey, G., Modjaz, M., & Serven, J. 2007, ApJ, 659, L99
- Hirose et al. (2006) Hirose, Y., Umemura, M., Yonehara, A., & Sato, J. 2006, ApJ, 650, 252
- Kacprzak et al. (2008) Kacprzak, G. G., Churchill, C. W., Steidel, C. C., & Murphy, M. T. 2008, AJ, 135, 922
- Königl & Granot (2002) Königl, A. & Granot, J. 2002, ApJ, 574, 134
- Loeb & Perna (1998) Loeb, A. & Perna, R. 1998, ApJ, 495, 597
- Masiero et al. (2005) Masiero, J. R., Charlton, J. C., Ding, J., Churchill, C. W., & Kacprzak, G. 2005, ApJ, 623, 57
- Ménard et al. (2008) Ménard, B., Nestor, D., Turnshek, D., Quider, A., Richards, G., Chelouche, D., & Rao, S. 2008, MNRAS, 385, 1053
- Metzger et al. (1997) Metzger, M. R., Djorgovski, S. G., Kulkarni, S. R., Steidel, C. C., Adelberger, K. L., Frail, D. A., Costa, E., & Fronterra, F. 1997, Nature, 387, 879
- Misawa et al. (2007a) Misawa, T., Charlton, J. C., Eracleous, M., Ganguly, R., Tytler, D., Kirkman, D., Suzuki, N., & Lubin, D. 2007a, ApJS, 171, 1
- Misawa et al. (2007b) Misawa, T., Eracleous, M., Charlton, J. C., Ganguly, R., Tytler, D., Kirkman, D., Suzuki, N., & Lubin, D. 2007b, in Astronomical Society of the Pacific Conference Series, Vol. 373, The Central Engine of Active Galactic Nuclei, ed. L. C. Ho & J.-W. Wang, 291–+
- Mshar et al. (2007) Mshar, A. C., Charlton, J. C., Lynch, R. S., Churchill, C., & Kim, T.-S. 2007, ApJ, 669, 135
- Narayanan et al. (2007) Narayanan, A., Misawa, T., Charlton, J. C., & Kim, T.-S. 2007, ApJ, 660, 1093
- Narayanan et al. (2004) Narayanan, D., Hamann, F., Barlow, T., Burbidge, E. M., Cohen, R. D., Junkkarinen, V., & Lyons, R. 2004, ApJ, 601, 715
- Nardini et al. (2006) Nardini, M., Ghisellini, G., & Ghirlanda, G. 2006, A&A, 451, 821
- Nardini et al. (2008) —. 2008, MNRAS, 386, L87
- Nestor et al. (2005) Nestor, D. B., Turnshek, D. A., & Rao, S. M. 2005, ApJ, 628, 637
- Piranomonte et al. (2008) Piranomonte, S., Ward, P. A., Fiore, F., Vergani, S. D., D’Elia, V., Krongold, Y., Nicastro, F., Meurs, E. J. A., Chincarini, G., Covino, S., Della Valle, M., Fugazza, D., Norci, L., Sbordone, L., Stella, L., Tagliaferri, G., Gerhels, N., Burrows, D. N., Goldoni, P., Malesani, D., Mirabel, I. F., Pellizza, L. J., & Perna, R. 2008, ArXiv e-prints
- Piro et al. (2000) Piro, L., Garmire, G., Garcia, M., Stratta, G., Costa, E., Feroci, M., Mészáros, P., Vietri, M., Bradt, H., Frail, D., Frontera, F., Halpern, J., Heise, J., Hurley, K., Kawai, N., Kippen, R. M., Marshall, F., Murakami, T., Sokolov, V. V., Takeshima, T., & Yoshida, A. 2000, Science, 290, 955
- Pontzen et al. (2007) Pontzen, A., Hewett, P., Carswell, R., & Wild, V. 2007, MNRAS, 381, L99
- Porciani et al. (2007) Porciani, C., Viel, M., & Lilly, S. J. 2007, ApJ, 659, 218
- Prochaska (2006) Prochaska, J. X. 2006, ApJ, 650, 272
- Prochaska et al. (2006) Prochaska, J. X., Chen, H.-W., & Bloom, J. S. 2006, ApJ, 648, 95
- Prochaska et al. (2008) Prochaska, J. X., Dessauges-Zavadsky, M., Ramirez-Ruiz, E., & Chen, H.-W. 2008, ApJ, 685, 344
- Prochaska et al. (2009) Prochaska, J. X., Sheffer, Y., Perley, D. A., Bloom, J. S., Lopez, L. A., Dessauges-Zavadsky, M., Chen, H.-W., Filippenko, A. V., Ganeshalingam, M., Li, W., Miller, A. A., & Starr, D. 2009, ApJ, 691, L27
- Prochter et al. (2006) Prochter, G. E., Prochaska, J. X., Chen, H.-W., Bloom, J. S., Dessauges-Zavadsky, M., Foley, R. J., Lopez, S., Pettini, M., Dupree, A. K., & Guhathakurta, P. 2006, ApJ, 648, L93
- Rao et al. (2006) Rao, S. M., Turnshek, D. A., & Nestor, D. B. 2006, ApJ, 636, 610
- Rodriguez Hidalgo et al. (2007) Rodriguez Hidalgo, P., Hamann, F., Nestor, D., & Shields, J. 2007, in Astronomical Society of the Pacific Conference Series, Vol. 373, The Central Engine of Active Galactic Nuclei, ed. L. C. Ho & J.-W. Wang, 287–+
- Sako et al. (2005) Sako, M., Harrison, F. A., & Rutledge, R. E. 2005, ApJ, 623, 973
- Savaglio (2006) Savaglio, S. 2006, New Journal of Physics, 8, 195
- Starling et al. (2005) Starling, R. L. C., Vreeswijk, P. M., Ellison, S. L., Rol, E., Wiersema, K., Levan, A. J., Tanvir, N. R., Wijers, R. A. M. J., Tadhunter, C., Zaurin, J. R., Gonzalez Delgado, R. M., & Kouveliotou, C. 2005, A&A, 442, L21
- Stocke & Rector (1997) Stocke, J. T. & Rector, T. A. 1997, ApJ, 489, L17+
- Sudilovsky et al. (2007) Sudilovsky, V., Savaglio, S., Vreeswijk, P., Ledoux, C., Smette, A., & Greiner, J. 2007, ApJ, 669, 741
- Tejos et al. (2007) Tejos, N., Lopez, S., Prochaska, J. X., Chen, H.-W., & Dessauges-Zavadsky, M. 2007, ApJ, 671, 622
- Thöne et al. (2008) Thöne, C. C., Wiersema, K., Ledoux, C., Starling, R. L. C., de Ugarte Postigo, A., Levan, A. J., Fynbo, J. P. U., Curran, P. A., Gorosabel, J., van der Horst, A. J., Llorente, A., Rol, E., Tanvir, N. R., Vreeswijk, P. M., Wijers, R. A. M. J., & Kewley, L. J. 2008, A&A, 489, 37
- van Marle et al. (2007) van Marle, A. J., Langer, N., & García-Segura, G. 2007, A&A, 469, 941
- Vietri et al. (2001) Vietri, M., Ghisellini, G., Lazzati, D., Fiore, F., & Stella, L. 2001, ApJ, 550, L43
- Vreeswijk et al. (2007) Vreeswijk, P. M., Ledoux, C., Smette, A., Ellison, S. L., Jaunsen, A. O., Andersen, M. I., Fruchter, A. S., Fynbo, J. P. U., Hjorth, J., Kaufer, A., Møller, P., Petitjean, P., Savaglio, S., & Wijers, R. A. M. J. 2007, A&A, 468, 83
- Walborn et al. (2002) Walborn, N. R., Fullerton, A. W., Crowther, P. A., Bianchi, L., Hutchings, J. B., Pellerin, A., Sonneborn, G., & Willis, A. J. 2002, ApJS, 141, 443
- Wang et al. (2003) Wang, L., Baade, D., & Höflich, G. 2003, Archiv.org, astro-ph/0301266v1
- Wang et al. (2002) Wang, X. Y., Dai, Z. G., & Lu, T. 2002, MNRAS, 336, 803
- Watson et al. (2007) Watson, D., Hjorth, J., Fynbo, J. P. U., Jakobsson, P., Foley, S., Sollerman, J., & Wijers, R. A. M. J. 2007, ApJ, 660, L101
- Wessels et al. (2009) Wessels, K., Charlton, J., Narayanan, A., Mshar, A., & Cucchiara, A. 2009, in American Astronomical Society Meeting Abstracts, Vol. 213, American Astronomical Society Meeting Abstracts, 482.06–+
- Zitouni et al. (2008) Zitouni, H., Daigne, F., Mochkovich, R., & Zerguini, T. H. 2008, MNRAS, 386, 1597