Magnetic frustration on the diamond lattice of the A-site magnetic spinels CoAl2-xGaxO4: The role of lattice expansion and site disorder
Abstract
The spinels CoB2O4 with magnetic Co2+ ions on the diamond lattice A site can be frustrated because of competing near-neighbor () and next-near neighbor () interactions. Here we describe attempts to understand these interactions by substitution on the non-magnetic B-site. The system we employ is CoAl2-xGaxO4, where Al is systematically replaced by the larger Ga, ostensibly on the B site. Ga substitution has the effect of expanding the lattice and pushes Co atoms on the A-site further away from one another weakening the magnetic interactions. We also find, however, that Ga distributes between the B and the A site in a concentration dependent manner displacing an increasing amount of Co from the A site for larger values of . This site mixing, confirmed by powder neutron diffraction studies carried out at room temperature, affects magnetic properties very significantly and changes the nature of the ground state. We discuss the role that both structural changes play in changing the degree of magnetic frustration on the diamond lattice. We also use classical Monte-Carlo modeling of the magnetic coupling to illustrate the complexity of the interactions that arises from site mixing.
pacs:
75.50.Ee,75.40.Mg,I Introduction
The presence of magnetic frustration in the solid state is known to give rise to multiple, nearly degenerate and often non-collinear magnetic ground states.Ramirez (1994); Greedan (2001); Fennie and Rabe (2006) Interest in the competition between these ground states has attracted considerable attention in recent years with the resurgent field of multiferroics: systems with spiral spin ordering are known to couple spin and lattice degrees of freedomKatsura et al. (2005); Mostovoy (2006); Sergienko and Dagotto (2006) and in specific cases, to even give rise to spontaneous polarization.Tokura (2006); Yamasaki et al. (2006)
One highly studied class of materials that has been shown to exhibit this type of non-collinear ordering resulting from magnetic frustration is the spinel family.Lawes et al. (2006); Tackett et al. (2007) Spinels have the general formula AB2X4, and in so-called normal spinels, the A site is divalent and tetrahedrally coordinated by the anion X, while the B site is trivalent and octahedrally coordinated by the anion X (typically O or S). Both sites can accommodate magnetic cations allowing for a wide range of magnetic properties. It is important to note that these sites are often not well ordered and as a consequence it is frequently appropriate to write the formula as (A1-δBδ)(AδB2-δ)X4 where is referred to as the inversion parameter and can be any value 0 1.
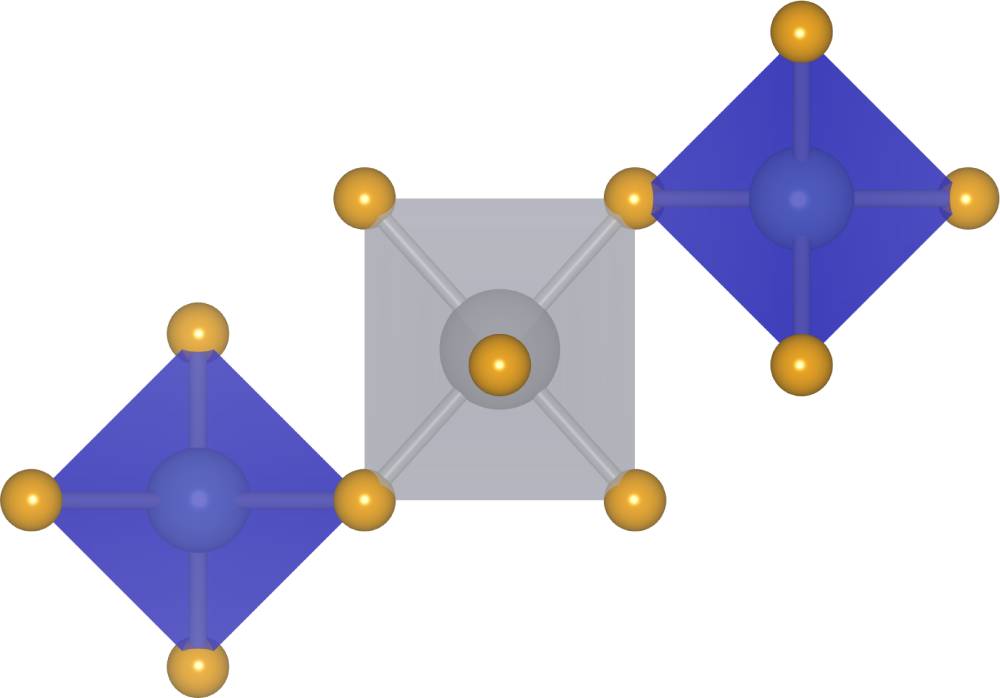
The spinel structure can be viewed as two interpenetrating sublattices with B atoms forming a pyrochlore lattice while the A atoms constitute a diamond lattice.Anderson (1956) It is well known that there are multiple magnetic interactions in these systems. Here we focus mostly on the nearest neighbor () and next nearest neighbor () exchange interactions on the diamond lattice using the compound CoAl2O4 as a starting point (Fig. 1). Since the diamond lattice can be broken down further into two interpenetrating face-centered cubic (fcc) sublattices, we can envisage as coupling the two fcc sublattices to each other and coupling nearest neighbors within each sublattice.Bergman et al. (2007)
In a recent work Tristan et al. demonstrated that normal spinels, , with magnetic cations on the A site and non-magnetic cations on the B site can exhibit strong magnetic frustration.Tristan et al. (2005) These A-site magnetic spinels have been studied in the past by RothRoth (1964) and Blasse.Blasse (1963) Recent modelling studies by Bergman et al. suggested that the magnitude of the ratio can strongly influence the dominant magnetic ground state in these systems.Bergman et al. (2007) In the limit that , the magnetic ordering is a simple Néel state (magnetically speaking, a diamond to zinc blende transition). As the ratio becomes larger, the nature of the magnetic ground state can change from Néel to a complex spiral pattern with the spirals oriented parallel to (111) planes. Tristan et al.Tristan et al. (2008) have also recently examined solid solutions between CoAl2O4 and Co3O4 to investigate the effect of the B site cation in the superexchange pathways that connects neighboring A sites.
These recent studies have encouraged us to attempt to alter this ratio of in these A-site magnetic spinels by controlling interatomic spacings through appropriate substitution on the B site of the spinel structure. We use Ga substitution ostensibly on the B site of spinels CoAl2-xGaxO4 as a means of separating the Co from one another, given that Ga3+ is significantly larger than Al3+ (the respective 6-coordinate radii are 0.62 Å and 0.535 Å).Shannon (1976) We find that while the effect of such substitution is indeed to steadily increase the distance between neighboring Co atoms, there is the additional effect that site inversion in the structure steadily increases simultaneously. While separating the effects of these simultaneous changes in the structure is dificult, we discuss the role each change plays in the context of the altered frustration parameter.
II Experimental details
Polycrystalline samples of the compounds were prepared using ceramic routes. Cobalt oxalate (CoC2O2H2O) was mixed with stoichiometric amounts of Ga2O3 and Al2O3 and intimately ground with ethanol in an agate mortar. The powders were then pressed into 13 mm pellets and fired in air in alumina crucibles at 800∘C for 24 h. The pellets were then reground, pressed again into pellets, and fired at 1200∘C (1000∘C for =0.0) for 12 h. In order to obtain equilibrated samples, all pellets were annealed by heating to 700∘C for 12 h, cooling to 400∘C at a rate of 3∘C min-1, soaking at 400∘C for 120 hPorta and Anichini (1980) followed by cooling in the furnace to the room temperature. For all heat treatments, pellets were placed on a bed of powder with the same stoichiometry to minimize reaction with the crucible.
X-ray diffraction patterns were obtained using CuK radiation on a Philips XPERT MPD diffractometer operated at 45 kV and 40 mA. Phase purity was determined by refining the patterns using the Rietveld method as implemented in the xnd Rietveld code.Bérar and Baldinozzi (1998) Neutron diffraction data were collected on the neutron powder diffractometer (NPDF) at the Lujan Center at Los Alamos National Laboratory at room temperature, on samples sealed in vanadium cans.Proffen et al. (2002) Neutron diffraction data were refined using the Rietveld method as implemented in the expgui-gsas software suite.Larson and Von Dreele (2000); Toby (2001). Local structures as obtained from pair distribution function (PDF) analysis of the total neutron scattering were extracted from the total scattering data using the program PDFgetNPeterson et al. (2000) and with a maximum momentum transfer Å-1. The obtained PDFs were analyzed using the PDFgui software package.Farrow et al. (2007) DC magnetization was measured using a Quantum Design MPMS 5XL SQUID magnetometer.
III Computational Details
Classical Monte Carlo simulations of the magnetic behavior of the system were performed using the ALPS project’s spinmc application.Albuquerque et al. (2007) A custom lattice with periodic boundary conditions was generated for each simulation run in order to allow disorder averaging. The lattice generation code first randomly selected an A site and then moved its spin to a B site, also chosen at random and independent of the position of the A site. The simulation was then run using a Heisenberg Hamiltonian with and bonds as described above, and with impurity bonds connecting spins on B sites with their nearest-neighbor occupied A sites. Finally, because the typical error bars obtained from each Monte Carlo susceptibility simulation were negligible (about relative error), the error bars plotted represent only variation due to the presence of disorder as obtained by averaging over several runs.
A numerically calculated inverse susceptibility curve was fit to the experimental curves as follows: first, using the fact that the Curie-Weiss temperature for the -- model with an inversion parameter, , is given by
| (1) |
one can calculate the value of necessary to match the experimentally measured Curie-Weiss temperature. This value of is then used to scale the temperature by a factor of and the inverse susceptibility by a factor of . Such a fitting procedure always guarantees that the high temperature behavior of the simulation data is in exact agreement with that of the experimental data.
IV Results
IV.1 Structure
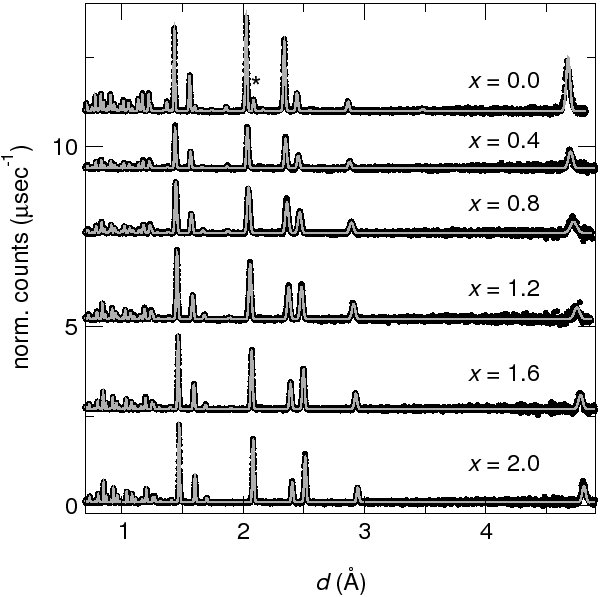
Rietveld analysis of the highest -spacing bank (from four banks of data for each sample) of time-of-flight neutron diffraction data are displayed in Fig. 2 for the different spinel samples. There were no peaks in the diffraction data that could not be assigned to either the spinel phase or a small Al2O3 impurity in the = 0.0 sample, indicating no magnetic impurities and that a complete solid solution is achieved for all values of . The oxygen stoichiometry refined within error to the correct stoichiometric value excluding the possibility that any of the Co2+ was oxidized to Co3+. Given the close-packed nature of the oxygen lattice this was not surprising. From the Rietveld analysis, evolution of the lattice parameter, site occupancy of the cations on the A site, and the internal structural parameter (the of oxygen) are presented in the different panels of Fig. 3. It is seen that substitution of the larger Ga3+ for Al3+ results in the spinel unit cell edge increasing from 8.1 Å to 8.3 Å. The Végard law is not strictly followed, and for all intermediate values, the cell parameter is slightly reduced from the values suggested by a weighted average of the end-members.
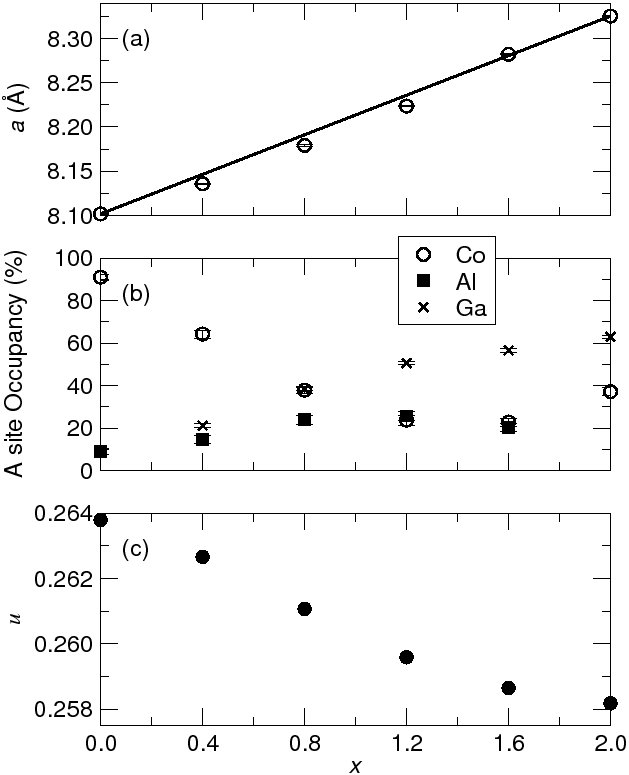
Panel (b) of Fig. 3 shows the results of allowing all ions, Al, Ga, and Co to distribute themselves between the A and B sites in the refinements, with the constraint that the total amounts of the different atoms were as dictated by the starting stoichiometry. The process of achieving this refinement involved declaring on each of the A and B sites, two separate Co atoms, one of which exchanged with Al and the other with Ga. A related procedure has been described by Joubert et al.Joubert et al. (1998) Due to the nature of multiple constraints in the refinements, errors on the occupancies are likely to be underestimated. It is noted from Fig. 3(b) that as larger amounts of Ga are substituted into the system an increasing displacement of Co from the tetrahedral site to the octahedral site occurs. While it might be expected that the Ga3+ ions would prefer the octahedral site based upon its large size, the amount of Ga3+ found on the smaller tetrahedral site steadily increases across the substitution series. In contrast Al3+ ions are found to remain mostly normal with a tetrahedral site occupancy never exceeding 20 %. The site preference of Ga3+ for the tetrahedral site is in agreement with the tendency of Ga3+ to adopt hybridization. In fact, from electrostatic arguments MillerMiller (1959) has determined that the relative octahedral site preference of Al3+ and Ga3+ are respectively 2.5 kcal mol-1 and 15.4 kcal mol-1 with the larger number indicative of the greater octahedral preference. In contrast, Co2+ has a site preference energy of 10.5 kcal mol-1. Nakatsuka et al.Nakatsuka et al. (2003) have conducted a recent study on the energetics of different local bonding configurations and found that replacing the relatively large Co2+ ( = 0.58 Å) on the tetrahedral site with Al3+ ( = 0.39 Å) results in abnormally long bond lengths which is not favored. This effect is not as pronounced when Ga3+ moves to the tetrahedral site given the larger radius ( = 0.47 Å) and that the end member CoGa2O4 is commonly found to be almost completely inverted.Nakatsuka et al. (2006) Site mixing also serves to explain the deviation from the Végard law that is observed in Fig. 3(a).
In Fig. 3(c), the internal parameter reflecting the position of oxygen is displayed for the different compounds in the series. It is seen that with increasing , this value progressively decreases. Hill et al.Hill et al. (1979) have pointed out that in normal spinels (without any inversion) this parameter depends on the ratio of the octahedral to tetrahedral bond lengths according to:
| (2) |
The expected values for ordered CoAl2O4 and CoGa2O4 using the appropriate ionic radiiShannon (1976) would be respectively 0.265 and 0.261. The observed trend of a decreasing agrees with this expectation for the normal end-members. However, we see from Fig. 3(c) that while CoAl2O4, with very small inversion has an experimentally determined value very close to what is calculated from equation 2, the value determined for CoGa2O4 ( = 0.258) is significantly smaller than suggested by equation 2. Again, we believe this discrepancy arises because of the growing inversion in the compounds as increases.
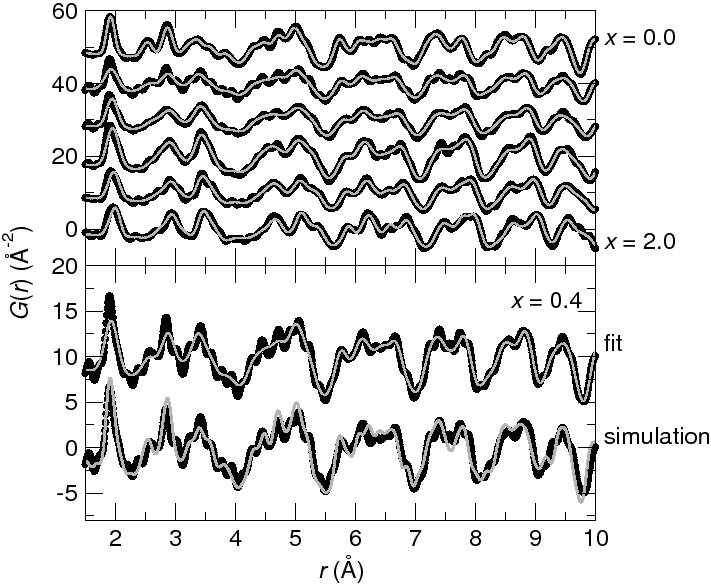
The pair distribution functions extracted from total scattering neutron diffraction are shown for each composition in Fig. 4(a) along with fits (shown as lines) obtained by refining the average spinel unit cells with the appropriate site inversion. Several characteristics can be observed directly. The unit cell expansion is apparent in the movement of atom-atom peaks to longer with increasing . The first atom-atom peak become increasingly broad as increases, perhaps as a result of increased site mixing, in turn resulting in a distribution of cation-oxygen distances. Furthermore, features in the intermediate compositions can be linked to the CoAl2O4 and CoGa2O4 end-member PDFs, with an increasing resemblance to the CoGa2O4 PDF as increases.
Refinements in real space were carried out starting with the average structure results. A stable refinement of the site occupancies could not be achieved and values were therefore fixed to the results obtained from the Rietveld analysis of the neutron scattering data. The parameters refined in the PDF analysis include lattice parameters, isotropic atomic displacement parameters for each atomic species, a scale factor, and quadratic peak sharpening. The refinements yielded and less than 15 % for -ranges from 1 to 20 Å. From the fits of the PDF displayed in Fig. 4(a), it is seen that of all the samples, only in the data corresponding to the = 0.0 sample are all the peaks well described by the model. This is keeping with the fact that only in the = 0.0 sample does the average spinel structure accurately describe all the local distances, since this structure has the lowest inversion and no substitution.
In Fig. 4(a), this is shown for a particular sample with = 0.4. The experimental PDF is only very poorly fit in the short region by the average structure model (labeled “fit”). Upon close inspection of the = 0.4 refinement around 3 Å and 5 Å, which correspond respectively to the first and second nearest Co neighbors, there is significant splitting of the experimental peaks which is not well represented by the average structure. However, a much better description of the = 0.4 sample is a stoichiometrically weighted (80:20) average of the experimental PDFs of the end members ( = 0.0 and = 2.0) rather than as a single phase as illustrated in Fig. 4(b). In this, a resemblance to systems such as In1-xGaxAsJeong et al. (2001) is noted wherein the alloy compositions locally follow the bonding rules of the end-member structures, and alloy PDFs can be described using weighted averages of the end members. This result of averaging end-members only holds true for distances within a unit cell (approximately 8 Å). Outside of this range the superposition model begins to fail and the average structure proves to be a good model of the data. Thus from the local structure analysis we can see that our samples have a homogeneous distribution of substituted cations and there does not seem to be any evidence for local clustering of cations.
IV.2 Magnetism
| Compound | () | (K) | (K) | Reference | ||
|---|---|---|---|---|---|---|
| = 0.0 | 0.09 | 4.59 | -103 | 12 | 8.6 | this work |
| = 0.4 | 0.36 | 4.80 | -96 | 5.3 | 18 | |
| = 0.8 | 0.62 | 4.83 | -75 | 7.3 | 10 | |
| = 1.2 | 0.76 | 4.83 | -54 | 8.3 | 6.5 | |
| = 1.6 | 0.77 | 4.80 | -45 | 9.0 | 5.0 | |
| = 2.0 | 0.63 | 4.84 | -42 | 9.2 | 4.6 | |
| CoGa2O4 | 0.29 | 4.96 | -55 | 10 | 5.5 | Fiorani and Viticoli,1978 |
| CoAl2O4 | 0.04 | -89 | 9 | 10 | Suzuki et al.,2007 | |
| Co3O4 | 0.00 | -110 | 30 | 3.7 | Suzuki et al.,2007 | |
| CoRh2O4 | 0.00 | -31 | 25 | 1.2 | Suzuki et al.,2007 |
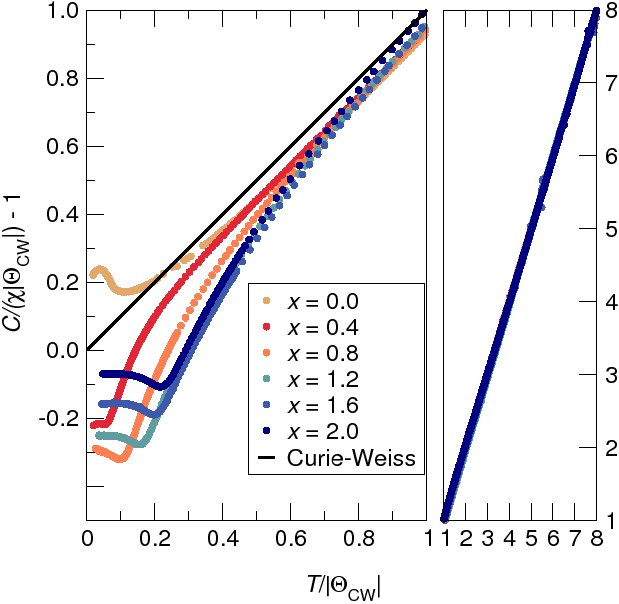
Figure 5 displays the temperature dependence of the DC magnetic susceptibility of the different spinel samples on a single scaled plot. For all samples, data between 350 K and 400 K were fit with high reliability by the Curie-Weiss formula: , where is the Curie constant, and is the Curie-Weiss ordering temperature. We can recast this formula as:
| (3) |
Evidence of Curie-Weiss behavior at high temperatures is seen from the right, higher temperature, panel of Fig. 5. For each sample, and at all temperatures above the individual (indicated in Table 1, and approximately ranging between -100 K and -40 K) the scaled inverse susceptibility (left-hand side of equation 3) is precisely equal to . All the samples order at temperatures well below as seen in the left-hand low-temperature panel of Fig. 5. A curious point to note is that while all the samples display a downturn in plots of vs. , it is only the = 0.0 sample, CoAl2O4, that stays largely superior to the dotted Curie-Weiss line. The behavior of = 0.0 is distinctly different from all other samples which progressively deviate from the dotted Curie-Weiss line at higher temperatures as increases. The utility of plotting the inverse susceptibility of a solid solution in the manner shown in Fig. 5 becomes evident in the way compounds with uncompensated spins due to inversion () are separated from the antiferromagnetic = 0.0 end member Melot et al. (2009). A plot of vs. does not reveal this since the magnititude of the susceptilities varies through the series.
Table 1 also shows values of obtained from the Curie constant for the different spinel samples. The expected spin-only value of the magnetic moment for tetrahedral Co2+ is 3.88 whereas a value of 5.20 Day and Selbin (1960) is expected for systems with completely unquenched orbital contribution. The values obtained here run between 4.59 and 4.85 , and are therefore sandwiched by the limits of the completely quenched and unquenched orbital contributions. Measured values from the literature are in the range of 4.4 to 4.8 .Day and Selbin (1960) Cossee and van ArkelCossee and van Arkel (1960) have argued that for tetrahedral Co2+, the proximity of a low-lying excited spin state adds a temperature-independent term to the Curie-Weiss law and that after making such a correction, magnetic moment is close to 4.4 . We expect CoAl2O4, with a very small degree of inversion, to display a value which is close to 4.4 . We find that for in the substitution series, the value of is always larger than for = 0.0, which we attribute to the increasing amount of octahedral Co2+ which has a larger orbital contribution to the effective moment and correspondingly has an experimental range of from 4.7 to 5.2 .Day and Selbin (1960)
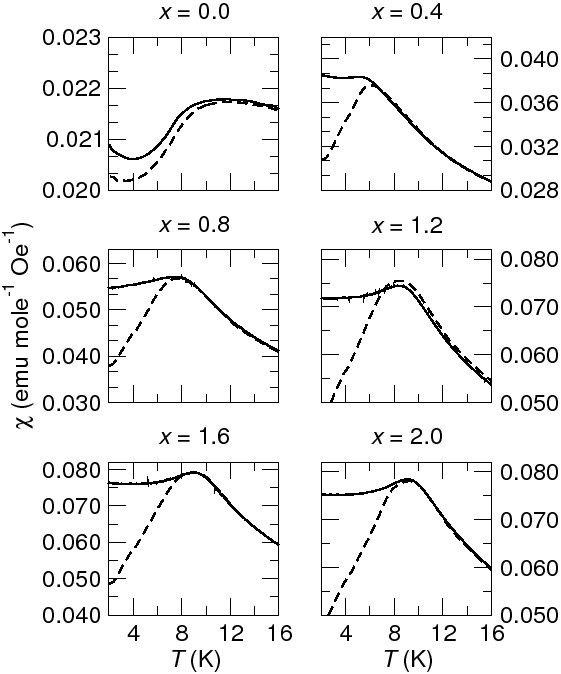
Figure 6 shows in closer detail, the temperature dependence of the magnetic susceptibilities of the title spinel compounds at low temperatures. All the compounds display splitting of the FC and ZFC data between 4 K and 12 K. CoAl2O4 ( = 0.0) shows very little irreversibility and only a gentle downturn near 12 K. Below 4 K, there is a small upturn in the susceptibility which could arise from uncompensated spins. All other compounds with show the characteristic cusps of glassy systems associated with freezing of spins and no long range order as may be expected for crystographically disordered antiferromagnets. For all samples was taken as the point of splitting between the ZFC and FC curves.
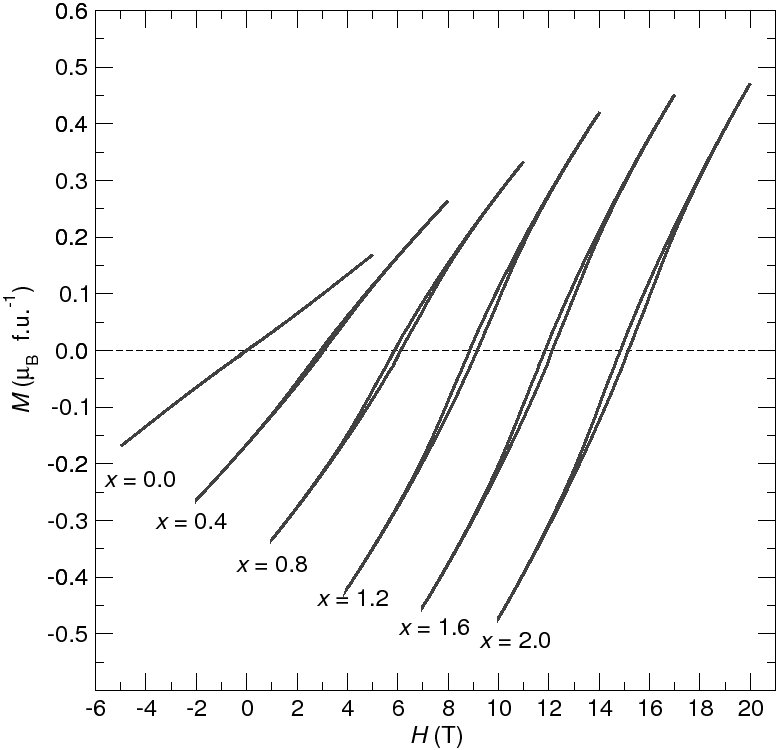
A gradual opening of the traces as is increased is seen in Fig. 7 which accompanies the increasing concentration of Co atoms on the octahedral site. As the magnetic ions enter the B site the A-B interaction begins to dominate Blasse (1963); Ederer and Komelj (2007), and even though both sites have the same number of spins, this interaction can give rise to uncompensated spins which could open the loops due to the unequal number of A and B sites. The near neighbor antiferromagnetic interaction between Co on the A and B sites, which are only separated by a single O atom will compete strongly with the pure A-A interactions where the magnetic ions are separated by OBO linkages. This interaction thereby adds another competing exchange pathways which may prevent long range antiferromagnetic order between Co atoms on the tetrahderal sites from being achieved and give rise to glassy behavior instead.Soubeyroux et al. (1986) It should also be noted for high enough concentrations of Co2+ on the B site that a ferromagnetic direct exchange between neighboring B-B atoms will begin to arise which could also give rise to the open loops. Diaz et al. (2006)
For higher concentrations of Ga, it can be seen in Table 1 and Fig. 8 (a) that gradually decreases. Comparing the title compounds with systems that have a well ordered magnetic A lattice such as Co3O4 and CoRh2O4 shows an almost linear dependence of with respect to nearest neighbor separation (and correspondingly next-near neighbor A-A separation). We note that the deviation from the linear trend for samples with can be understood by the site mixing in the samples reducing the number of magnetic cations on the A site. Further evidence that this the deviation from linearity is a result of site disorder is the fact that a separate report on a sample CoGa2O4 with half of the site mixing present in our samples lays on the line.
The structural changes also affect the temperature where the system transitions from the paramagnetic to glassy state which we take to occur where the zero field cooling and field cooling data deviate as discussed earlier (Fig. 8 (a)). For small concentrations of Ga with = 0.4, a sharp drop of the transition temperature to 5 K from 10 K for the pure CoAl2O4 which we attribute to the sudden increase in atomic disorder and dilution of the magnetic A site lattice Binder and Young (1986). This decrease is then followed by a gradual increase as more Al is replaced by Ga. Tristan et al. have studied the effect of replacing the Al3+ with non-magnetic octahedral Co3+. Tristan et al. (2008) It is interesting to note that changes in the non-magnetic B site cation result in little to no change in , however a clear increase in the ordering temperature is observed.
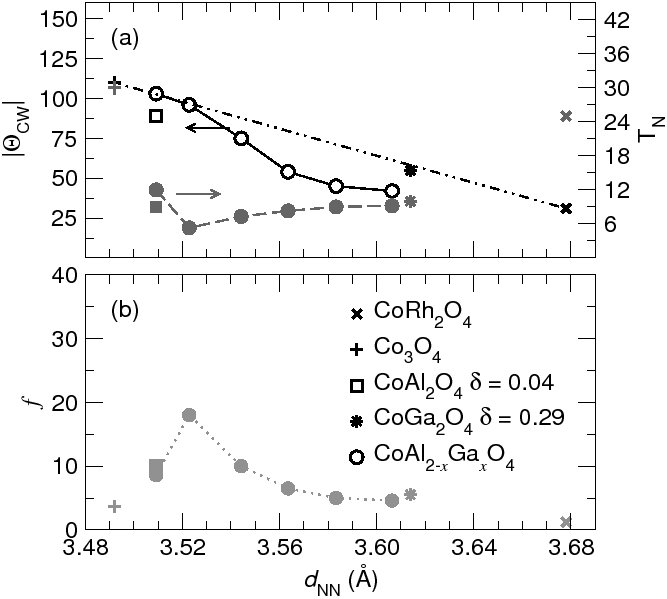
Figure 8 (b) plots the measured frustration parameter, , as a function of , the separation between A ions in the different structures, including values for Co3O4 and CoRh2O4 taken from the literature. Considering the changes in and we find with the exception of = 0.4 the frustration index decreases systematically with increasing separation.
In order to better understand the behavior of the samples, we performed classical Monte Carlo simulations of the - model on the A-site spinel lattice, introducing a certain amount of inversion randomly each time a simulation run was performed. We also assumed that impurity spins occupying B sites interact with their nearest neighbors on occupied A sites via a Heisenberg exchange coupling .
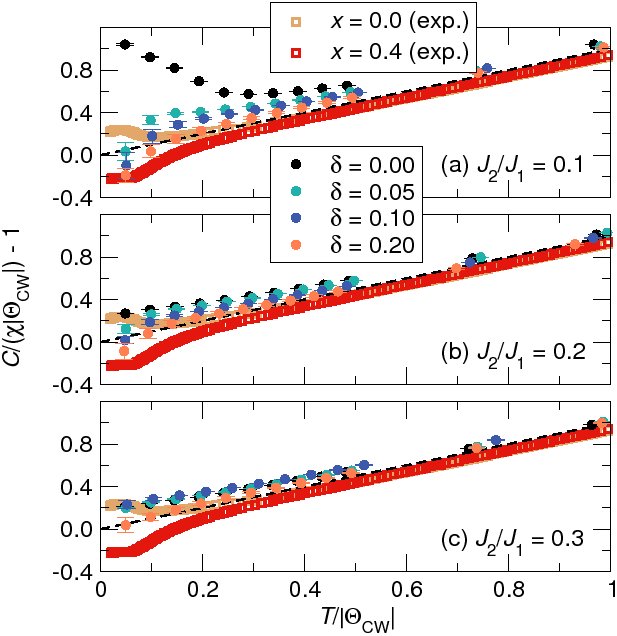
In Fig. 9, we show the results of a scan of various parameters. was set to , , and while the inversion set to , , and . The ratio was fixed to throughout the scan. After plotting the resulting inverse susceptibilities in the manner described in eqn. 3, we can make a few qualitative observations. As expected, increasing increases the frustration of the system in the sense that it lowers the temperature at which evidence of ordering appears. Additionally upon introducing even a small amount of inversion, the behavior of the susceptibility below the Curie-Weiss temperature rapidly changes from antiferromagnetic (sharp upward kink) to ferrimagnetic (smooth downturn) in rough qualitative agreement with the experimental results.
We also attempted to use the model to fit the individual susceptibility curves of the various experimental samples with mixed success. We first conducted simulations of the model with no inversion, in which case the fit was controlled by only one parameter, namely . These simulations were all performed on a system consisting of a cube of 64 conventional unit cells (512 spins), though for certain values of , simulations were also done using a system of 125 unit cells (1000 spins) to check for finite size effects, which were found to be negligible for the susceptibility data.
Although all of the inverse susceptibility curves produced from the numerics for the case were systematically above the experimental data, they showed the correct qualitative behavior in that they exhibited an upward turning kink, presumably at the ordering temperature . By increasing the value of until is around to (and correspondigly a between and Kelvin), the transition temperature was brought into approximate agreement with the experimentally observed value as shown in Fig. 10. We also considered simulations with small amounts of inversion between 1 and 2% given that even pure CoAl2O4 exhibits a small amount of disorder. However, unless we ran our simulations with a value of far from the range that gave a good fit to the doped sample with (discussed next), such a small amount of disorder changed the resulting susceptibilities very little.
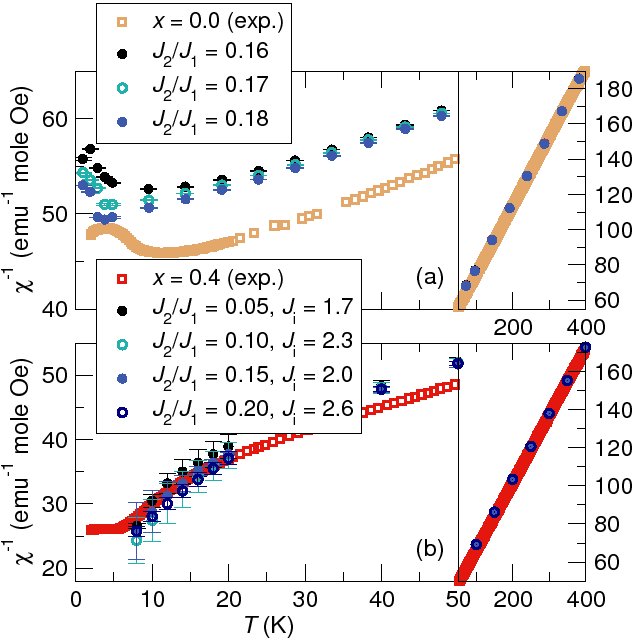
We have also fit the data by running simulations with an inversion of . To improve the disorder averaging, the simulations were done using a supercell (1000 spin) with the data presented here being the average of three independent runs. As in the case above, all of the inverse susceptibility data produced by the Monte Carlo simulations was systematically larger than the experimental curve excluding the region below the downturn. Interestingly the data could be fit equally well by a range of and values, as long as both parameters were increased together, as can be seen from Fig. 10. Since it is probably reasonable to assume that decreases slightly from the value obtained for the sample, we can take between and and find that the ratio should lay between and whereas is found to be between and K.
It is worth noting at this point that if we judge the quality of the fit in a least-squares sense, the Curie-Weiss law describes the data better than the numerical susceptibility data given that the numerical data lies above the experimental data through a wide temperature range for which a straight line fits the experimental data almost perfectly. Despite this fact, it is valuable to see that the simulation data exhibits the same qualitative low temperature behavior as the experiments. One possible explanation for the deviation between the theory and experimental data, aside from the assumption that only nearest and next nearest neighbor exchange play a role, is the possible over simplification of the factor. One way to improve our simulations would be to allow for a temperature dependent or also assigning a different value of to each site.
Finally, we attempted to fit the experimental susceptibilities for the samples with and were unable to obtain a good fit without changing the and by an unreasonable amount. For every set of parameters considered, the numerically calculated inverse susceptibilities exhibited strong downturns and dropped far below the experimental curve after initially matching at high temperature. Though the reasons for this negative result are somewhat unclear, it seems that either the appropriate and ratios are very far from those found above or more likely the use of only two parameters is an over simplification considering that atomic disorder will locally modify exchange pathways and make the true exchange couplings site dependent. This possibility is supported by the PDFs presented which show the local bond lengths of the end members is retained upon substitution. Such behavior may indicate that substitution actually generates new competing values which are not accounted for in our Monte-Carlo simulations rather than a simple modification to the existing pathways as may have been expected.
V Summary
We have attempted to understand the nature of the magnetic frustration in the A-site magnetic spinels CoAl2-xGaxO4 by substituting Ga for Al, in the hope of decreasing the relative magnetic coupling between near and next-near A atom neighbors. We have found, however, that in the compounds presented there is a significant mixing of the A and B sites in the Ga-rich samples, and this inversion has a significant influence on the magnetic coupling. The complexity of the structural changes which occur with substitution of Ga make isolating the influence of lattice expansion and site mixing a significant challenge. We have used Monte Carlo calculations to demonstrate the importance of site mixing through a change of shape in the simulated susceptibility curves which agrees closely with our experimental findings. By comparing with samples that are perfectly ordered such as Co3O4 and CoRh2O4, we have demonstrated that there appears to be a trend in which the frustration index depends weakly upon the separation between magnetic ions. We have also used a variety of structural characterizations and magnetic measurements to demonstrate how both lattice expansion and site mixing can simultaneoulsy influence the frustration parameter.
Acknowledgements
We thank A. P. Ramirez for advice in representing the magnetic data and SungBin Lee for assistance in understanding the Monte Carlo fits. We gratefully acknowledge the National Science Foundation for support through a Career Award (NSF-DMR 0449354) to RS, a Graduate Student Fellowship to KP, and for MRSEC facilities (Award NSF-DMR 0520415). This work has benefited from the use of NPDF at the Lujan Center at Los Alamos Neutron Science Center, funded by DOE Office of Basic Energy Sciences under DOE contract DE-AC52-06NA25396.
References
- Ramirez (1994) A. Ramirez, Annu. Rev. Mater. Sci. 24, 453 (1994).
- Greedan (2001) J. E. Greedan, J. Mater. Chem. 11, 37 (2001).
- Fennie and Rabe (2006) C. J. Fennie and K. M. Rabe, Phys. Rev. Lett. 97, 267602 (2006).
- Katsura et al. (2005) H. Katsura, N. Nagaosa, and A. V. Balatsky, Phys. Rev. Lett. 95, 057205 (2005).
- Mostovoy (2006) M. Mostovoy, Phys. Rev. Lett. 96, 067601 (2006).
- Sergienko and Dagotto (2006) I. A. Sergienko and E. Dagotto, Phys. Rev. B 73, 094434 (2006).
- Tokura (2006) Y. Tokura, Science 312, 1481 (2006).
- Yamasaki et al. (2006) Y. Yamasaki, S. Miyasaka, Y. Kaneko, J.-P. He, T. Arima, and Y. Tokura, Phys. Rev. Lett. 96, 207204 (2006).
- Lawes et al. (2006) G. Lawes, B. Melot, K. Page, C. Ederer, M. A. Hayward, T. Proffen, and R. Seshadri, Phys. Rev. B 74, 024413 (2006).
- Tackett et al. (2007) R. Tackett, G. Lawes, B. C. Melot, M. Grossman, E. S. Toberer, and R. Seshadri, Phys. Rev. B 76, 024409 (2007).
- Anderson (1956) P. W. Anderson, Phys. Rev. 102, 1008 (1956).
- Bergman et al. (2007) D. Bergman, J. Alicea, E. Gull, S. Trebst, and L. Balents, Nature Physics 3, 487 (2007).
- Tristan et al. (2005) N. Tristan, J. Hemberger, A. Krimmel, H.-A. K. von Nidda, V. Tsurkan, and A. Loidl, Phys. Rev. B 72, 174404 (2005).
- Roth (1964) W. L. Roth, J. Phys. France 25, 507 (1964).
- Blasse (1963) G. Blasse, Philips Res. Rept. 18, 383 (1963).
- Tristan et al. (2008) N. Tristan, V. Zestrea, G. Behr, R. Klingeler, B. Büchner, H. A. K. von Nidda, A. Loidl, and V. Tsurkan, Phys. Rev. B. 77, 094412 (2008).
- Shannon (1976) R. D. Shannon, Acta Crystallogr. A 32, 751 (1976).
- Porta and Anichini (1980) P. Porta and A. Anichini, J. Chem. Soc. Faraday Trans. 76, 2448 (1980).
- Bérar and Baldinozzi (1998) J. Bérar and G. Baldinozzi, IUCr-CPD Newsletter 20, 3 (1998).
- Proffen et al. (2002) T. Proffen, T. Egami, S. J. L. Billinge, A. K. Cheetham, D. Louca, and J. B. Parise, Appl. Phys. A. 74, S163 (2002).
- Larson and Von Dreele (2000) A. C. Larson and R. B. Von Dreele, Los Alamos National LaboratoryReport LAUR 86-748 (2000) 86, 748 (2000).
- Toby (2001) B. Toby, J. Appl. Cryst. 34, 210 (2001).
- Peterson et al. (2000) P. F. Peterson, M. Gutmann, T. Proffen, and S. J. L. Billinge, J. Appl. Crystallogr. 33, 1192 (2000).
- Farrow et al. (2007) C. L. Farrow, P. Juhas, J. W. Liu, D. Bryndin, E. S. Bozin, J. Bloch, T. Proffen, and S. J. L. Billinge, J. Phys.: Condens. Matter 19, 335219 (7pp) (2007).
- Albuquerque et al. (2007) A. Albuquerque, F. Alet, P. Corboz, P. Dayal, A. Feiguin, S. Fuchs, L. Gamper, E. Gull, S. Gurtler, and A. H. et al., J. Magn. Magn. Mater. 310, 1187 (2007).
- Joubert et al. (1998) J.-M. Joubert, R. Cerný, M. Latroche, A. Percheron-Guégan, and K. Yvon, J. Appl. Crystallogr. 31, 327 (1998).
- Miller (1959) A. Miller, J. Appl. Phys. 30, 24S (1959).
- Nakatsuka et al. (2003) A. Nakatsuka, Y. Ikeda, Y. Yamasaki, N. Nakayama, and T. Mizota, Solid State Communications 128, 85 (2003).
- Nakatsuka et al. (2006) A. Nakatsuka, Y. Ikeda, N. Nakayama, and T. Mizota, Acta Crystallographica Section E 62, i109 (2006).
- Hill et al. (1979) R. J. Hill, J. R. Craig, and G. V. Gibbs, Phys. Chem. Minerals 4, 317 (1979).
- Jeong et al. (2001) I.-K. Jeong, F. Mohiuddin-Jacobs, V. Petkov, S. J. L. Billinge, and S. Kycia, Phys. Rev. B 63, 205202 (2001).
- Fiorani and Viticoli (1978) D. Fiorani and S. Viticoli, Sol. State Comm. 25, 155 (1978).
- Suzuki et al. (2007) T. Suzuki, H. Nagai, M. Nohara, and H. Takagi, J. Phys.: Condens. Matter. 19, 145265 (2007).
- Melot et al. (2009) B. C. Melot, J. E. Drewes, R. Seshadri, E. M. Stoudenmire, and A. P. Ramirez, J. Phys.: Condens. Matter 21, 216007 (2009).
- Day and Selbin (1960) M. C. Day and J. Selbin, Theoretical Inorganic Chemistry (Reinhold Book Corporation, 1960), 2nd ed.
- Cossee and van Arkel (1960) P. Cossee and A. E. van Arkel, J. Phys. Chem. Solid. 15, 1 (1960).
- Ederer and Komelj (2007) C. Ederer and M. Komelj, Physical Review B (Condensed Matter and Materials Physics) 76, 064409 (pages 9) (2007).
- Soubeyroux et al. (1986) J. Soubeyroux, D. Fiorani, and E. Agostinelli, J. Magn. Magn. Mater. 54-57, 83 (1986).
- Diaz et al. (2006) S. Diaz, S. de Brion, G. Chouteau, B. Canals, V. Simonet, and P. Strobel, Phys. Rev. B 74, 092404 (2006).
- Binder and Young (1986) K. Binder and A. P. Young, Rev. Mod. Phys. 58, 801 (1986).