The Origin of the 24 Excess in Red Galaxies
Abstract
Observations with the have revealed a population of red sequence galaxies with a significant excess in their 24 emission compared to what is expected from an old stellar population. We identify 900 red galaxies with from the AGN and Galaxy Evolution Survey (AGES) selected from the NOAO Deep Wide-Field Survey Boötes field. Using MIPS, we classify 89 (10%) with 24 infrared excess (f0.3mJy). We determine the prevalence of AGN and star-formation activity in all the AGES galaxies using optical line diagnostics and mid-IR color-color criteria. Using the IRAC color-color diagram from the IRAC Shallow Survey, we find that 64% of the 24 excess red galaxies are likely to have strong PAH emission features in the 8 IRAC band. This fraction is significantly larger than the 5% of red galaxies with f0.3mJy that are estimated to have strong PAH emission, suggesting that the infrared emission is largely due to star-formation processes. Only 15% of the 24 excess red galaxies have optical line diagnostics characteristic of star-formation (64% are classified as AGN and 21% are unclassifiable). The difference between the optical and infrared results suggest that both AGN and star-formation activity is occurring simultaneously in many of the 24 excess red galaxies. These results should serve as a warning to studies that exclusively use optical line diagnostics to determine the dominant emission mechanism in the infrared and other bands. We find that 40% of the 24 excess red galaxies are edge-on spiral galaxies with high optical extinctions. The remaining sources are likely to be red galaxies whose 24 emission comes from a combination of obscured AGN and star-formation activity.
Subject headings:
galaxies: elliptical and lenticular, cD — galaxies: starburst — infrared: galaxies — quasars: general1. Introduction
The optical color-magnitude relation of galaxies shows a clear bimodality, with a narrow sequence of red (predominantly spheroidal) galaxies and a “blue cloud” of actively star-forming galaxies (e.g., Strateva et al. 2001, Hogg et al. 2004). Studies of the evolution of the red galaxy luminosity function suggest that the stellar mass within the red sequence has increased since , perhaps by a factor of (Bell et al. 2004; Faber et al. 2007; Brown et al. 2007). The most likely cause of this growth is the transition of blue cloud galaxies to red sequence galaxies at . Recent semi-analytic models of galaxy formation support such a scenario (e.g., Croton et al. 2006). In order to reproduce the color bimodality, one or more mechanisms must be introduced to shut down the star-formation (e.g., Somerville & Primack 1999), and turn blue galaxies red. Some authors suggest that feedback from merger-induced AGN activity could be the quenching mechanism (e.g., Hopkins et al. 2006, Georgakakis et al. 2008), while others suggest that supernovae in a starburst galaxy may have the required energy to blow out enough gas (Benson et al., 2003). Other possible mechanisms include virial shock heating of the galaxy halo (Birnboim et al., 2007) or simple gas consumption. If we are to understand how galaxies shut off their star-formation and become red, it is clearly important to identify and study the population of sources that have recently moved onto the red sequence or are in a transition region between the red sequence and blue cloud commonly referred to as the “green valley”. These sources may still show signs of AGN and/or residual star-formation as they move onto the red sequence.
Optical studies of the stellar populations of red galaxies generally show them to be dominated by an old component (e.g., Tinsley 1968), with perhaps a “frosting” of stars formed since =1 (e.g., Trager et al. 2005). In studies of local ellipticals, the weak infrared emission is usually attributed to mass loss from the evolved stellar population (Temi et al. 2005; Bressan et al. 2006). However, there has been recent evidence from and that both hidden AGN and star-formation activity may occur in red galaxies out to (e.g., Brand et al. 2005, Rodighiero et al. 2007, Davoodi et al. 2006). More than half of all red galaxies have narrow emission lines in their optical spectra indicative of AGN activity (e.g., Yan et al. 2006; Graves et al. 2007).
We have identified a population of red galaxies with relatively strong 24 emission (f0.3 mJy; hereafter “24 excess” red galaxies). The redshift range 0.150.3 allows us to use both optical and infrared diagnostics to determine whether they are likely to be dominated by AGN or star-formation activity. We use starburst templates (Dale & Helou, 2002) to estimate the total infrared luminosities of L at = 0.15 (0.3). Assuming that all the dust heating is due exclusively to star formation processes and adopting the Salpeter (1955) IMF (0.1-100 ), this corresponds to SFRs of 2 (5) M (Kennicutt, 1998). This infrared luminosity is orders of magnitude larger than expected from local ellipticals (which have infrared luminosities from 5 - 7; Devriendt et al. 1999) and suggests optically obscured activity in these galaxies. Similar results are found by Rodighiero et al. (2007) for spheroidal galaxies in GOODS (Dickinson et al., 2003) and by Davoodi et al. (2006) for z red galaxies in SWIRE (Lonsdale et al., 2003).
In this paper, we investigate the nature of the 24 excess in these galaxies. We use mid-IR colors to determine whether the sources have significant polycyclic aromatic hydrocarbon (PAH) emission features that are known to be strong in luminous star-forming galaxies. We also use optical line diagnostics to distinguish between photo-ionization by young massive stars in star-forming HII regions and by AGN. The nature of the 24 emission from optically selected AGN and other populations will be explored further in W. Rujopakarn in preparation.
A cosmology of , =0.3, and =0.7 is assumed throughout. All optical magnitudes are on the Vega system.
2. Data
Our sample is selected from the AGN and Galaxy Evolution Survey (AGES; C. S. Kochanek et al. in prep.; J. Moustakas et al. in prep.). AGES is an optical spectroscopic survey conducted within the Boötes field of the NOAO Deep Wide-Field survey (NDWFS; Jannuzi & Dey 1999). The survey was carried out in 2004 and 2005 using the Hectospec multi-fiber spectrograph (Fabricant et al. 1998; Fabricant et al. 2005) at the MMT 6.5m telescope. Successful redshifts were measured for nearly 20,000 objects. For our analysis, we use the AGES “main galaxy sample”, which is statistically complete for , after correcting for sparse sampling, fiber incompleteness, and redshift failures (see Eisenstein et al., in preparation for details). The AGES sparse sampling preferentially targets brighter optical galaxies and/or sources detected in other wavelengths and results in roughly half of the total 19.95 sample with good quality optical spectra. We account for any selection effects in which one type of source is selected more frequently than another by applying a correcting weight to each galaxy (each individual galaxy is weighted by the inverse of the known sampling rate of galaxies with similar properties). The final percentages of red, green, blue and 24 excess red galaxies with different optical and infrared classifications only changes by a few percent at the most.
The optical spectroscopy covers the wavelength range 3700-9200Å at a FWHM resolution of 6Å. The AGES spectra were reduced using standard procedures implemented in , a customized Hectospec reduction package. The rest-frame optical emission lines were modeled using Gaussian line profiles, after carefully subtracting the underlying stellar continuum using the Bruzual & Charlot (2003) population synthesis models; additional details regarding the AGES data reduction and emission line measurements can be found in J. Moustakas et al. in preparation.
The Boötes field covers a contiguous 9.3 square degree area and has a plethora of existing multi-wavelength imaging and spectroscopy. The field has been mapped in , , and bands to median 3 point source depths of 27.7, 26.7, and 26.0 (Vega) respectively. The Spitzer Space Telescope (Werner et al., 2004) has imaged the field at 24, 70, and 160 using the Multiband Imaging Photometer for (MIPS; Rieke et al. 2004) to 5 rms depths of 0.3 mJy, 25 mJy, and 150 mJy respectively, yielding a catalog of 22,000 sources. has also imaged the field with the Infrared Array Camera (IRAC; Fazio et al. 2004) to 5 depths of 6.4, 8.8, 51, and 50 Jy at 3.6, 4.5, 5.8, and 8 respectively (Eisenhardt et al., 2004).
3. Source Selection
We have selected a sample of 3889 galaxies from the AGES survey that have spectroscopic redshifts, and absolute V-band magnitudes of M-19.4 mag. This redshift range allows the IRAC color-color diagram to be used as a diagnostic for the presence of PAH emission (with the strong PAH emission features redshifted into the observed 8 band) and ensures that we cover the rest-frame wavelengths of several powerful emission line diagnostics, including H, H, [OIII] 4959,5007, and [NII] 6548,6584. At absolute magnitudes fainter that M-19.4 mag, the number of red galaxies decreases significantly. Our absolute optical magnitude cut ensures that we are comparing red and blue galaxies within a similar absolute magnitude range. The optical magnitude cut also ensures that these are galaxies selected from the main AGES sample (with 19.95) that has easily quantifiable selection effects. The rest-frame optical luminosities and colors were computed using (v. 4.1.4; Blanton et al. 2003; Blanton & Roweis 2007). For more details, the reader is referred to J. Moustakas et al. in preparation.
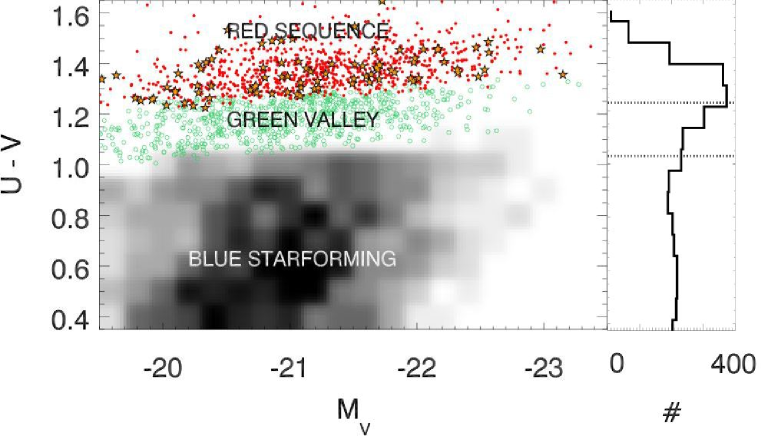
We classify the galaxies into “red sequence” (914 sources) and “blue cloud” (2255 sources) using the following rest-frame selection criteria:
Red Sequence:
| (1) |
Blue Cloud:
| (2) |
The 720 sources that fall between these criteria on the color-magnitude diagram are classified as “green valley” sources. Figure 1 shows the color-magnitude diagram for the entire sample divided into the different classifications. The selection criterion for red sequence galaxies is similar to that of Brown et al. (2007), although we adopt a slightly redder cut to limit contamination and do not employ any optical or infrared apparent magnitude color cuts.
Of the 914 red galaxies, 89 (10%) have 24 flux densities, f0.3mJy ([24]16.1 mag). We refer to this population as “24 excess” red galaxies (red galaxies with f0.3 mJy are referred to as “24 faint” red galaxies). All of these have IRAC 3.6 detections and we expect all 24 matches to be that of a true counterpart (we expect only 0.07% of our galaxies to have 24 matches within a radius of 2″of the 24 position by coincidence). We note that our use of f0.3mJy to define “24 excess” red galaxies is a somewhat arbitrary limit determined by the depth of our MIPS 24 data. It does however correspond to infrared luminosities of L at = 0.15 (0.3) that are orders of magnitude higher than we would expect from an old stellar population (see Section 1).
4. Results
In this Section, we use infrared colors, optical line diagnostics, optical morphology, and mean multi-wavelength spectral energy distributions to investigate the nature of the 24 excess red galaxies. Only 8/914 (1%) of the red galaxies have X-ray detections in the XBoötes Chandra survey (Kenter et al. 2005; Brand et al. 2006). The X-ray survey limit corresponds to an X-ray luminosity of 5 (2 ) ergs s-1 at =0.15 (0.3). The small number of detections suggests that any X-ray emission from AGN is generally either weak or obscured and so we do not discuss the X-ray emission further.
4.1. The IRAC Color-Color Diagram
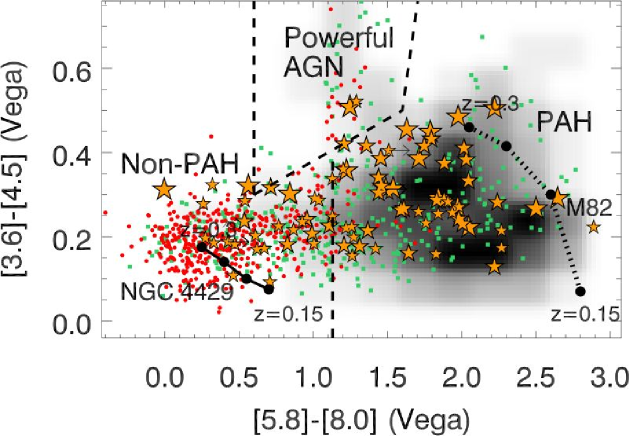
The IRAC color-color diagram (e.g., Lacy et al. 2004; Stern et al. 2005; Gorjian et al. 2008) has been shown to be a reliable way of identifying high redshift AGN. Figure 2 shows the IRAC color-color diagram for the AGES galaxies at 0.150.3. The vast majority of sources have [3.6]-[4.5] colors consistent with them being low redshift galaxies (e.g., Stern et al. 2005). The red and blue galaxies show a striking bimodality in [5.8]-[8.0] color (this is also demonstrated in Assef et al. 2008). The blue galaxies have redder [5.8]-[8.0] colors which is likely due to the strong 6.2 and 7.7 PAH emission features falling within the observed 8 band-pass at these redshifts (e.g., Smith et al. 2007). The red galaxies are likely to have bluer [5.8]-[8.0] colors because of the weakness or lack of PAH emission features and/or the 1.6 stellar photospheric feature (the “stellar bump”) that may still dominate the infrared emission in less active sources with large old stellar populations. We overplot the color evolution of M82 and NGC 4429 using the templates of Devriendt et al. (1999). M82 is a starburst galaxy with strong PAH emission features. NGC 4429 is an inactive massive S0/Sa galaxy in the Virgo cluster. The tracks confirm that actively star-forming and non-star-forming galaxies lie in different regions of the IRAC color-color diagram at these redshifts.
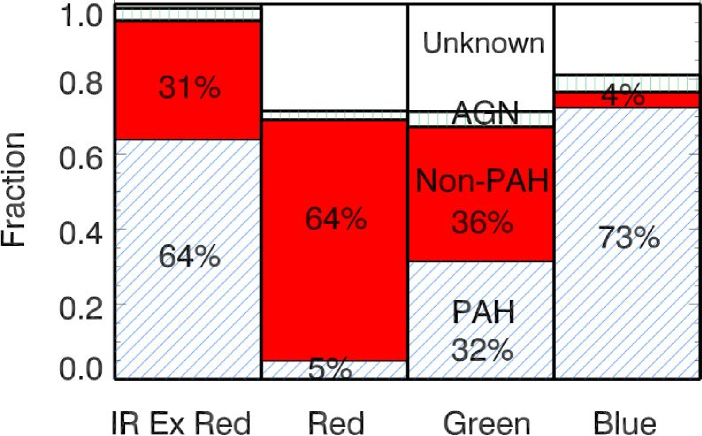
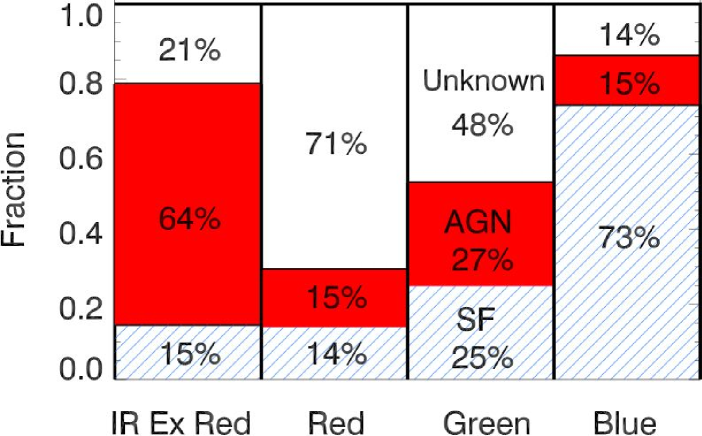
The 24 excess red galaxies lie in the region of the color-color diagram between that of the blue star-forming galaxies and the general red galaxy population (and in a similar region to that of the green valley sources). There is no correlation of [5.8]-[8.0] color with f24. The infrared brightest sources fall in both the non-PAH and PAH regions. To quantify the distribution of sources in Figure 2, we divide the color-color space into 3 regions: the “AGN” wedge region expected to be populated by powerful AGN as defined by Stern et al. (2005), and the “PAH” and “Non-PAH” regions. The boundary between these two populations at an infrared color of [5.8]-[8.0] = 1.13 mag is defined empirically so that only 5% of the blue galaxies are defined as non-PAH sources and 5% of the non-24 excess red galaxies are defined as PAH sources. To be classified, we require sources to have a detection in at least one IRAC band and to appear unambiguously in one region of the IRAC color-color diagram once limits are taken into account (otherwise, it is classified as “unknown”). Figure 3 shows the fraction of red, green, blue, and infrared-excess red galaxies classified as powerful AGN, PAH, or non-PAH from figure 2. Approximately 64% of the 24 excess red galaxies are classified as PAH sources (compared to only 5% of the 24 faint red galaxies111We note that this number is likely to be slightly higher as 28% of the 24 faint red galaxies are unclassifiable. However, this cannot account for the large difference, even in the unlikely event that all of the remaining 28% were classified as PAH sources.). This result suggests that the infrared emission is largely due to star formation.
4.2. The Optical Line Diagnostic Diagram
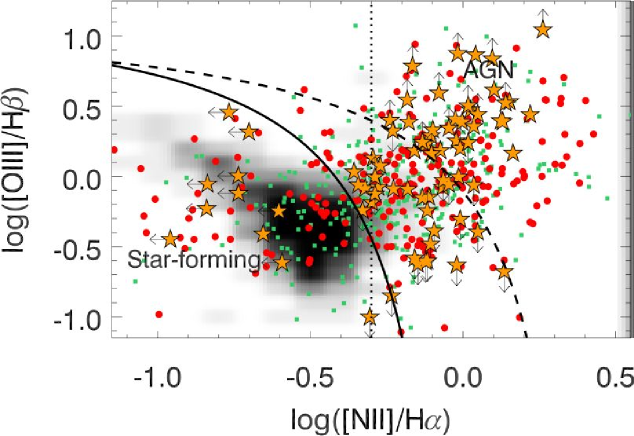
In Figure 4 we show an optical line diagnostic diagram (Baldwin et al. 1981; Kewley et al. 2001; Kauffmann et al. 2003; Kewley et al. 2006) for all of the AGES galaxies. We consider all 1996 sources with H and [NII]6584 emission lines with a signal to noise ratio of S/N3 (51% of the total sample). If a source has an optical spectrum with S/N3 for all four of the H, H, [OIII]5007, and [NII]6584 emission lines, it is classified as an AGN or star-forming galaxy using the empirically derived classification line of Kauffmann et al. (2003). We also include sources with a signal to noise of S/N3 on the H and [NII] emission lines but with S/N3 on either of the H and [OIII] emission lines. We classify these sources as an AGN if log([NII]/H -0.3 and a star-forming galaxy if log([NII]/H -0.3 (see Tremonti et al. 2004 for a similar classification criterion). We classify sources with S/N3 on the H and S/N3 on the [NII] emission lines and log([NII]lim]/H) -0.3 (where [NII]lim is the 1 upper limit on the [NII] emission line measurement) as star-forming galaxies. Any source with S/N on both the H and H emission lines and FWHM500 km is classified as a (broad-line) AGN. If a source does not meet any of these criteria, it is classified as “unknown”. This results in a completeness rate of 70/89 (79%), 241/825 (29%), 377/720 (52%), and 1942/2255 (86%) for 24 excess red galaxies, 24 faint red galaxies, green galaxies, and blue galaxies respectively at 0.150.3.
Blue galaxies tend to have [OIII]/H versus [NII]/H line ratios expected for star-forming galaxies whereas red galaxies lie in a much larger region, spanning all classifications. The 24 excess red galaxies fall in a region similar to that of the green valley galaxies.
Figure 5 shows the fraction of 24 excess red galaxies, 24 faint red galaxies, green galaxies, and blue galaxies classified as star-forming, AGN, or unknown (and with the sparse sampling weights taken into account). Galaxies with broad optical lines are included in the AGN classification. 57/89 (64%) and 13/89 (15%) of the 24 excess red galaxies are classified as AGN and star-forming sources respectively (with 19/89 (21%) unclassifiable).
The 24 excess red galaxies with infrared colors consistent with PAH emission features are not confined to the star-forming region but are distributed throughout the optical line diagnostic diagram. This result suggests that a large proportion of 24 excess red galaxies exhibit characteristics of both AGN and star-forming galaxies.
4.3. The Multi-Wavelength SED
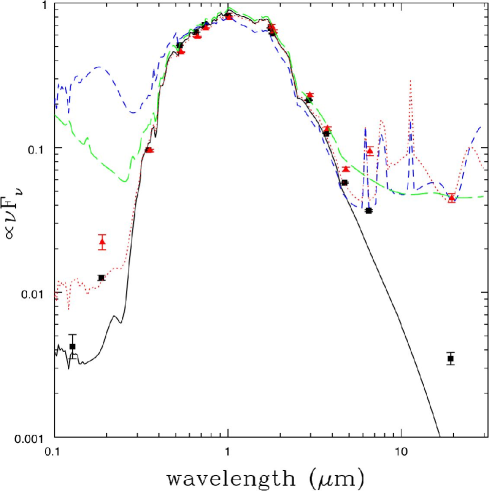
Figure 6 shows the mean multi-wavelength spectral energy distribution (SED) of the 24 excess red galaxies compared to that of the 24 faint red galaxies. Overplotted are the SED templates of Assef et al. (2008) for elliptical, spiral, irregular galaxies and AGN extended into the UV and infrared (these modifications will be presented by Assef et al. in preparation). The far and near-UV points are obtained from a Galaxy Evolution Explorer (GALEX; Martin et al. 2005) survey in the NDWFS Boötes field. The mean SEDs are essentially indistinguishable except in the infrared (by definition) and the UV. The excess of UV emission in the 24 excess red galaxies is likely due to the same processes that are giving rise to the 24 excess. The mean SED of the 24 faint red galaxies is well fit by an elliptical galaxy template (the slight excess in the near-UV and at 24 can be accounted for by the fact that this class still includes some sources with a modest 24 excess which do not satisfy the requirement of f0.3mJy that they would need to be classified as a 24 excess red galaxy). The mean UV to 24 flux density ratio of the 24 excess red galaxies is a factor of 10(4) smaller than that of the irregular galaxy (AGN) template and twice as high as that of the Sbc spiral galaxy template. This suggests that they contain a larger amount of dust and/or host an older stellar population than typical irregular galaxies. If the 24 and UV excesses are due largely to AGN, then the UV emission must be suppressed by dust. The amount of dust is not well constrained: an extinction of E(B-V) of a few tenths would be sufficient to suppress the UV light.
4.4. The Color Magnitude Diagram
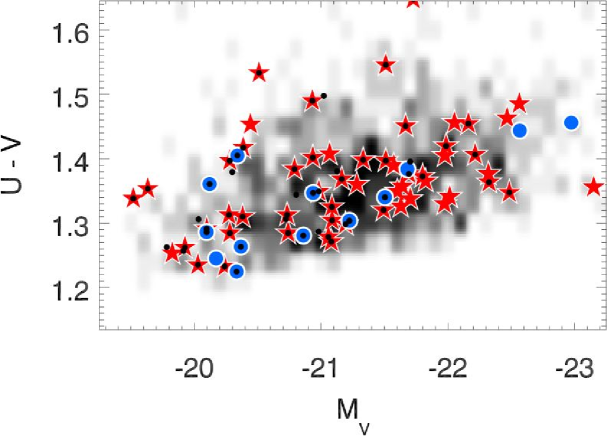
Figure 7 shows the distribution of the 24 excess red galaxies in color-magnitude space compared to that of the general red galaxy population. A Kolmogorov-Smirnov test shows that the distribution of the 24 excess red galaxies (i.e., all colored points in Figure 7) is not significantly different from that of the overall red galaxy population. However, there are hints of differences in the distribution of 24 excess red galaxies with different classifications from the optical line diagnostic diagram: the star-forming generally have bluer colors than the AGN sources.
4.5. Optical Morphology
We use the NDWFS -band images to investigate the optical morphologies of the 24 excess red galaxies. We find that for 42% of the 24 excess red galaxies, the optical images exhibit an elongated structure (the remaining sources tend to resemble typical bulge-dominated galaxies). The large axial ratios ( 5-10:1) are indicative of an edge-on spiral galaxy (hereafter referred to as a “spiral morphology”). The fraction of 24 excess red galaxies with a spiral morphology is much larger than the 11% of 24 faint red galaxies with such morphologies and suggests that some fraction of the 24 excess red galaxies are reddened edge-on disk galaxies. Of the 24 excess red galaxies within the PAH region of the infrared color-color diagram, 50% have spiral morphologies (compared to 32% of the “non-PAH” sources).
We also compare the local environments of the 24 excess red galaxies to that of the 24 faint red galaxies. The 24 excess galaxies show no evidence for a larger fraction of sources with either a disturbed morphology or close companion compared to that of the 24 faint red galaxies.
5. Discussion
We find that a small but significant minority (10%) of red galaxies have an 24 excess. We have used the IRAC colors of 24 excess red galaxies to show that a large fraction are likely to exhibit PAH emission features, indicative of star-formation. Although the infrared emission of elliptical galaxies is usually attributed to AGN or stellar mass loss from evolved stars (e.g., Temi et al. 2005; Bressan et al. 2006), PAH emission features have recently been detected in nearby elliptical galaxies (Kaneda et al., 2005). Kaneda et al. (2005) find that the 6.2, 7.7, and 8.6 emission features are unusually weak in comparison to PAH emission features at longer wavelengths. Smith et al. (2007) show that this peculiar PAH emission spectrum with markedly diminished 5-8 features arises among the sample solely in systems with relatively hard radiation fields harboring low-luminosity AGN. Given this effect, it is perhaps even more surprising that we find such a large fraction of 24 excess red galaxies in the “PAH” region of the IRAC color-color diagram.
There appears to be a discrepancy between the optical and infrared diagnostics of the 24 excess red galaxies: the optical line diagnostics suggest that AGN dominate whereas the infrared colors suggest that star formation dominates. How do we reconcile these differences? This could be, at least in part, an aperture effect. The optical spectra are obtained using a multi-fiber spectrograph and the fibers subtend 1.5″on the sky. This corresponds to an angular diameter of 5.4 kpc at =0.225. The IRAC magnitudes were obtained from 6″diameter apertures, corresponding to angular diameter of 22 kpc at =0.225. The optical diagnostics are therefore likely to probe only the region of the galaxy bulge, whereas the infrared diagnostics consider infrared light from the entire galaxy. Probing only the central regions may result in a larger contribution by an AGN, if present. The optical line diagnostics are also very sensitive to AGN activity. In particular, Kewley et al. (2000) have shown that 80% of optically classified AGN have compact radio cores, demonstrating that optical spectroscopy identifies AGN with a high rate of success, despite potential problems with dust obscuration. Presumably, in many cases, the extended narrow-line emission is detected even when the nucleus is heavily dust obscured and the infrared colors are dominated by PAH emission from circum-nuclear star formation. It is also likely that different processes may dominate at different wavelengths. This study provides a caution against using diagnostics in one wavelength to determine what dominates the bolometric luminosity of the source.
What is the nature of the 24 excess red galaxies? We explore three possibilities:
(1) Dusty star-forming galaxies with high extinctions. The 24 excess red galaxies could be a population of dusty star-forming galaxies with enough extinction to give them redder - colors (e.g., Alam & Ryden 2002; Unterborn & Ryden 2008). In Section 4.5, we show that 42% of the 24 excess red galaxies have optical morphologies indicative of edge-on spiral galaxies.This fraction is much larger than the 11% of 24 faint red galaxies with such morphologies (and the 15% of the red sequence population estimated to be dusty galaxies in the HST GEMS survey at 0.7 (Bell et al., 2004)). We compute the H/H Balmer decrements for all 24 excess red galaxies with a signal to noise, S/N3 on the H and H lines (48/89=54% of the total sample). Of the measurable sources, we find that 60% have optical extinctions that are sufficiently large that their intrinsic optical colors are consistent with them being blue or green valley galaxies (compared to only 13% of the 24 faint red galaxies with measurable lines). Similar results were reported by Davoodi et al. (2006), who find that 50% of their infrared bright red galaxies classified as star-forming galaxies have intrinsic optical colors consistent with them being blue sequence galaxies. However, the large bulge components that they find in their sources suggest that these are not pure disc-like galaxies with high levels of extinction. Of the 24 excess red galaxies within the PAH region of the infrared color-color diagram, 50% have spiral morphologies (compared to 32% of the “non-PAH” sources). This result suggests that dusty star-forming galaxies contribute to some, but not all, of the 24 excess red galaxy population.
(2) Quenched galaxies that have recently joined the red sequence from the blue cloud. The 24 excess red galaxies could represent a transition population of sources whose star-formation has been recently quenched (in 1 Gyr; Hopkins et al. 2006; Schawinski et al. 2007). The population exhibits characteristics that would be consistent with such a scenario. One could envisage a situation in which the 24 excess red galaxies that show star-forming characteristics in their optical line diagnostics are the sources that are in the earlier stages of being quenched. As the sources become quenched further, they become redder in their - colors, and their optical line diagnostics become dominated by AGN. In Figure 7, we show the color magnitude diagram for the 24 excess red galaxies split into star-forming sources and AGN as classified from their optical line diagnostics. The star-forming 24 excess red galaxies appear to be slightly bluer on average than the sources classified as AGN.
(3) Merging red galaxies. The 24 excess red galaxy population could be massive red galaxies that are undergoing major or minor mergers and exhibiting obscured star-formation and AGN activity. While the optical line diagnostics suggest that low level AGN activity appears to be common in both 24 excess and 24 faint red galaxies, the 24 excess red galaxies may indicate a recent galaxy merger or interaction that triggers obscured star-formation activity that is only detectable in the infrared (and marginally in the UV which is more sensitive to star-formation activity than the optical). This may lower the need for “dry” mergers in massive red galaxies. The distribution of stellar masses (estimated from the optical photometry) for the 24 excess red galaxies () shows no significant difference from that of the 24 faint red galaxies. In addition, the infrared luminosity is poorly correlated with the stellar mass estimated from the optical photometry (J. Moustakas et al., in preparation), consistent with what we would expect if there are brief episodes of activity occurring within the same parent population. These results are more consistent with the 24 excess population being dominated by merging red galaxies rather than quenched galaxies that have recently joined the red sequence. In the latter case, the “downsizing” of galaxies (in which galaxies of decreasing mass are progressively joining the red sequence with time) would imply that the masses of 24 excess red galaxies should be less than that of 24 faint red galaxies (that joined the red sequence at a higher redshift). On the other hand, we show in Section 4.5 that the 24 excess galaxies show no evidence for a larger fraction of sources with either a disturbed morphology or close companion than that of the 24 faint red galaxies.
It appears that the low redshift 24 excess red galaxy population comprises a mixture of different types of sources. Roughly 40% are likely to be edge-on disk galaxies with high extinction. The rest are likely to be red galaxies whose 24 emission comes from both obscured AGN and star formation activity. They may be a transition population of sources that have only recently left the blue cloud to join the red sequence and in which the residual star-formation is being quenched by AGN activity that becomes increasingly dominant in the optical band as the sources become redder. Alternatively, they could be massive red galaxies undergoing a burst of obscured star-formation activity (perhaps due to a merger). Further work needs to be done to determine which of these mechanisms dominates and how this changes with redshift.
6. Conclusions
By analyzing the infrared colors and optical line diagnostics of 0.150.3 24 excess red galaxies and comparing these to that of blue, green valley, and 24 faint red galaxies within the AGES survey, we find the following:
-
•
Of the total red galaxy population, 10% have 24 flux densities, f0.3 mJy. These correspond to infrared luminosities that are larger than we would expect from the infrared emission of local elliptical galaxies.
-
•
Using their [5.8]-[8.0] IRAC colors, we show that 64% of the 24 excess red galaxies are likely to have strong PAH emission features in their infrared spectra (compared to only 5% of the 24 faint red galaxies). This result suggests that in a large fraction of the sources, the infrared emission is dominated by star-formation processes.
-
•
A much larger fraction of 24 excess red galaxies are classified as star-forming using infrared diagnostics (64%) than optical line diagnostics (15%). This result suggests that in many sources, both AGN and star-formation activity are occurring simultaneously (but that in the optical, the AGN dominates the signal whereas in the infrared, the PAH emission features dominate.)
-
•
Although the optical to near-IR SEDs of the 24 excess and 24 quiet galaxies are very similar, the 24 excess red galaxies appear to also have a small UV excess over that of the 24 quiet galaxies. The small UV to 24 ratio suggests a large amount of dust and/or relatively old stellar population compared to that of irregular galaxies.
-
•
Approximately 40% of 24 excess red galaxies at low redshifts are likely to be dusty edge-on spiral galaxies, whose high optical extinctions make them red. The rest are likely to be red galaxies whose 24 emission comes from both obscured AGN and star formation activity. This may be triggered by minor mergers of red galaxies or, in some cases, may be the residual activity as blue galaxies are quenched to form red sequence galaxies.
We thank our colleagues on the NDWFS, MIPS, AGES, and IRAC teams. KB is supported by the Giacconi fellowship at STScI. JM acknowledges funding support from NASA-06-GALEX06-0030 and Spitzer G05- AR-50443. This research is partially supported by the National Optical Astronomy Observatory which is operated by the Association of Universities for Research in Astronomy, Inc. (AURA) under a cooperative agreement with the National Science Foundation. This work is based on observations made with the Spitzer Space Telescope, which is operated by the Jet Propulsion Laboratory, California Institute of Technology under a contract with NASA. The Spitzer / MIPS survey of the Boötes region was obtained using GTO time provided by the Spitzer Infrared Spectrograph Team (James Houck, P.I.) and by M. Rieke. AGES is a collaboration between scientists at the Harvard-Smithsonian Center for Astrophysics, Steward Observatory, the National Optical Astronomical Observatory, the Ohio State University, and the Jet Propulsion Laboratory.We thank the anonymous referee for his/her useful comments.
References
- Alam & Ryden (2002) Alam, S. M. K., & Ryden, B. S. 2002, ApJ, 570, 610
- Assef et al. (2008) Assef, R. J., Kochanek, C. S., Brodwin, M., Brown, M. J. I., Caldwell, N., Cool, R. J., Eisenhardt, P., Eisenstein, D., Gonzalez, A. H., Jannuzi, B. T., Jones, C., McKenzie, E., Murray, S. S., & Stern, D. 2008, ApJ, 676, 286
- Baldwin et al. (1981) Baldwin, J. A., Phillips, M. M., & Terlevich, R. 1981, PASP, 93, 5
- Bell et al. (2004) Bell, E. F., McIntosh, D. H., Barden, M., Wolf, C., Caldwell, J. A. R., Rix, H.-W., Beckwith, S. V. W., Borch, A., Häussler, B., Jahnke, K., Jogee, S., Meisenheimer, K., Peng, C., Sanchez, S. F., Somerville, R. S., & Wisotzki, L. 2004, ApJ, 600, L11
- Benson et al. (2003) Benson, A. J., Bower, R. G., Frenk, C. S., Lacey, C. G., Baugh, C. M., & Cole, S. 2003, ApJ, 599, 38
- Birnboim et al. (2007) Birnboim, Y., Dekel, A., & Neistein, E. 2007, MNRAS, 380, 339
- Blanton et al. (2003) Blanton, M. R., Brinkmann, J., Csabai, I., Doi, M., Eisenstein, D., Fukugita, M., Gunn, J. E., Hogg, D. W., & Schlegel, D. J. 2003, AJ, 125, 2348
- Blanton & Roweis (2007) Blanton, M. R., & Roweis, S. 2007, AJ, 133, 734
- Brand et al. (2006) Brand, K., Brown, M. J. I., Dey, A., Jannuzi, B. T., Kochanek, C. S., Kenter, A. T., Fabricant, D., Fazio, G. G., Forman, W. R., Green, P. J., Jones, C. J., McNamara, B. R., Murray, S. S., Najita, J. R., Rieke, M., Shields, J. C., & Vikhlinin, A. 2006, ApJ, 641, 140
- Brand et al. (2005) Brand, K., Dey, A., Brown, M. J. I., Watson, C. R., Jannuzi, B. T., Najita, J. R., Kochanek, C. S., Shields, J. C., Fazio, G. G., Forman, W. R., Green, P. J., Jones, C. J., Kenter, A. T., McNamara, B. R., Murray, S. S., Rieke, M., & Vikhlinin, A. 2005, ApJ, 626, 723
- Bressan et al. (2006) Bressan, A., Panuzzo, P., Buson, L., Clemens, M., Granato, G. L., Rampazzo, R., Silva, L., Valdes, J. R., Vega, O., & Danese, L. 2006, ApJ, 639, L55
- Brown et al. (2007) Brown, M. J. I., Dey, A., Jannuzi, B. T., Brand, K., Benson, A. J., Brodwin, M., Croton, D. J., & Eisenhardt, P. R. 2007, ApJ, 654, 858
- Bruzual & Charlot (2003) Bruzual, G., & Charlot, S. 2003, MNRAS, 344, 1000
- Croton et al. (2006) Croton, D. J., Springel, V., White, S. D. M., De Lucia, G., Frenk, C. S., Gao, L., Jenkins, A., Kauffmann, G., Navarro, J. F., & Yoshida, N. 2006, MNRAS, 365, 11
- Dale & Helou (2002) Dale, D. A., & Helou, G. 2002, ApJ, 576, 159
- Davoodi et al. (2006) Davoodi, P., Pozzi, F., Oliver, S., Polletta, M., Afonso-Luis, A., Farrah, D., Hatziminaoglou, E., Rodighiero, G., Berta, S., Waddington, I., Lonsdale, C., Rowan-Robinson, M., Shupe, D. L., Evans, T., Fang, F., Smith, H. E., & Surace, J. 2006, MNRAS, 371, 1113
- Devriendt et al. (1999) Devriendt, J. E. G., Guiderdoni, B., & Sadat, R. 1999, A&A, 350, 381
- Dickinson et al. (2003) Dickinson, M., Giavalisco, M., & The Goods Team. 2003, in The Mass of Galaxies at Low and High Redshift, ed. R. Bender & A. Renzini, 324–+
- Eisenhardt et al. (2004) Eisenhardt, P. R., Stern, D., Brodwin, M., Fazio, G. G., Rieke, G. H., Rieke, M. J., Werner, M. W., Wright, E. L., Allen, L. E., Arendt, R. G., Ashby, M. L. N., Barmby, P., Forrest, W. J., Hora, J. L., Huang, J.-S., Huchra, J., Pahre, M. A., Pipher, J. L., Reach, W. T., Smith, H. A., Stauffer, J. R., Wang, Z., Willner, S. P., Brown, M. J. I., Dey, A., Jannuzi, B. T., & Tiede, G. P. 2004, ApJS, 154, 48
- Faber et al. (2007) Faber, S. M., Willmer, C. N. A., Wolf, C., Koo, D. C., Weiner, B. J., Newman, J. A., Im, M., Coil, A. L., Conroy, C., Cooper, M. C., Davis, M., Finkbeiner, D. P., Gerke, B. F., Gebhardt, K., Groth, E. J., Guhathakurta, P., Harker, J., Kaiser, N., Kassin, S., Kleinheinrich, M., Konidaris, N. P., Kron, R. G., Lin, L., Luppino, G., Madgwick, D. S., Meisenheimer, K., Noeske, K. G., Phillips, A. C., Sarajedini, V. L., Schiavon, R. P., Simard, L., Szalay, A. S., Vogt, N. P., & Yan, R. 2007, ApJ, 665, 265
- Fabricant et al. (2005) Fabricant, D., Fata, R., Roll, J., Hertz, E., Caldwell, N., Gauron, T., Geary, J., McLeod, B., Szentgyorgyi, A., Zajac, J., Kurtz, M., Barberis, J., Bergner, H., Brown, W., Conroy, M., Eng, R., Geller, M., Goddard, R., Honsa, M., Mueller, M., Mink, D., Ordway, M., Tokarz, S., Woods, D., Wyatt, W., Epps, H., & Dell’Antonio, I. 2005, PASP, 117, 1411
- Fabricant et al. (1998) Fabricant, D. G., Hertz, E. N., Szentgyorgyi, A. H., Fata, R. G., Roll, J. B., & Zajac, J. M. 1998, in Presented at the Society of Photo-Optical Instrumentation Engineers (SPIE) Conference, Vol. 3355, Proc. SPIE Vol. 3355, p. 285-296, Optical Astronomical Instrumentation, Sandro D’Odorico; Ed., ed. S. D’Odorico, 285–296
- Fazio et al. (2004) Fazio, G. G., Hora, J. L., Allen, L. E., Ashby, M. L. N., Barmby, P., Deutsch, L. K., Huang, J.-S., Kleiner, S., Marengo, M., Megeath, S. T., Melnick, G. J., Pahre, M. A., Patten, B. M., Polizotti, J., Smith, H. A., Taylor, R. S., Wang, Z., Willner, S. P., Hoffmann, W. F., Pipher, J. L., Forrest, W. J., McMurty, C. W., McCreight, C. R., McKelvey, M. E., McMurray, R. E., Koch, D. G., Moseley, S. H., Arendt, R. G., Mentzell, J. E., Marx, C. T., Losch, P., Mayman, P., Eichhorn, W., Krebs, D., Jhabvala, M., Gezari, D. Y., Fixsen, D. J., Flores, J., Shakoorzadeh, K., Jungo, R., Hakun, C., Workman, L., Karpati, G., Kichak, R., Whitley, R., Mann, S., Tollestrup, E. V., Eisenhardt, P., Stern, D., Gorjian, V., Bhattacharya, B., Carey, S., Nelson, B. O., Glaccum, W. J., Lacy, M., Lowrance, P. J., Laine, S., Reach, W. T., Stauffer, J. A., Surace, J. A., Wilson, G., Wright, E. L., Hoffman, A., Domingo, G., & Cohen, M. 2004, ApJS, 154, 10
- Georgakakis et al. (2008) Georgakakis, A., Nandra, K., Yan, R., Willner, S. P., Lotz, J. M., Pierce, C. M., Cooper, M. C., Laird, E. S., Koo, D. C., Barmby, P., Newman, J. A., Primack, J. R., & Coil, A. L. 2008, MNRAS, 262
- Gorjian et al. (2008) Gorjian, V., Brodwin, M., Kochanek, C. S., Murray, S., Stern, D., Brand, K., Eisenhardt, P. R., Ashby, M. L. N., Barmby, P., Brown, M. J. I., Dey, A., Forman, W., Jannuzi, B. T., Jones, C., Kenter, A. T., Pahre, M. A., Shields, J. C., Werner, M. W., & Willner, S. P. 2008, ApJ, 679, 1040
- Graves et al. (2007) Graves, G. J., Faber, S. M., Schiavon, R. P., & Yan, R. 2007, ApJ, 671, 243
- Hogg et al. (2004) Hogg, D. W., Blanton, M. R., Brinchmann, J., Eisenstein, D. J., Schlegel, D. J., Gunn, J. E., McKay, T. A., Rix, H.-W., Bahcall, N. A., Brinkmann, J., & Meiksin, A. 2004, ApJ, 601, L29
- Hopkins et al. (2006) Hopkins, P. F., Hernquist, L., Cox, T. J., Di Matteo, T., Robertson, B., & Springel, V. 2006, ApJS, 163, 1
- Jannuzi & Dey (1999) Jannuzi, B. T., & Dey, A. 1999, in Astronomical Society of the Pacific Conference Series, Vol. 191, Photometric Redshifts and the Detection of High Redshift Galaxies, ed. R. Weymann, L. Storrie-Lombardi, M. Sawicki, & R. Brunner, 111–+
- Kaneda et al. (2005) Kaneda, H., Onaka, T., & Sakon, I. 2005, ApJ, 632, L83
- Kauffmann et al. (2003) Kauffmann, G., Heckman, T. M., Tremonti, C., Brinchmann, J., Charlot, S., White, S. D. M., Ridgway, S. E., Brinkmann, J., Fukugita, M., Hall, P. B., Ivezić, Ž., Richards, G. T., & Schneider, D. P. 2003, MNRAS, 346, 1055
- Kennicutt (1998) Kennicutt, Jr., R. C. 1998, ApJ, 498, 541
- Kenter et al. (2005) Kenter, A., Murray, S. S., Forman, W. R., Jones, C., Green, P., Kochanek, C. S., Vikhlinin, A., Fabricant, D., Fazio, G., Brand, K., Brown, M. J. I., Dey, A., Jannuzi, B. T., Najita, J., McNamara, B., Shields, J., & Rieke, M. 2005, ApJS, 161, 9
- Kewley et al. (2006) Kewley, L. J., Groves, B., Kauffmann, G., & Heckman, T. 2006, MNRAS, 372, 961
- Kewley et al. (2001) Kewley, L. J., Heisler, C. A., Dopita, M. A., & Lumsden, S. 2001, ApJS, 132, 37
- Kewley et al. (2000) Kewley, L. J., Heisler, C. A., Dopita, M. A., Sutherland, R., Norris, R. P., Reynolds, J., & Lumsden, S. 2000, ApJ, 530, 704
- Lacy et al. (2004) Lacy, M., Storrie-Lombardi, L. J., Sajina, A., Appleton, P. N., Armus, L., Chapman, S. C., Choi, P. I., Fadda, D., Fang, F., Frayer, D. T., Heinrichsen, I., Helou, G., Im, M., Marleau, F. R., Masci, F., Shupe, D. L., Soifer, B. T., Surace, J., Teplitz, H. I., Wilson, G., & Yan, L. 2004, ApJS, 154, 166
- Lonsdale et al. (2003) Lonsdale, C. J., Smith, H. E., Rowan-Robinson, M., Surace, J., Shupe, D., Xu, C., Oliver, S., Padgett, D., Fang, F., Conrow, T., Franceschini, A., Gautier, N., Griffin, M., Hacking, P., Masci, F., Morrison, G., O’Linger, J., Owen, F., Pérez-Fournon, I., Pierre, M., Puetter, R., Stacey, G., Castro, S., Polletta, M. d. C., Farrah, D., Jarrett, T., Frayer, D., Siana, B., Babbedge, T., Dye, S., Fox, M., Gonzalez-Solares, E., Salaman, M., Berta, S., Condon, J. J., Dole, H., & Serjeant, S. 2003, PASP, 115, 897
- Martin et al. (2005) Martin, D. C., Fanson, J., Schiminovich, D., Morrissey, P., Friedman, P. G., Barlow, T. A., Conrow, T., Grange, R., Jelinsky, P. N., Milliard, B., Siegmund, O. H. W., Bianchi, L., Byun, Y.-I., Donas, J., Forster, K., Heckman, T. M., Lee, Y.-W., Madore, B. F., Malina, R. F., Neff, S. G., Rich, R. M., Small, T., Surber, F., Szalay, A. S., Welsh, B., & Wyder, T. K. 2005, ApJ, 619, L1
- Rieke et al. (2004) Rieke, G. H., Young, E. T., Engelbracht, C. W., Kelly, D. M., Low, F. J., Haller, E. E., Beeman, J. W., Gordon, K. D., Stansberry, J. A., Misselt, K. A., Cadien, J., Morrison, J. E., Rivlis, G., Latter, W. B., Noriega-Crespo, A., Padgett, D. L., Stapelfeldt, K. R., Hines, D. C., Egami, E., Muzerolle, J., Alonso-Herrero, A., Blaylock, M., Dole, H., Hinz, J. L., Le Floc’h, E., Papovich, C., Pérez-González, P. G., Smith, P. S., Su, K. Y. L., Bennett, L., Frayer, D. T., Henderson, D., Lu, N., Masci, F., Pesenson, M., Rebull, L., Rho, J., Keene, J., Stolovy, S., Wachter, S., Wheaton, W., Werner, M. W., & Richards, P. L. 2004, ApJS, 154, 25
- Rodighiero et al. (2007) Rodighiero, G., Gruppioni, C., Civano, F., Comastri, A., Franceschini, A., Mignoli, M., Fritz, J., Vignali, C., & Treu, T. 2007, MNRAS, 376, 416
- Salpeter (1955) Salpeter, E. E. 1955, ApJ, 121, 161
- Schawinski et al. (2007) Schawinski, K., Thomas, D., Sarzi, M., Maraston, C., Kaviraj, S., Joo, S.-J., Yi, S. K., & Silk, J. 2007, MNRAS, 382, 1415
- Smith et al. (2007) Smith, J. D. T., Draine, B. T., Dale, D. A., Moustakas, J., Kennicutt, Jr., R. C., Helou, G., Armus, L., Roussel, H., Sheth, K., Bendo, G. J., Buckalew, B. A., Calzetti, D., Engelbracht, C. W., Gordon, K. D., Hollenbach, D. J., Li, A., Malhotra, S., Murphy, E. J., & Walter, F. 2007, ApJ, 656, 770
- Somerville & Primack (1999) Somerville, R. S., & Primack, J. R. 1999, MNRAS, 310, 1087
- Stern et al. (2005) Stern, D., Eisenhardt, P., Gorjian, V., Kochanek, C. S., Caldwell, N., Eisenstein, D., Brodwin, M., Brown, M. J. I., Cool, R., Dey, A., Green, P., Jannuzi, B. T., Murray, S. S., Pahre, M. A., & Willner, S. P. 2005, ApJ, 631, 163
- Strateva et al. (2001) Strateva, I., Ivezić, Ž., Knapp, G. R., Narayanan, V. K., Strauss, M. A., Gunn, J. E., Lupton, R. H., Schlegel, D., Bahcall, N. A., Brinkmann, J., Brunner, R. J., Budavári, T., Csabai, I., Castander, F. J., Doi, M., Fukugita, M., Győry, Z., Hamabe, M., Hennessy, G., Ichikawa, T., Kunszt, P. Z., Lamb, D. Q., McKay, T. A., Okamura, S., Racusin, J., Sekiguchi, M., Schneider, D. P., Shimasaku, K., & York, D. 2001, AJ, 122, 1861
- Temi et al. (2005) Temi, P., Brighenti, F., & Mathews, W. G. 2005, ApJ, 635, L25
- Tinsley (1968) Tinsley, B. M. 1968, ApJ, 151, 547
- Trager et al. (2005) Trager, S. C., Worthey, G., Faber, S. M., & Dressler, A. 2005, MNRAS, 362, 2
- Tremonti et al. (2004) Tremonti, C. A., Heckman, T. M., Kauffmann, G., Brinchmann, J., Charlot, S., White, S. D. M., Seibert, M., Peng, E. W., Schlegel, D. J., Uomoto, A., Fukugita, M., & Brinkmann, J. 2004, ApJ, 613, 898
- Unterborn & Ryden (2008) Unterborn, C. T., & Ryden, B. S. 2008, ArXiv e-prints, 801
- Werner et al. (2004) Werner, M. W., Roellig, T. L., Low, F. J., Rieke, G. H., Rieke, M., Hoffmann, W. F., Young, E., Houck, J. R., Brandl, B., Fazio, G. G., Hora, J. L., Gehrz, R. D., Helou, G., Soifer, B. T., Stauffer, J., Keene, J., Eisenhardt, P., Gallagher, D., Gautier, T. N., Irace, W., Lawrence, C. R., Simmons, L., Van Cleve, J. E., Jura, M., Wright, E. L., & Cruikshank, D. P. 2004, ApJS, 154, 1
- Yan et al. (2006) Yan, R., Newman, J. A., Faber, S. M., Konidaris, N., Koo, D., & Davis, M. 2006, ApJ, 648, 281