Spitzer Observations of L429: A Near–collapse or Collapsing Starless Core
Abstract
We present Spitzer infrared observations of the starless core L429. The IR images of this core show an absorption feature, caused by the dense core material, at wavelengths 70 µm. The core has a steep density profile, and reaches mag near the center. We show that L429 is either collapsing or in a near–collapse state.
Subject headings:
ISM: globules – ISM: individual (LDN 429) – infrared: ISM – (ISM:) dust, extinction1. Introduction
The collapse of a dense cloud core into a star happens rapidly (Hayashi, 1966) and therefore is rarely observed; furthermore, most dense cores appear not to be collapsing but to be close to equilibrium (e.g., Lada et al., 2008). If they are not sufficiently supported by gas pressure and turbulence, then a plausible level of magnetic field strength would suffice to support them (e.g., Kandori et al., 2005; Stutz et al., 2007; Alves et al., 2008). Because the process of collapse is so rarely observed, there is considerable debate about what triggers it and how it proceeds to form a star. Additional examples of dense cores in extreme states that indicate either collapse or a condition just prior to collapse are critical to constrain theories about the first stages of star formation.
Mm-wave line observations are the traditional means to search for collapsing cloud cores, such as in the pioneering study by Walker et al. (1986). The subsequent discussion (e.g., Menten et al., 1987; Walker et al., 1988; Wootten, 1989; Mundy et al., 1990; Narayanan et al., 1998) illustrates the ambiguities in the interpretation of velocity data in star forming dense cores. Alternative observational approaches are necessary to supplement such line measurements and provide a better understanding of collapsing and nearly-collapsing dense cores.
In this paper we characterize the structure of the extremely dense core L429, using the infrared shadow technique we have demonstrated on two other globules (Stutz et al., 2007, 2008). This core is already known to have an extremely high deuterium fraction, believed to be an indication of its being very close to collapsing into a protostar, and a low internal temperature of only K, reducing pressure support to low levels (Bacmann et al., 2003; Crapsi et al., 2005). Bacmann et al. (2000) detected a 7 µm shadow from L429 using ISOCAM. Here, we report that this shadow is so opaque that it is detectable at 70 µm. The presence of significant absorption at this long wavelength demonstrates that L429 is indeed extremely dense. Our analysis of the shadow also demonstrates that it is very compact with a steep density gradient. We show how these characteristics put L429 in the collapsing or near–collapsing starless core category.
2. Observations and processing
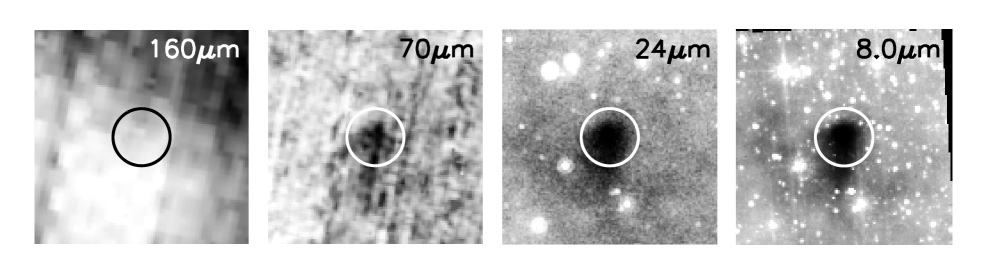
L429 was observed by Spitzer using MIPS, program ID 30384, P.I. Tyler L. Bourke, and with the IRAC instrument, program ID 20386, P.I. Philip C. Myers. The MIPS observations utilized scan map mode in all three bands. The data reductions were carried out as described in Stutz et al. (2007). The MIPS images are in size, with exposure times of s at 24 µm, s at 70 µm, and s at 160 µm. For the 70 µm and 24 µm data respectively the beam size is and , the nominal default pixel scale is and , and the pixel scale in our images is and . The IRAC reductions were carried out as described in Harvey et al. (2006). The IRAC images are in size, with exposure times of s. The Spitzer data are shown in Figure 1. We also use the 2MASS All–Sky Point Source Catalog (PSC) (Skrutskie et al., 2006) photometry for two well–detected sources within of the center of L429Reddening estimates for these sources, assuming the Rieke & Lebofsky (1985) extinction levels, are plotted in Figure 2.
3. The Distance
The commonly accepted distance to L429 is 200 pc (e.g., Lee et al., 1999; Bacmann et al., 2000; Crapsi et al., 2005), based on the likely association of this cloud with the Aquila Rift. Dame & Thaddeus (1985) find a distance to the Aquila Rift based on the CO line V km s-1. They summarize the results of various studies and conclude that the distance to the Aquila Rift is consistent with pc. More recently, Straižys et al. (2003) derive a distance to the near side of the Rift of pc, while Kawamura et al. (2001) derive a distance to an Aquila cloud complex centered at and of pc, both consistent with previous studies. The depth of the absorption feature (see Fig. 1) implies that L429 must lie on the near side of, or in front of, the Aquila Rift because substantial amounts of foreground material would be warmed by the interstellar radiation field and would dilute the shadow. We assume a distance of 200 pc, consistent with previous distance determinations. If the distance to L429 is larger the derived mass will increase, making the core less stable and more likely to be collapsing.
4. Shadow Profiles
L429 is seen in absorption at 70 µm; at 160 µm there is large-scale emission but no isolated local peak is observed (see Fig. 1). In addition, no compact emission source is detected at any Spitzer wavelength within the shadow, and so no source of luminosity L⊙ is present (Harvey et al., 2006; Dunham et al., 2008). We derive extinction profiles from the observed shadows at 70, 25, 8.0, and 5.8 µm using techniques similar to those discussed in detail in Stutz et al. (2007, 2008).
4.1. 70 µm profile
The first step in deriving the 70 µm profile is to subtract from the image a value that represents zodiacal emission and other foreground sources. For L429 the shadow is the darkest part of the image. For this reason the image zero level cannot be determined directly from the image itself. To set an upper limit on the optical depth, we zero the image using the lowest pixel value in a box centered on the shadow; in this case the zero value is MJy sr-1 below the mean pixel flux level immediately outside the shadow. Ideally, one would compute the minimum value based on more pixels. However, the 70 µm pixel size is a non-negligible fraction of the size of the core of absorption feature; taking more pixels would dilute the depth of the shadow. We use IRAS data to set the lower limit on the optical depth profile: we measure the flux level outside the shadow to be MJy sr-1 above the foreground component of emission, interpolated to 70 µm from the 60 and 100 µm IRAS images and estimated far away from regions with significant emission (about away). For this value, the minimum shadow value is MJy sr-1 above the image zero level. This zero level is a very conservative estimate because the shadow region is surrounded by high levels of emission which are very likely to raise the foreground contribution above the level we use here. This lower limit also accounts for the MIPS 70 µm calibration error, % (Gordon et al., 2007), and the IRAS extended source calibration error, which can be as large as % (Wheelock et al., 1994).
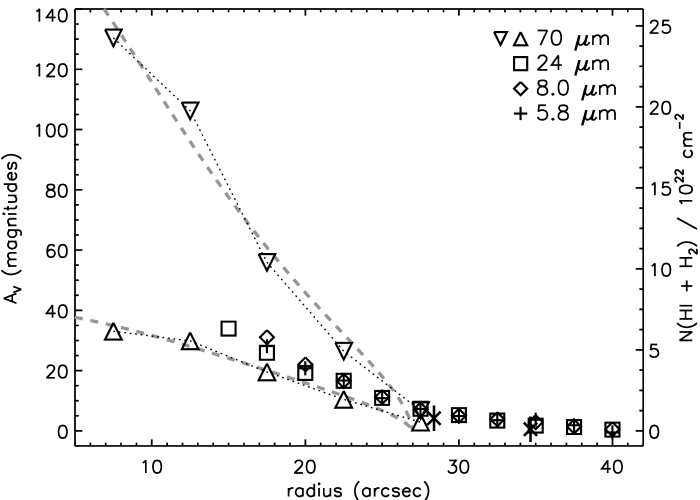
After zeroing the image we mask out all pixels with possible emission above the sky level. The mask threshold is set to the mean value plus measured for pixels in a region north of the shadow. Next we measure the mean pixel values, termed here, in nested, and concentric, circular regions, with radii starting at and increasing in steps, out to , centered at RA = , Dec = (J2000), without accounting for fractions of pixels. We ignore all pixels in the southern half of the shadow because the shadow has a tail extending to the south and the assumption of spherical symmetry breaks down (see Figure 1). Finally, to determine the optical depth at 70 µm, , we average profile values at radii to measure , the intrinsic, unobscured local flux value. The outer radius of the core at 70 µm, equal to , is set by the observed flattening of the measured flux profile at that radius, indicating that there is little to no absorption at larger radii. Following Stutz et al. (2007), we derive the 70 µm profile shown in Figure 2 with open triangles: downward–pointing triangles represent the upper limit and the upward–pointing triangles represent the lower limit. The innermost region has an optical depth of to (upper and lower limits). The total mass (gas plus dust) implied by the 70 µm profile is given by
| (1) |
where we have assumed a gas to dust mass ratio of 100 and the Ossenkopf & Henning (1994) model dust opacity for coagulated dust grains of cm2 gm-1. The value of is the upper limit on the mass; the lower limit mass is . The enclosed mass profile is shown in Fig. 3. As noted earlier, our limits on are very conservative. We performed an error analysis to measure the effect of a reasonable perturbation in the assumed zero level and the calculated value for and find that the errors are absorbed into the limits by a wide margin. For a dust opacity of cm2 gm-1, from the model from Draine (2003a, b), we calculate a 70 µm mass of .
4.2. 24, 8.0, and 5.8 µm profiles
The method used to derive the shorter wavelength profiles is essentially the same as described above. First, we zero the images using the darkest pixel in the shadow. Second, the mask threshold is determined from the pixel value distribution in the sky region. We measure the mean pixel value in circular regions starting with a radius of and increasing in steps of , out to a radius . The value of is determined by averaging pixel values between radii of and . These radii were chosen based on a flattening of the 24 µm profile in this region. At radii between and the profile continues to rise, likely due to contamination from other nearby sources. Using larger values of would artificially increase . This choice of is further justified by the 8.0 and 5.8 µm profiles: they show an increase in the mean pixel value well past but a decreasing value approaching the inner estimate at radii larger than , and by a radius of the profiles match the inner values. This increase in the profile values at intermediate radii may be caused by limb brightening of the core as it is irradiated by the interstellar radiation field. If the emission raises the observed shadow flux then it will cause an underestimate of at all wavelengths; however, if it predominantly increases the unobscured flux levels outside the shadow will be over–estimated. We do not attempt to correct for this effect. We calculate optical depth limits of and through the center of the profiles. The implied total masses at these wavelengths is for all three profiles, assuming Ossenkopf & Henning (1994) model dust opacities. The discrepancy between this mass and the 70 µm mass (between 1.6 and 5.1 ) most likely results from the high optical depth in the core. If the core is dense enough to be observed in absorption at 70 µm then it is certainly opaque at shorter wavelengths; the profile and mass estimates at shorter wavelengths will be lower limits. In the CB190 case the core was observed in absorption at 24 µm but not at 70 µm, and the maximum measured extinction value was mag (), much smaller than the values measured here (Stutz et al., 2007). Therefore we reject all 24, 8.0, and 5.8 µm points and we scale the profiles to match the 70 µm extinction values at the outer two 70 µm radii. In Figure 2 we plot the scaled profiles; the shapes of the profiles match well.
5. Discussion
Bonnor-Ebert models are often used to characterize starless cores; these models generally fit the observed density profiles with reasonable fidelity (e.g., Kandori et al., 2005; Shirley et al., 2005; Stutz et al., 2007). Bonnor-Ebert models describe a self–gravitating pressure confined isothermal sphere in hydrostatic equilibrium. The density profiles are described by three parameters: temperature, central density (or equivalently, ), and the outer radius of the cloud. A model will be unstable to collapse if . We fit said models to the extinction profiles discussed above. We use a 3D grid of models in temperature, radius, and ; see Stutz et al. (2007) for a more detailed discussion of the models and the fitting method. One strong constraint in interpreting the best–fit models is that L429 is dark at µm, and therefore the temperature cannot be greater than K, in agreement with other core temperature measurements (e.g., Lemme et al., 1996; Bacmann et al., 2002; Hotzel et al., 2002; Kirk et al., 2007). The best–fit models for the upper and lower bounds on the 70 µm profile are shown in Figure 2 as grey dashed lines. The 70 µm profile has a best–fit temperature of K, for the upper and lower bounds, respectively; these temperatures are in clear contradiction with the data. The best–fit outer radius is , for both the upper and the lower limit, and the best–fit = 4.5 and 3.0, for the upper and lower limit respectively. As the assumed distance is increased (in this case to 270 pc) the best–fit models become even more implausible, with temperatures always K. At a distance of 100 pc the best–fit temperatures are K, still in contradiction with the data. These high temperatures indicate that L429 requires additional support (turbulence and magnetic fields) beyond thermal to prevent collapse.

Crapsi et al. (2005) observe N2D+ and N2H+ line widths km s-1 and calculate excitation temperatures K. The particle of mean molecular mass has velocity FWHM km s-1 for temperature 8 K, indicating that the turbulent energy contribution to the support in L429 is only comparable to the thermal contribution (Hotzel et al., 2002).
Magnetic fields are a possible source of support in starless cores. Inferred magnetic field strengths in cores range from, e.g., G to G (Bergin & Tafalla, 2007). For , a distance of 200 pc, and G, the mass that can be supported is (Stahler & Palla, 2005). Furthermore, from equation 1 and the Stahler & Palla (2005) analysis, the condition of stability requires a minimum magnetic field strength of:
where is the angular radius of the core. The mean column density of the 70 µm profile is cm-2; given this column, the correlation presented by Basu (2004) implies a line-of-sight magnetic field of G; we estimate the total field as G, although this relation has large scatter.
Although the field required to support L429 is larger than expected, our understanding of the limits on magnetic field strengths does not allow for a strong constraint. In addition to requiring a field exceeding the likely range of values, supporting the globule entirely with magnetic pressure has other consequences. One might expect asymmetries to develop, given the asymmetric pressure provided by magnetism. If such structures can be avoided (Shu et al., 1987), another issue is that the field should leak out of the globule by ambipolar diffusion, on timescales yr (Stahler & Palla, 2005). Thus, either the field is already too small to prevent the collapse of the globule, or the collapse will only be delayed for a time.
If infall is occurring in L429, the observed line width is very narrow. Crapsi et al. (2005) detect a double-peaked N2H+ line and Lee et al. (1999) detect a double-peaked CS line, both measurements with roughly equal brightness in the blue and red peaks. Lee et al. (1999) state that because other thin tracers show single Gaussian components, the observed double peak is likely due to self absorption at high optical depth; these authors also note that L429 is one of two sources out of 163 spectra that show small wing components. Lee et al. (2004) classify L429 as a possible infall candidate based on their observation of CS , which has a double peaked profile with more emission in the blue peak. Sohn et al. (2007) also measure a double peaked profile in HCN ; they note that this source is one of two (out of 85 cores surveyed) that has some line strength anomalies in the three hyperfine HCN lines. Recently, Caselli et al. (2008) have found that L429 has a large amount of ortho-H2D+(11,0–11,1) emission, which they find to be correlated with increased central concentration, CO depletion, and deuteration, providing further evidence that L429 is very evolved.
6. Conclusions
We measure the density profile of L429 from the 70 µm absorption feature observed with the Spitzer Telescope. We conclude that:
1. The strong absorption even at 70 µm indicates that L429 is exceptionally dense.
2. At the same time, the absorbing cloud is very compact and has a very steep density gradient (as seen most clearly at 24 µm).
3. The temperature can be no more than 12 K.
4. As a result of these extreme characteristics, thermal pressure fails, by a wide margin, to support the globule; turbulent support is also inadequate by a wide margin.
5. The magnetic field required to make up the rest of the required pressure for support would be surprisingly large; even if present, such a large field will leak out of the globule through ambipolar diffusion.
6. Therefore, L429 is either already undergoing collapse or is approaching an unstable, near-collapse state.
We thank the referee for their helpful comments. Support for this work was provided through NASA contracts issued by Caltech/JPL to the University of Arizona (1255094) and to SAO (1279198 and 1288806). This work was also supported by the National Science Foundation grant AST-0708131 to The University of Arizona.
References
- Alves et al. (2008) Alves, F. O., Franco, G. A. P., & Girart, J. M. 2008, A&A, 486, L13
- Bacmann et al. (2000) Bacmann, A., André, P., Puget, J.-L., Abergel, A., Bontemps, S., & Ward-Thompson, D. 2000, A&A, 361, 555
- Bacmann et al. (2002) Bacmann, A., Lefloch, B., Ceccarelli, C., Castets, A., Steinacker, J., & Loinard, L. 2002, A&A, 389, L6
- Bacmann et al. (2003) Bacmann, A., Lefloch, B., Ceccarelli, C., Steinacker, J., Castets, A., & Loinard, L. 2003, ApJ, 585, L55
- Basu (2004) Basu, S. 2004, in Young Local Universe, Proceedings of XXXIXth Rencontres de Moriond, eds. A. Chalabaev, T. Fukui, T. Montmerle, and J. Tran-Thanh-Van. Paris: Editions Frontieres, ArXiv Astrophysics e-prints, arXiv:astro-ph/0410534
- Bergin & Tafalla (2007) Bergin, E. A., & Tafalla, M. 2007, ARA&A, 45, 339
- Caselli et al. (2008) Caselli, P., Vastel, C., Ceccarelli, C., van der Tak, F., Crapsi, A., & Bacmann, A. 2008, arXiv:0809.2803
- Crapsi et al. (2005) Crapsi, A., Caselli, P., Walmsley, C. M., Myers, P. C., Tafalla, M., Lee, C. W., & Bourke, T. L. 2005, ApJ, 619, 379
- Dame & Thaddeus (1985) Dame, T. M., & Thaddeus, P. 1985, ApJ, 297, 751
- Draine (2003a) Draine, B. T. 2003a, ARA&A, 41, 241
- Draine (2003b) Draine, B. T. 2003b, ApJ, 598, 1017
- Dunham et al. (2008) Dunham, M. M., Crapsi, A., Evans, N. J., II, Bourke, T. L., Huard, T. L., Myers, P. C., & Kauffmann, J. 2008, ArXiv e-prints, 806, arXiv:0806.1754
- Gordon et al. (2007) Gordon, K. D., et al. 2007, PASP, 119, 1019
- Harvey et al. (2006) Harvey, P. M., et al. 2006, ApJ, 644, 307
- Hayashi (1966) Hayashi, C. 1966, ARA&A, 4, 171
- Hotzel et al. (2002) Hotzel, S., Harju, J., & Juvela, M. 2002, A&A, 395, L5
- Kandori et al. (2005) Kandori, R., et al. 2005, AJ, 130, 2166
- Kawamura et al. (2001) Kawamura, A., Kun, M., Onishi, T., Vavrek, R., Domsa, I., Mizuno, A., & Fukui, Y. 2001, PASJ, 53, 1097
- Kirk et al. (2007) Kirk, J. M., Ward-Thompson, D., & André, P. 2007, MNRAS, 375, 843
- Lada et al. (2008) Lada, C. J., Muench, A. A., Rathborne, J., Alves, J. F., & Lombardi, M. 2008, ApJ, 672, 410
- Lee et al. (1999) Lee, C. W., Myers, P. C., & Tafalla, M. 1999, ApJ, 526, 788
- Lee et al. (2004) Lee, C. W., Myers, P. C., & Plume, R. 2004, ApJS, 153, 523
- Lemme et al. (1996) Lemme, C., Wilson, T. L., Tieftrunk, A. R., & Henkel, C. 1996, A&A, 312, 585
- Menten et al. (1987) Menten, K. M., Serabyn, E., Guesten, R., & Wilson, T. L. 1987, A&A, 177, L57
- Mundy et al. (1990) Mundy, L. G., Wootten, H. A., & Wilking, B. A. 1990, ApJ, 352, 159
- Narayanan et al. (1998) Narayanan, G., Walker, C. K., & Buckley, H. D. 1998, ApJ, 496, 292
- Park et al. (2004) Park, Y.-S., Lee, C. W., & Myers, P. C. 2004, ApJS, 152, 81
- Ossenkopf & Henning (1994) Ossenkopf, V., & Henning, T. 1994, A&A, 291, 943
- Rieke & Lebofsky (1985) Rieke, G. H., & Lebofsky, M. J. 1985, ApJ, 288, 618
- Shirley et al. (2005) Shirley, Y. L., Nordhaus, M. K., Grcevich, J. M., Evans, N. J., Rawlings, J. M. C., & Tatematsu, K. 2005, ApJ, 632
- Shu et al. (1987) Shu, F. H., Adams, F. C., & Lizano, S. 1987, ARA&A, 25, 23
- Sohn et al. (2007) Sohn, J., Lee, C. W., Park, Y.-S., Lee, H. M., Myers, P. C., & Lee, Y. 2007, ApJ, 664, 928
- Skrutskie et al. (2006) Skrutskie, M. F., et al. 2006, AJ, 131, 1163
- Stahler & Palla (2005) Stahler, S. W., & Palla, F. 2005, The Formation of Stars, by Steven W. Stahler, Francesco Palla, pp. 865. ISBN 3-527-40559-3. Wiley-VCH , January 2005
- Straižys et al. (2003) Straižys, V., Černis, K., & Bartašiūtė, S. 2003, A&A, 405, 585
- Stutz et al. (2007) Stutz, A. M., et al. 2007, ApJ, 665, 466
- Stutz et al. (2008) Stutz, A. M., et al. 2008, ArXiv e-prints, 807, arXiv:0807.2241, ApJin press.
- Walker et al. (1986) Walker, C. K., Lada, C. J., Young, E. T., Maloney, P. R., & Wilking, B. A. 1986, ApJ, 309, L47
- Walker et al. (1988) Walker, C. K., Lada, C. J., Young, E. T., & Margulis, M. 1988, ApJ, 332, 335
- Walker et al. (1994) Walker, C. K., Narayanan, G., & Boss, A. P. 1994, ApJ, 431, 767
- Wheelock et al. (1994) Wheelock, S. L., et al. 1994, NASA STI/Recon Technical Report N, 95, 22539
- Wootten (1989) Wootten, A. 1989, ApJ, 337, 858