The switching dynamics of the bacterial flagellar motor
Abstract
Many swimming bacteria are propelled by flagellar motors that stochastically switch between the clockwise and counterclockwise rotation direction. While the switching dynamics are one of the most important characteristics of flagellar motors, the mechanisms that control switching are poorly understood. We present a statistical-mechanical model of the flagellar rotary motor, which consist of a number of stator proteins that drive the rotation of a ring of rotor proteins, which in turn drives the rotation of a flagellar filament. At the heart of our model is the assumption that the rotor protein complex can exist in two conformational states corresponding to the two respective rotation directions, and that switching between these states depends on interactions with the stator proteins. This naturally couples the switching dynamics to the rotation dynamics, making the switch sensitive to torque and speed. Another key element of our model is that after a switching event, it takes time for the load to build up, due to polymorphic transitions of the filament. Our model predicts that this slow relaxation dynamics of the filament, in combination with the load dependence of the switching frequency, leads to a characteristic switching time, in agreement with recent observations.
I Introduction
The bacterium Escherichia coli can swim toward attractants and away from various noxious chemicals. It is propelled by several flagella. Each flagellum is under the action of a rotary motor, which can rotate either in a clockwise (CW) or a counterclockwise (CCW) direction. When all the motors run in the counterclockwise direction, the flagella form a helical bundle and the bacterium swims smoothly. When one motor switches direction to run in the clockwise direction, however, the connected flagellar filament disentangles from the bundle, and the bacterium performs a so-called tumble. These tumble events randomize the cell’s trajectory, and it is the modulation of their occurrence that allows E. coli to chemotax. Here, we present a statistical-mechanical model that describes the switching dynamics of the rotary motor.
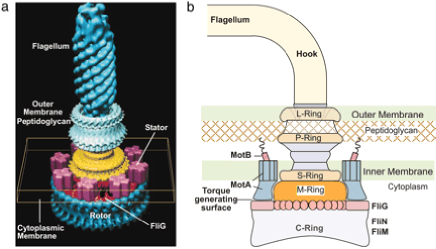
A cartoon of the bacterial flagellar motor is shown in Fig. 1 Thomas06 . It consists of a protein complex called the rotor, and a number of stator proteins that are fixed in the inner membrane and the peptidoglycan layer. Interactions between the stator proteins and a ring of FliG proteins of the rotor protein complex drive the rotation of the rotor, and thereby the rotation of the flagellum, which is connected to the rotor. The rotation direction is determined by the concentration of the phosphorylated form of the messenger protein , which binds to the ring of FliM proteins of the rotor protein complex.
The bacterial flagellar motor has a number of characteristics that reflect its design principles. One is the torque-speed relationship of the motor, which has recently been modeled by Oster and coworkers Xing:2006dq . Another is the power spectrum of the motor switching dynamics, which reflects the time scales on which the motor switches direction. Recently, Cluzel and coworkers measured power spectra for mutant cells by monitoring the rotation of a latex bead connected to a flagellum. Korobkova04 ; Korobkova06 . In these cells, a mutant CheY protein, , was stably preexpressed Korobkova04 ; Korobkova06 . This protein mimics the effect of , but its concentration is not affected by the dynamics of the chemotaxis signaling network. The power spectra of these mutant cells therefore reflect the intrinsic switching dynamics of the motor.
Intriguingly, the power spectra of these mutant cells are not consistent with a two-state Poisson process, in which the switching events are independent and the CW and CCW intervals are uncorrelated and exponentially distributed Korobkova06 . They exhibit a distinct peak at around Korobkova06 , which means that there is a characteristic frequency at which the motor switches. Cluzel and coworkers Korobkova06 suggest that an earlier model developed by Duke and Bray Duke01 might be able to explain the power spectrum. This model, however, is based on an Ising system, which is a mesoscopic equilibrium system. Such a system cannot exhibit a peak in the power spectrum VanKampen92 ; ThesisVanAlbada ; Tu08 . The peak means that the switching dynamics is coupled to a non-equilibrium process.
We argue that to explain the switching dynamics of the motor, we have to integrate a description of the switching dynamics of the rotor with a description of both the flagellum dynamics and the dynamics of the stator proteins that drive the rotation of the rotor. The rotor protein complex is modeled as an Monod-Wyman-Changeux (MWC) model Monod65 , in which the proteins of the complex collectively switch between a clockwise and a counterclockwise conformational state. Interactions between the stator proteins and the FliG proteins of the rotor do not only drive the rotation of the rotor, but also continually change the relative stability of the two conformational states of the rotor. This couples switching to the non-equilibrium process of rotation, and makes the switch sensitive to torque and speed. Our model predicts that the probability for the rotor to switch increases with the load in the zero-load regime, as observed experimentally Fahrner03 . But, to fully describe the switching of the motor, the rotor’s switching and rotation dynamics have to be coupled to the conformational dynamics of the flagellum.
Bacterial flagella can exist in different polymorphic states Calladine:1975gl ; Macnab:1977wm ; Hotani:1982nq ; Darnton:2007hc , which are either left-handed or right-handed helices. When the motor runs in the CCW direction, the flagellum adopts a left-handed, normal state Turner00 , while if it runs in the CW direction, it adopts a right-handed, semi-coiled or curly state Turner00 . By pulling on a single flagellum using optical tweezers, Darnton and Berg recently observed that transitions between these polymorphic forms occur in discrete steps, during which elastic strain energy is released Darnton:2007hc . We argue that the change in the torque upon a motor reversal induces a polymorphic transition that proceeds via a similar series of discrete steps. Since in each of these steps strain energy is released, the torque on the motor, and hence the switching propensity, remains low. However, when the flagellum ultimately reaches its final polymorphic form, the strain energy can no longer be released and the torque on the motor increases. Due to the exponential dependence of the motor’s switching propensity on the applied torque, the switching propensity now increases rapidly, giving rise to the characteristic switching time Korobkova06 .
II The stator-rotor interaction
The interaction between the stator proteins and the rotor proteins is modeled according to the model of Oster and coworkers Xing:2006dq , which is based on the description of Blair and coworkers Kojima01 . Since our model builds upon this model, we briefly describe its main ingredients. For details, we refer to the Supporting Information.
According to the proposal of Blair and Oster, the motor cycle of each stator protein consists of two “half strokes”. During the first power stroke of a stator protein, two protons bind MotB residues of the stator protein Kojima01 (Fig. 1). This leads to a thermally activated conformational transition, which allows one MotA loop to exert a force on one FliG protein of the rotor protein complex (Fig. 1). During the second stroke, the recovery stroke, the two protons are released to the cytoplasm, triggering another conformational transition of the stator, and allowing another MotA loop to exert a force on the FliG protein. At the end of this cycle, the rotor has advanced by an angle of divided by 26, the number of FliG proteins within the ring. The force exerted by MotA is modeled as a constant force along an energy surface, and the conformational transitions are described as hops between the two respective surfaces (Fig. 2).
A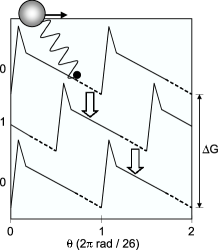 B
B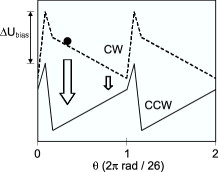
The rotation dynamics of the rotor is given by the following overdamped Langevin equation:
| (1) |
Here, is the friction coefficient of the rotor; is the rotor-stator interaction energy as a function of (Fig. 2), where denotes the rotor rotation angle, the angle of the immobile stator protein , and is a binary variable denoting the conformational state of stator ; is a Gaussian white noise term of magnitude ; is the number of stator proteins. The torque denotes the external load. As discussed in Elston00 ; Elston00_2 ; Xing:2006dq , for the system studied here, the torque-speed curves under conservative load and viscous load are identical. However, as we will show below, the type of load does markedly affect the switching dynamics.
The hopping rate for a stator protein to go from one energy surface to another depends upon the free-energy barrier separating them. We make the phenomenological assumption that the hopping rate depends exponentially on the free-energy difference, in a manner that obeys detailed balance:
| (2) |
Here, sets the basic time scale, and . The function describes the proton hopping windows (Fig. 2), which reflect the idea that the proton channel through the stator is gated by the motion of the rotor Xing:2006dq ; Kojima01 .
Fig. S1 of the Supporting Information shows that this model, developed by Oster and coworkers Xing:2006dq , accurately describes the torque-speed relation of the flagellar motor of E. coli.
III The rotor switching dynamics
In E. coli, the fraction of time the motor rotates in the clockwise direction, the so-called clockwise (CW) bias, is controlled by the concentration of the intracellular messenger protein . This protein modulates the CW bias by binding to the ring of FliM proteins. This ring is connected to the ring of FliG proteins, which interact with the stator proteins (Fig. 1).
The molecular mechanism of the switch is unknown. Yet, it is widely believed that the binding of to FliM tends to change the conformation of FliM. Following earlier work, we assume that each FliM protein can exist in either a CW or CCW conformational state and that binding of shifts the relative stability of these two conformational states Scharf98 ; Turner99 ; Duke01 . Moreover, we assume that also each FliG protein can exist in either a CW or CCW conformational state. In the spirit of an MWC model Monod65 , we assume that the energetic cost of having two rotor protein molecules in two different conformational states is prohibitively large. We can then speak of the rotor being in either the CW or the CCW state.
When the rotor complex switches from one state to another, the interactions between the FliG proteins and the stator proteins change, due to the new conformational state of the FliG proteins. In our model, each stator-rotor interaction is described by 4 energy surfaces, , with the subscript denoting the conformational state of the stator protein and the superscript denoting the conformational state of the rotor protein (clockwise or counter-clockwise). We assume that the two rotor surfaces corresponding to a given state of the stator are simply each other’s mirror image (the potentials are flipped in the direction), but offset by an energy difference that is given by the CW bias (Fig. 2B). This yields the following instantaneous rotor switching rate:
| (3) |
where . Importantly, the instantaneous switching rate does not depend on the load, although the average, effective switching rate does, as discussed below. Note also that our model assumes that the kinetics of binding is fast on the time scale of switching, in contrast to a recent model Tu08 .
Fig. 3 shows the switching dynamics when the load is conservative. The conservative load is modeled as a constant torque in a direction opposite to that of the rotation direction of the rotor (Fig. 1); after the rotor has switched direction, the conservative force instantaneously changes sign. This means that the switching dynamics of the motor with a conservative load reflects the switching dynamics of the rotor complex; in the next section, we study the effect of the flagellum, by studying the switching dynamics using a viscous load, which depends on the dynamics of the flagellum.
Fig. 3A shows the average switching rate in the forward and backward switching direction as a function of the conservative load. As expected, the CCW CW switching rate increases as the CW bias increases. More interestingly, the switching rate increases exponentially with the external load. As we describe below, this is key to understanding the bump in the power spectrum.
The exponential dependence of the switching rate on the load can be understood by noting that the effective switching rate is given by
| (4) |
where is the stationary distribution of the rotor’s position. Increasing the load shifts to values of where the driving force for switching, , is larger (Fig. 2B). Since the instantaneous switching rate depends exponentially on (See Eq. 3), the effective switching rate increases strongly with load in the low-load regime, as observed in the experiments of Fahrner et al. Fahrner03 .
These experiments also suggest that in the high torque regime, the switching rate decreases with the load Fahrner03 , which is not captured by the model presented here; yet, we believe that if we would introduce a switching window analogous to the proton hopping window introduced by Xing et al. to describe the torque-speed relation Xing:2006dq , we could reproduce this. However, this is not critical for the problem considered here, since the switching dynamics of a motor with a flagellum, as described in the next section, is mostly determined by how the switching rate changes with load in the low to intermediate torque regime, shown in Fig. 3.
A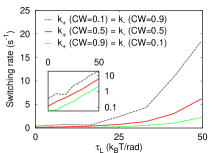 B
B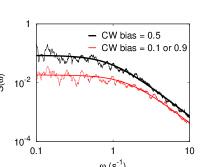
Fig. 3B shows the power spectra of the switching dynamics. It is given by a Lorentzian, which shows that the switching of the rotor without a flagellum can be modeled as a random telegraph process.
IV Flagellum dynamics
In the model discussed above, after a switching event, the torque on the motor immediately changes sign and instantaneously reaches its steady-state value. However, in the experiments of Cluzel and coworkers, the switching of the motor was visualized via a bead that was attached to the flagellar filament Korobkova04 ; Korobkova06 . We argue that the flagellum dynamics is critical for understanding the switching dynamics of the flagellar motor.
Darnton and Berg recently studied polymorphic transitions of a single filament using optical tweezers Darnton:2007hc . The following three observations were made: 1) The transitions occur in discrete, rapid steps that are stochastic in nature, suggesting that they are activated processes during which an energy barrier is crossed; 2) In between the steps, the filament behaves as a linear elastic object that accumulates elastic strain energy that is released during the next transformation; 3) During a step, not the whole filament is converted, but micrometer-long sections.
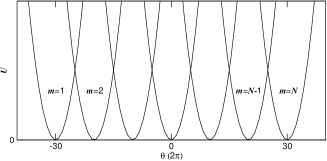
On the basis of these three observations, we have constructed the filament model shown in Fig. 4. It consists of a number of harmonic potentials as a function of the winding angle , corresponding to different conformational states of the filament. The left-most well corresponds to the normal state, which is the polymorphic form of the filament when the motor runs in the CCW direction. The right-most well corresponds to the curly state, which is one of the polymorphic forms that the filament adopts when the motor runs in the CW direction. The states in between correspond to an ensemble of polymorphic forms that includes not only the coiled and semi-coiled states, but, according to observation no. 3 above, also states in which one section of the filament is in one distinct polymorphic state, while the other is in an another conformational state. According to observation no. 2, and following Darnton and Berg Darnton:2007hc , we assume that the free energy of a filament in a given polymorphic state is quadratic in the curvature and torsion (see Supporting Information). The curvature and torsion are functions of the height of the filament and the winding angle . We assume that at each instant, the height has relaxed to its steady-state value, which means that becomes a quadratic function of the winding angle only:
| (5) |
where the torque constant is given by the Young’s and shear moduli and the contour length of the filament; the value chosen is consistent with the measurements of Block et al Block:1989fe and Darnton and Berg Darnton:2007hc (see Supporting Information). For simplicity, we assume that the potentials are equally spaced, and have the same torque constant and well depth, although under neutral pH the normal state is the most stable one Darnton:2007hc . The total difference in winding angle between the normal (left-most) and curly (right-most) state is about 50 rounds, which is the correct order of magnitude based on the elastic properties of the filament (see Supporting Information). This is an important parameter, since it directly affects the characteristic switching time.
Motivated by observation 1, we assume that the transition from one conformational state to another is an activated process, with a rate constant
| (6) |
Denoting the position of the load (bead) with , the load dynamics is given by
| (7) |
Here, is the friction coefficient of the bead, and is a Gaussian white noise term of magnitude .
Fig. 5 shows the switching characteristics of this system. We show the dynamics of the bead instead of the motor, since that has been measured experimentally; however, the switching dynamics of the two are very similar. Fig. 5A shows the distribution of waiting times, for CW bias = 0.1, 0.5, and 0.9. These distributions agree remarkably well with those observed by Cluzel and coworkers Korobkova06 . Firstly, the distributions are not exponential, as would be expected for a random telegraph process: The distributions exhibit a clear peak at around . Secondly, the waiting-time distribution for the forward (CWCCW) transition shifts from a narrow distribution at CW bias = 0.1 to a broad distribution at CW bias = 0.9. Moreover, the position of the maximum of the distribution shifts to longer times. All these features are in near quantitative agreement with experiment.
A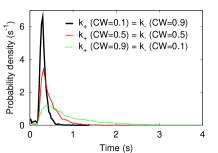 B
B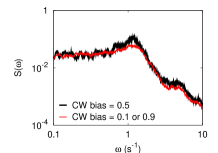
Fig. 5B shows the power spectra of our model, for CW bias = 0.5, and for CW bias = 0.1, 0.9 (they are identical because of the symmetry of our model). It is seen that the spectra exhibit a distinct peak at . Moreover, the peak is most pronounced when the CW bias = 0.5. These characteristics are observed experimentally Korobkova06 .
Our model predicts that the peak in the power spectrum arises from the interplay between the conformational dynamics of the flagellum and the dependence of the switching rate on the load (Fig. 3A). The idea is illustrated in Fig. 6. After a switching event of the rotor, the torque is initially in the original direction, but decreases rapidly in magnitude as the filament reaches its optimum winding angle (Fig. 4; Fig. 6A); in this regime, the load on the motor is negative, and the elastic strain energy in the filament decreases. As the rotor drives the filament beyond its optimal winding angle, the torque changes direction and increases in magnitude; the load on the motor becomes positive, and the strain energy in the filament builds up. This strain energy can, however, be released via a polymorphic transition, leading to a sudden change in the direction of the torque. This process repeats itself until the filament reaches its final polymorphic form, upon which the strain energy can no longer be released, and the torque increases to reach a plateau when the viscous drag equals the motor torque. The peak in the power spectrum can now be understood by combining the time trace of the torque (Fig. 6A) with the dependence of the switching rate on the load (Fig. 3A), yielding the switching propensity (i.e., the probability to switch per unit amount of time at a given time ) as a function of time, as shown in Fig. 6B. After a switching event, the torque flip-flops around zero and the switching propensity remains low. But when the flagellum has reached its final polymorphic form, the torque can no longer be released, and the switching propensity increases significantly. The peak in the spectrum is precisely caused by the fact that the switching propensity function is not constant in time, as for a Markovian Poisson process, but increases with time.
A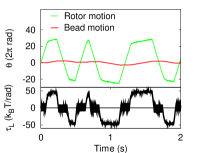 B
B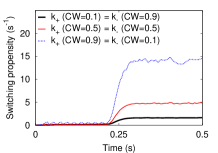
V Coarse-grained model
Our calculations suggest that a useful coarse-grained model for understanding the switching dynamics is one in which the system stochastically flips between two states with time-dependent propensity functions (Fig. 6B):
| (8) |
where the propensity functions are given by the following piece-wise linear functions:
| (9) | |||||
| (10) | |||||
| (11) |
The important parameters of this model are the lag time, , the minimum and maximum propensity, and , respectively, and to a lesser extent the sharpness of the transition . For this model, the waiting-time distribution and power spectrum can be obtained analytically (see Supporting Information).
The maximum propensity function depends on the CW bias, which determines how the rotor switching propensity depends upon the load (Fig. 3A), and the maximum load itself, which is determined by the drag coefficient of the load, , and the torque-speed relation; to a good approximation, the maximum torque is given by the intersection of times the speed (the load line) and the torque-speed curve Xing:2006dq . The minimum propensity function does not depend upon this maximum load, but rather upon the torque at which the flagellum undergoes a polymorphic transition—the polymorphic transitions release the elastic strain energy before this maximum load is reached, keeping the load and hence low. The peak in the power spectrum arises when , which leads to the prediction that the peak may disappear when the number of stators is reduced. The position of the peak is determined by , which is given by the difference in winding angle between the normal and curly state divided by the average speed at which the rotor drives the systems between these two states; this speed depends upon the torque-speed relation and the load as a function of time. Interestingly, polymorphic transitions of filaments of swimming bacteria occur on time scales of 0.1 s Turner00 , close to the peak of the waiting-time distribution, supporting our idea that they set the characteristic switching time.
The dependence of on the CW bias can explain the change in the waiting-time distributions when the CW bias is varied. (Fig. 5A). When the CW bias is large, is large, because the switching propensity at the maximum load as set by the balance of the drag and the motor torque is large (Fig. 3A). Consequently, the rotor typically switches to the CW state before the switching propensity can reach its plateau value. This explains the narrow distribution of CCW intervals when the CW bias is large, as observed in both the model (Fig. 5A) and experiment Korobkova06 . For the reverse transition the situation is qualitatively different. When the CW bias is large, is low, which means that the system can enter the regime in which the switching propensity is constant before it switches to the CCW state. This constant propensity leads to an exponential tail in the distribution of CW (CCW) intervals when the CW (CCW) bias is large, as observed in both the distributions of the model (Fig. 5A) and those measured experimentally Korobkova06 .
VI Discussion
We have presented a statistical-mechanical model that describes the switching dynamics of a rotary flagellar motor. Its foundation is the assumption that the rotor protein complex can exist in two conformational states corresponding to the two respective rotation directions, and that switching between these states depends on interactions with the stator proteins, which also drive the rotation of the rotor complex. This naturally couples the switching dynamics to the rotation dynamics. The load does not directly change the relative stability of the rotor’s conformational states, but it does change how often the stator proteins during their motor cycle favor one conformational state of the rotor over the other. This, according to our model, is the principal mechanism that makes the switch sensitive to torque and speed. Another key element of our model is that after a switch, it takes time for the load to build up, due to the polymorphic transitions of the filament.
Several predictions emerge from our model that could be tested experimentally. One is that the change in the torque on the filament upon a motor reversal leads to a series of polymorphic transitions, which could be tested by applying a torque on a single filament using magnetic tweezers. Another is that the switching dynamics of the rotor without the viscous load of the flagellum is that of a two-state Poisson process, in contrast to a recent model Tu08 ; moreover, in the zero-load regime, the switching propensity increases with the load. These predictions could be tested by measuring the rotation dynamics of a bead that is connected either directly to the stub, or to a very short filament. Our model predicts that its power spectrum does not have a peak.
We thank Howard Berg, Sanne Abeln and Gijsje Koenderink for a critical reading of the manuscript in this project. The work is supported by FOM/NWO.
References
- (1) Thomas, D. R, Francis, N. R, Xu, C, & DeRosier, D. J. (2006) J. Bacteriol. 188, 7039–7048.
- (2) Xing, J, Bai, F, Berry, R, & Oster, G. (2006) Proc Natl Acad Sci U S A 103, 1260–1265.
- (3) Korobkova, E. A, Emonet, T, Vilar, J. M. G, Shimizu, T. S, & Cluzel, P. (2004) Nature 428, 574–578.
- (4) Korobkova, E. A, Emonet, T, Park, H, & Cluzel, P. (2006) Phys. Rev. Lett. 96, 058105.
- (5) T. A. J. Duke, N. E. Le Novère, and D. Bray. (2001) J. Mol. Biol. 308, 541–553.
- (6) van Kampen, N. G. (1992) Stochastic Processes in Physics and Chemistry. (North-Holland, Amsterdam).
- (7) Van Albada, S. B. (2008) Ph.D. thesis (Vrije Universiteit Amsterdam).
- (8) Tu, Y. (2008) Proc. Natl. Acad. Sci. USA 105, 11737–11741.
- (9) Monod, J, Wyman, J, & Changeux, J.-P. (1965) J. Mol. Biol. 12, 88–118.
- (10) Fahrner, K. A, Ryu, W. S, & Berg, H. (2003) Nature 423, 938.
- (11) Calladine, C. R. (1975 May 8) Nature 255, 121–124.
- (12) Macnab, R. M & Ornston, M. K. (1977 May 5) J Mol Biol 112, 1–30.
- (13) Hotani, H. (1982 Apr 25) J Mol Biol 156, 791–806.
- (14) Darnton, N. C & Berg, H. C. (2007 Mar 15) Biophys J 92, 2230–2236.
- (15) Turner, L, S, R. W, & Berg, H. C. (2000) J. Bacteriol. 182, 2793–2801.
- (16) Kojima, S & Blair, D. F. (2001) Biochemistry 40, 13041–13050.
- (17) Elston, T. C & Peskin, C. S. (2000) Siam J. App. Math 60, 842–867.
- (18) Elston, T. C, You, D, & Peskin, C. S. (2000) Siam J. App. Math 61, 776–791.
- (19) Scharf, B. E, Fahrner, K. A, Turner, L, & Berg, H. C. (1998) Proc. Natl. Acad. Sci. USA 95, 201–206.
- (20) L. Turner, A. D. T. Samuel, A. S. Stern, and H. C. Berg. (1999) Biophys. J. 77, 597–603.
- (21) Block, S. M, Blair, D. F, & Berg, H. C. (1989 Apr 6) Nature 338, 514–518.