The chemical abundances in the Galactic Centre from the atmospheres of Red Supergiants
Abstract
The Galactic Centre (GC) has experienced a high degree of recent star-forming activity, as evidenced by the large number of massive stars currently residing there. The relative abundances of chemical elements in the GC may provide insights into the origins of this activity. Here, we present high-resolution -band spectra of two Red Supergiants in the GC (IRS 7 and VR 5-7), and in combination with spectral synthesis we derive abundances for Fe and C, as well as other -elements Ca, Si, Mg Ti and O. We find that the C-depletion in VR 5-7 is consistent with the predictions of evolutionary models of RSGs, while the heavy depletion of C and O in IRS 7’s atmosphere is indicative of deep mixing, possibly due to fast initial rotation and/or enhanced mass-loss. Our results indicate that the current surface Fe/H content of each star is slightly above Solar. However, comparisons to evolutionary models indicate that the initial Fe/H ratio was likely closer to Solar, and has been driven higher by H-depletion at the stars’ surface. Overall, we find /Fe ratios for both stars which are consistent with the thin Galactic disk. These results are consistent with other chemical studies of the GC, given the precision to which abundances can currently be determined. We argue that the GC abundances are consistent with a scenario in which the recent star-forming activity in the GC was fuelled by either material travelling down the Bar from the inner disk, or from the winds of stars in the inner Bulge – with no need to invoke top-heavy stellar Initial Mass Functions to explain anomalous abundance ratios.
1 Introduction
Understanding the star-formation history at the Galactic Centre (GC) is key to understanding the Galaxy’s secular evolution. The inner 40 pc has clearly experienced a high degree of recent star formation, apparent from the young stellar clusters residing there. These clusters host some of the most massive stars known to exist in the Galaxy – the Arches cluster (Figer et al., 2002), the Quintuplet cluster (Figer et al., 1999) and the Central cluster (Paumard et al., 2006). It remains an open question how these clusters were formed, given the harsh environment of the GC, or whether they were formed in situ in the GC at all.
The key to answering this question may lie in chemical abundance measurements. By probing the relative abundances of certain elements we may infer the star formation history of the Galactic Centre. Broadly, -elements (such as Mg, Ti, Ca, Si) are produced predominantly in the core-collapse supernovae (CCSNe) of massive stars. Meanwhile, Fe-peak elements are produced in Type-Ia SNe, that is the thermonuclear explosion of a low-mass white dwarf which has accreted a sufficient amount of mass from a binary companion to reach the Chandrasekhar limit. Hence, enrichment happens on much shorter timescales (10 Myrs), due to the comparitively brief lifetimes of massive stars; while Fe-enrichment occurs on much longer timescales (Gyrs). In the Galaxy, the ratio of /Fe is found to be lower in the thin disk than in the other Galactic environments of the bulge and thick disk (e.g. Bensby et al., 2004; Rich & Origlia, 2005; Luck et al., 2006). This is commonly explained as being due to the rapid formation of the bulge and halo, where star formation in the early Galaxy was intense but brief, and the elevated abundances from the early CCSNe were ‘frozen-in’. In the thin disk however, star formation has continued throughout the lifetime of the Galaxy, allowing Type-Ia SNe to contribute to the chemical evolution, and driving the /Fe ratio to below that of the halo and bulge. Meanwhile, a gradient of increasing metal content is found at lower Galacto-centric distances () within the disk (e.g. Luck et al., 2006), suggesting that the rate of star formation in the thin disk has been higher toward the GC. However, the absence of suitable probes of metallicity inwards of kpc, combined with the large extiction towards the GC, have meant that it has been unclear whether the trend of increasing metal content flows all the way to the center of the Galaxy.
In recent years, advancements in infra-red astronomy have meant that it is now possible to make abundance measurements of stars in the GC, in order to place this region within the evolutionary framework of the whole Galaxy. Infra-red studies are necessary to work around the 30 magnitudes of visual extinction toward the GC, with many such studies concentrating on the large number of high-mass stars present there. Massive stars provide excellent probes of chemical abundances; their spectra are rich in emission/absorption lines, while their short lifetimes mean that they provide an up-to-date picture of the local metallicity.
In studies of hot stars, Najarro et al. (2004) and Martins et al. (2008) both attempted to infer the initial O abundance of the Arches cluster from the asymptotic nitrogen abundances of the cluster’s most evolved stars. When comparing the results of both studies to the latest stellar evolutionary models, in which the relative abundance ratios of the heavy elements are fixed, each study suggests a slightly super-Solar global metal content , though neither study was able to give abundances of specific or Fe-peak elements. In a study of two Luminous Blue Variables (LBVs) in the Quintuplet cluster Najarro et al. (2008) was able to make direct measurements of Fe content, plus the -elements Si and Mg. They found Fe to be approximately Solar, while Si and Mg were enhanced by 0.30.2dex with respect to Solar values. Geballe et al. (2006) studied the star IRS 8 in the Central cluster using low-resolution -band spectroscopy. They argued that the 2.116m feature, which is thought to be a blend of C iii, N iii and O iii transitions, was sensitive to O content, and used it to derive an O abundance which was super-Solar at the 2 level when compared to the Asplund et al. (2005) Solar abundances111When the abundances from the 1-D Solar model of Grevesse & Sauval (1998) are used, the derived O abundance is consistent with Solar..
There have also been several studies of cool massive stars, specifically Red Supergiants (RSGs). Carr et al. (2000) performed the first abundance study of a star in the GC, modelling the high resolution and spectrum of the Red Supergiant (RSG) in the Central cluster IRS 7. They found approximately Solar values for Fe to within their quoted uncertainties, with a depletion of O with respect to solar likely due to internal CNO processing. Ramírez et al. (2000) analysed a further five RSGs in the central cluster, using -band high resolution data, again finding Fe content consistent with Solar. Ramirez et al. also studied the Quintuplet RSG VR5-7, finding an Fe abundance consistent with the rest of their sample. Cunha et al. (2007) analysed this same set of stars as the Ramirez et al. sample, adding -band spectra to the dataset. Again, Solar Fe content was found, but they also found marginal evidence for enhancement: the ratios of both O/Fe and Ca/Fe were found to be above Solar at the 2 level, again in comparison to the Asplund et al. Solar values.
Studies of GC Hii regions have also yielded marginal evidence for super-Solar abundances (Simpson et al., 1995; Rudolph et al., 2006). Analysis of X-ray spectroscopy of the Sg A East supernova (SN) remnant by Sakano et al. (2004) shows strong evidence for -enrichment, however if the object is a remnant of a core-collapse SN one expects to see significant self-enrichment of the -elements.
The results described above are all somewhat consistent with a picture of chemical abundances in the GC which are Solar to within the uncertainties, with marginal evidence for -enhancement. Several authors have suggested that the super-Solar /Fe ratio is real, and is indicative of the star forming history in the GC. Several explanations have been suggested to explain this result:
-
•
A recent burst of star-formation produced a great number of massive stars, which evolved to core-collapse SNe. This has enriched the local environment in -elements, an effect which can now be seen in the surface abundances of subsequent generations of stars. However, this is generally inconsistent with the mix of old, intermediate and young stellar populations found in the GC. Analyses of the GC’s H-R diagram and luminosity function have led various authors to argue for a constant rate of star-formation over the last Gyr, rather than an isolated burst (e.g. Blum et al., 2003; Figer et al., 2004; Maness et al., 2007).
-
•
The harsh environment of the GC results in a Jeans mass larger than in the rest of the Galaxy, and produces a top-heavy Initial Mass Function (IMF) (Morris, 1993). The increased rate of CCSNe due to the higher fraction of massive stars results in a /Fe ratio above that of the disk. This is consistent with the results of Maness et al. (2007), who argued for a top-heavy IMF when comparing the observed GC H-R diagram with quantitative model predictions.
-
•
The GC’s source of star-forming material is provided by the winds of Red Giants in the Bulge, which tend to have high /Fe ratios. Thus the natal material was already -enriched before it arrived at the GC (Morris & Serabyn, 1996).
However, as stated above, the evidence for a high /Fe ratio is marginal. Works which study both the Fe and content directly are limited to Cunha et al. (2007) and Najarro et al. (2008); the former studied O and Ca, while the latter studied Si and Mg. Oxygen can be a poor tracer of abundances in massive stars, as to some extent it is processed by nuclear burning and can give results which are not representative of the other elements.
Here we present an abundance study of two of the GC RSGs, IRS 7 in the Central cluster and VR 5-7 in the Quintuplet cluster. For the first time we study a range of -elements – Ca, Si, Mg, O and Ti – while also studying Fe and C.
Our method is both independent and complementary to the previous studies of these stars by Carr et al. (2000), Ramírez et al. (2000) and Cunha et al. (2007), providing full spectral synthesis of the observed spectra and equivalent width measurements of selected lines. This method has been proven to be effective in determining chemical abundances of low mass giants in the Galactic bulge (e.g. Origlia et al., 2002, 2005; Rich et al., 2007) as well as of young stellar clusters dominated by red supergiants (Larsen et al., 2006, 2008).
2 Observations & data reduction
Observations were taken with NIRSPEC, the cross-dispersed echelle spectrograph mounted on Keck-II, during the night of 3rd June 1999. We used the instrument in high-resolution mode, with the NIRSPEC-5 filter, in conjunction with the 0.576′′ 12′′ slit. The dispersion angle was set to 62.53∘, with cross-dispersion angle set to 35.53∘. This gave us a spectral resolution of 17,000 of select regions in the wavelength range of 1.5-1.7m.
We integrated on each star for 20s in each of two nod-positions along the slit. In addition to the cluster stars, we also observed HD 104337, a B2 IV star, as a telluric standard on each night. Flat-fields were taken with a continuum lamp. For wavelength calibration purposes, arc frames were taken with Ar, Ne, Xe and Kr lamps to provide as many template lines as possible in the narrow wavelength range of each spectral order. As high-precision radial velocity measurements were not required for this study, no etalon frames were taken.
We subtracted nod-pairs of frames to remove the sky background, dark current and detector bias level. Each frame was then flat-fielded using the continuum-lamp exposures. We corrected for the warping of each order in a process known as rectification. The warping in the spatial and dispersion directions were characterized by fitting 3rd-degree polynomials to the two star-traces in a nod-pair and the arc lines respectively. These fits were then used to resample each order onto a linear grid. As the arc-line wavelengths are known, this process also wavelength-calibrates the data.
Cosmic ray hits and bad pixels were identified by taking the ratio of two spectra of the same object, and identifying values lying outside 5 of the residual spectrum. These values were replaced with the median value of the three neighbouring pixels either side. We removed the H and He i absorption features of the telluric standard via linear interpolation. The atmospheric absorption features in the science frames were then removed by dividing through by the telluric standard. Finally, the spectra were normalised by dividing through by the median continuum value. The dense absorption-line spectra make signal-to-noise ratio (SNR) estimates difficult, but we estimate from weak features we know are real that the SNR is better than 100 for all stars observed.
2.1 Data analysis
Abundance analysis is performed by using full spectral synthesis techniques and equivalent width measurements of representative lines. Indeed, at the NIRSPEC resolution of 17,000 a few single roto-vibrational OH lines and CO bandheads can be measured and used to derive accurate oxygen and carbon abundances. Abundances of other metals can be derived from the atomic lines of Fe I, Mg I, Si I, Ti I, and Ca I.
Photometric estimates of the stellar parameters are initially used as input to compute a grid of synthetic spectra of red supergiant stars with varying atmospheric parameters and abundances, by using an updated (Origlia et al., 2002, 2003) version of the code described in Origlia et al. (1993). Briefly, the code uses the LTE approximation and is based on molecular blanketed model atmospheres of Johnson et al. (1980). The code includes several thousands of near IR atomic lines and molecular roto-vibrational transitions due to CO, OH and CN. Three main compilations of atomic oscillator strengths are used, namely the Kurucz database222http://cfa-www.harward.edu/amdata/ampdata/kurucz23/sekur.html, and those published by Biemont & Grevesse (1973) and Meléndez & Barbuy (1999).
Abundance estimates are mainly obtained by best-fitting the full observed spectrum and by measuring the equivalent widths of a few selected features, dominated by a specific chemical element – see Table 1 for a list of some of the the diagnostic lines, along with their oscillator stregths and excitation potentials. The H-band spectra of RSGs contain thousands of absorption lines, and we concentrate on fitting those spectral features which are relatively unblended and which have reliable atomic/molecular data. We do not attempt to fit features which are blends of poorly-understood transitions. Typical equivalent width values of fitted features range between 300 and 800 mÅ with a conservative error of 20 mÅ to also account for a 2% uncertainty in the continuum positioning.
For initial estimates of we use the values quoted by Cunha et al. (2007). We also use the intrinsic luminosities determined in this paper in combination with the Geneva evolutionary models to estimate the surface gravity . The values of and the microturbulent velocity are fine-tuned using the CO and OH lines, which are sensitive to these parameters. We found that and km s-1 provided good fits for both stars.
We note that the parameter of macroturbulence is not specifically included in our current analysis. In previous spectral synthesis studies of the objects in this paper authors have required the inclusion of macroturbulent velocities in the region of 15-25 km s-1. However, as these values are comparable to the spectral resolution of our observations (18 km s-1), we do not attempt to constrain this parameter. We do find some evidence for an additional broadening component in the spectrum of IRS 7, this is discussed further in Sect. 3.
The model which better reproduces the overall observed spectrum and the equivalent widths of selected lines is chosen as the best fit model for that particular spectrum. In order to check the statistical significance of our best-fit solution, we compute a set of six test models with varying stellar parameters of Teff=200 K, 0.5dex, and 1 km s-1. For each test model, the abundances are fine-tuned to produce the best fit in that model, typically by 0.2dex. We then compute the residuals between these models and the observed spectrum. We find that our best-fit model always produces significantly lower residuals than the test models (see Fig. 2). This process was repeated with smaller variations in the stellar parameters of the test models until we found a set of test models which produced residuals comparable to those of the best-fit model. We found that models with Teff=100 K, 0.3dex) and 0.5 km s-1 had the same statistical significance as our best-fit model . We adopt these values as the experimental uncertainties in each parameter. The uncertainties in abundance levels varies from element to element, and depends on other factors such as blending and continuum placing. The abundance uncertainties are typically in the range 0.1-0.2dex.

| Ca i | Fe i | Fe i | Mg i | Si i | OH | OH | Ti i | |
|---|---|---|---|---|---|---|---|---|
| 1.61508 | 1.61532 | 1.55317 | 1.57658 | 1.58884 | 1.55580 | 1.55036 | 1.55437 | |
| Log gf | 0.362 | -0.821 | -0.357 | 0.380 | -0.030 | -5.492 | -7.687 | -1.480 |
| (eV) | 5.302 | 5.35 | 5.64 | 5.93 | 5.08 | 0.30 | 0.84 | 1.88 |
| EW (mÅ) | ||||||||
| IRS7 | 412 | 420 | 360 | 520 | 745 | 529 | 505 | 352 |
| VR5-7 | 468 | 410 | 303 | 532 | 704 | 597 | 628 | 345 |
| Reference | / km s-1 | A(Fe) | A(O) | A(Si) | A(Mg) | A(Ca) | A(Ti) | A(C) | ||
|---|---|---|---|---|---|---|---|---|---|---|
| IRS 7 | ||||||||||
| This work | 3600 | 0.0 | 3.0 | 7.59 | 8.11 | 7.75 | 7.53 | 6.46 | 5.22 | 7.77 |
| 200 | 0.3 | 0.5 | 0.10 | 0.13 | 0.18 | 0.15 | 0.16 | 0.11 | 0.07 | |
| Carr et al. 2000 | 3600 | -0.6 | 3.0 | 7.50 | 8.13 | – | – | – | – | 7.78 |
| 230 | 0.2 | 0.3 | 0.13 | 0.32 | – | – | – | – | 0.13 | |
| Cunha et al. 2007 | 3650 | -0.5 | 3.2 | 7.66 | – | – | – | 6.86 | – | – |
| 150 | 0.3 | 0.3 | 0.15 | – | – | – | 0.15 | – | – | |
| Ramirez et al. 2000 | 3470 | -0.6 | 3.3 | 7.61 | – | – | – | – | – | – |
| 250 | 0.2 | 0.4 | 0.27 | – | – | – | – | – | – | |
| Average Central Cluster abundances: | ||||||||||
| Cunha et al. 2007 | – | – | – | 7.59 | 9.04 | – | – | 6.57 | – | – |
| – | – | – | 0.15 | 0.19 | – | – | 0.14 | – | – | |
| Ramirez et al. 2000 | – | – | – | 7.61 | – | – | – | – | – | – |
| – | – | – | 0.22 | – | – | – | – | – | – | |
| VR 5-7 | ||||||||||
| This work | 3400 | 0.0 | 3.0 | 7.55 | 9.09 | 7.65 | 7.53 | 6.50 | 5.15 | 8.22 |
| 200 | 0.3 | 0.5 | 0.10 | 0.11 | 0.14 | 0.14 | 0.13 | 0.09 | 0.07 | |
| Cunha et al. 2007 | 3600 | -0.15 | 2.6 | 7.60 | – | – | – | 6.51 | – | – |
| 150 | 0.3 | 0.3 | 0.15 | – | – | – | 0.15 | – | – | |
| Ramirez et al. 2000 | 3500 | -0.2 | 2.9 | 7.61 | – | – | – | – | – | – |
| 300 | 0.3 | 0.5 | 0.23 | – | – | – | – | – | – | |
| Average Quintuplet Cluster abundances: | ||||||||||
| Najarro et al. 2008 | – | – | – | 7.54 | – | 7.85 | 7.84 | – | – | – |
| – | – | – | 0.15 | – | 0.25 | 0.20 | – | – | – | |
| Solar values | ||||||||||
| Grevesse & Sauval 1998 | – | – | – | 7.50 | 8.83 | 7.55 | 7.52 | 6.36 | 5.02 | 8.57 |
| – | – | – | 0.05 | 0.06 | 0.05 | 0.05 | 0.02 | 0.06 | 0.06 | |
| Asplund et al. 2005 | – | – | – | 7.45 | 8.66 | 7.51 | 7.53 | 6.31 | 4.90 | 8.39 |
| – | – | – | 0.05 | 0.05 | 0.04 | 0.09 | 0.04 | 0.06 | 0.05 | |

3 Results & Discussion
In Fig. 1 we show select regions of each stars’ spectrum containing diagnostic lines, with the best-fit model overplotted. In the case of VR 5-7 we found we were able to fit the diagnostic lines without the inclusion of any additional broadening. Therefore, any macroturbulence present must be below or comparable to the instrumental broadening – the spectral resolution of our observations, 18 km s-1. This is consistent with previous studies of this object at higher spectral resolution, which have required macroturbulent velocities of 12-15 km s-1 (Ramírez et al., 2000; Cunha et al., 2007).
For IRS 7, we found that the fit could be improved by convolving the spectrum with a broadening profile – either using a Doppler profile of 20 km s-1, or by increasing the gaussian (instrumental) broadening to 27 km s-1. These values are consistent with macroturbulent velocities of 20-25 km s-1 used by Ramirez et al. and Cunha et al. in their fits to higher resolution spectra. The fit to IRS 7 shown in Fig. 1 includes this extra Doppler broadening. In general, we found that we were unable to achieve the same quality of fit for IRS 7 as for VR 5-7, and this is reflected in the slightly increased uncertainties in the derived elemental abundances. One possible explanation for this could be the interaction of the star’s outer atmosphere with nearby hot stars, augmenting the ionization structure and/or inducing departures from spherical symmetry in IRS 7’s envelope (Serabyn et al., 1991; Yusef-Zadeh & Morris, 1991; Yusef-Zadeh & Melia, 1992).
In Table 2, the derived abundances are shown for each element studied, as well as the derived stellar temperature. We find temperatures gravities and microturbulent velocities for each star which are in good agreement with previous studies of the same objects. We quantify the abundance of each element in the form . We also tabulate the abundances derived for the same stars by other authors using independent methods. Finally, we also show the average abundances derived for the stars’ host clusters from other independent studies in the literature. Below, we describe the elemental abundances individually.
3.1 Iron
From Table 2 we see that the Fe abundances we derive are in excellent agreement with previous studies of the same objects. They are also consistent with the average abundances of their host clusters: our measurement of for IRS 7 agrees perfectly with the average (Fe) of 10 RSGs in the Central cluster studied by Cunha et al. (2007, ), and the 9 RSGs observed by Ramírez et al. (2000, ). Our measurement for VR 5-7 () is also consistent with the average of the two LBVs studied by Najarro et al. (2008, ).
When comparing the measured Fe composition for the two GC RSGs to Solar abundances, we use the latest Solar Fe composition from the 3-D Solar model of Asplund et al. (2005, see Table 2). We find Fe abundances with respect to Solar [Fe/H] of for IRS 7, and for VR 5-7, where the uncertainties are the quadrature sum of those in our measurements and those in the Solar values. Neither of these values represent a statistically-significant detection of a departure from Solar abundances. In order to minimise uncertainties, we consider our analysis in combination with previous studies whose analysis techniques were complementary to our own. As the studies by Carr et al. (2000), Ramírez et al. (2000) and Cunha et al. (2007) were essentially all made using similar methodology to one another, we do not consider these three studies as being mutually independent. Instead, we take the measurements of Cunha et al. (2007) to be the state-of-the-art among these studies. The average of Cunha et al.’s result for IRS 7 and ours is (), which agrees well with the average Central cluster value they found. Similarly, for VR 5-7 the average is (). With respect to the Solar values of Asplund et al. (2005), this gives [Fe/H] and [Fe/H].
From these measurements, it appears that there is evidence for slight Fe enhancement within the massive evolved stars at the GC. The uncertainties we state above are the simple root-mean-square of the abundances derived by Cunha et al. (2007) and ourselves. It is likely that, at the uncertainty level of a few percent, we are dominated by systematic uncertainties which in some way afflict both studies, such as departures from LTE in the stars’ atmospheres. Thus, we conclude that the two stars studied have surface Fe abundances which are 30-50% above that of Solar, though at this level we are hitting the precision limits of stellar abundance analyses.
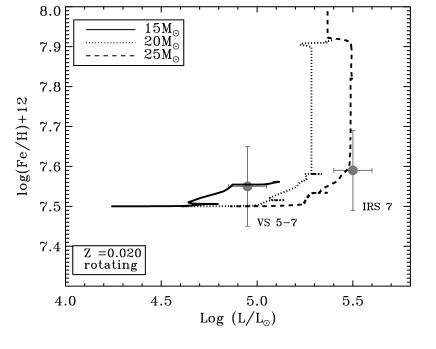
However, when interpreting these results one must consider the evolved nature of the objects studied. As it is likely that the atmospheres of the stars suffer from H depletion due to core H burning and deep convective mixing, the initial Fe abundances of the stars may well have been entirely consistent with the Solar level. This is illustrated in Fig. 3, in a plot of Fe/H against stellar luminosity for the rotating Geneva stellar evolutionary models presented in Hirschi et al. (2004). The plot shows how the Fe/H abundance ratio increases as stars evolve off the main-sequence and the products of nuclear burning begin to become apparent at the surface. On average, the surface Fe/H ratio is 0.1dex lower during the RSG phase than on the main-sequence.
From comparison with our Fe measurements for the two GC RSGs, it appears that while both stars currently show marginal evidence for Fe enhancement, their initial Fe/H composition was likely much closer to Solar. Similarly, the previous studies of stars in the GC by e.g. Najarro et al. (2008) and Cunha et al. (2007) are consistent with Solar initial Fe abundances if one considers the evolved nature of the objects studied.
Finally, we note that a depletion in H due to stellar nucleosynthesis implies a corresponding increase in He in the stellar envelope. This has no impact on our analysis method, as the opacity in RSG atmospheres is fully dominated by H-, even if H is marginally depleted.
3.2 -elements
In this study we have determined the abundances of several -elements: Ca, Si, Mg, O, Ti and C. The interpretation of the abundances of C and O is not as straight-forward as with the other elements, as they are altered by stellar nucleosynthesis. For this reason we will discuss O separately at the end of this section, and C in Sect. 3.3. For the rest of this study we define (Ca, Si, Mg, Ti).
Literature -element studies of these two stars are lacking; the only previous study being the derivation of Ca abundances by Cunha et al. (2007). From Table 2, we find excellent agreement with their Ca abundance for VR 5-7. For IRS 7, we find discrepancies between our two measurements of . However, we note that Cunha et al. (2007) find an average (Ca) for the Central cluster of , consistent with our measurement for IRS 7 (). If the Ca abundances in the Central cluster are homogeneous, it may be that, in Cunha et al.’s sample, IRS 7 represents a random statistical outlier at the 2 level – entirely plausible in a sample size of 10. We consider our (Ca) measurements to be in good agreement with those of Cunha et al.
Najarro et al. (2008) studied the -elements Si and Mg in the spectra of the two LBVs in the Quintuplet cluster, finding marginal evidence for enhancement with respect to Solar, but with large uncertainties of 0.2-0.25 dex. Given these uncertainties, our measurements of Si and Mg in the spectrum of VR 5-7 are consistent with those determined by Najarro et al. for stars in the same cluster.
Overall, on average we find that the -elements studied here are overabundant with respect to Solar by dex. This excess is clearly within the uncertainties associated with each measurement. If, for the moment, we assume that each element represents an independent measurement, we can combine the abundances for all four -elements studied here to determine the average -abundance for each star. We find average abundances for each star of [/H]; and [/H], where the quoted errors are the rms scatter of the individual -element abundances. However, as was described in the previous section, these abundance ratios may be tainted by 0.1dex of H self-depletion due to the stars’ evolution. Thus, we consider the initial /H abundances of the two stars to be in excellent agreement with the Solar value.
The parameter of relevence to the study of the GC’s star-formation history is the ratio /Fe: as stated in the introduction, -elements are enriched by CCSNe, while Fe is enriched by Type-Ia SN. Hence, a short burst of massive star formation should produce an over-abundance of -elements with respect to Fe; while a long star-forming epoch over Gyr eventually pulls the /Fe ratio back down. From the average Fe/H and /H for each star in this study, we find [/Fe]; and [/Fe]. We find no evidence for -enrichment with respect to iron in these stars.
For oxygen, comparisons of relative abundances between objects are hindered by confusion over the Solar O abundance used as a reference point. In the 1-D Solar model, the O fraction was found to be (O), a value which stayed constant to within the errors over several revisions (Anders & Grevesse, 1989; Grevesse & Noels, 1993; Grevesse & Sauval, 1998). However, in the 3-D Solar model, the O fraction has been revised downwards to (O) (Asplund et al., 2005). For the rest of this discussion, we use the Asplund et al. value.
For IRS 7, we find O/H to be depleted by 0.550.14 dex with respect to Solar, in good agreement with the study by Carr et al. (2000) of the same star. However, this is much lower (0.9dex) than the average O abundance of the star’s host cluster: Cunha et al. (2007) found the Central cluster to have an average super-Solar O/H ratio of 0.380.20 dex. Interestingly, we find the O abundance of VR 5-7 in the neighbouring Quintuplet cluster to be similar to the average of Central cluster (). The anomolous O abundance of IRS 7 with respect to the rest of the GC RSGs could be explained as global super-Solar O/H of RSGs in the GC, with severe O depletion at the surface of IRS 7 due its advanced evolutionary state – this stars’ evolution is discussed in more detail in the next section. We find O abundances relative to Fe for the two objects of [O/Fe]; and [O/Fe].
In summary, we find that the abundances in the GC are consistent with Solar, both as a fraction of H and Fe. We suggest that there may be a slight enhancement of O with respect to H, though we treat this result with caution due to the recent controversy over the Solar O abundance.
3.3 Carbon
As with oxygen, the Solar carbon abundance has also been revised downwards in the 3-D Solar model, from (C) (Anders & Grevesse, 1989; Grevesse & Noels, 1993; Grevesse & Sauval, 1998) to (C) (Asplund et al., 2005). We use the Asplund et al. value in this discussion.
Regardless of the adopted value of (C)⊙, we find strong evidence for C depletion in IRS 7. For this object we derive (C), in good agreement with the previous study of by Carr et al. (2000). This represents a carbon abundance relative to Solar of [C/H] = -0.62 0.09. This is in contrast to VR 5-7, which is only marginally depleted in C compared to the Solar value.
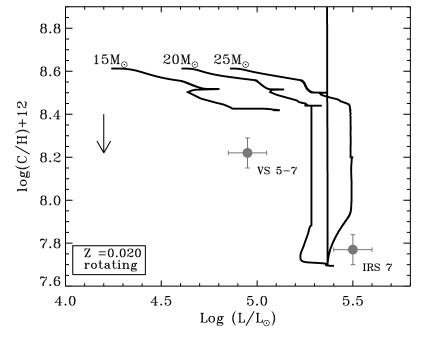
In Fig. 4 we plot (C) for each star studied against their luminosities, which we take from Cunha et al. (2007). To illustrate the level of C-depletion as a function of the stars’ evolution, we overplot the theoretical mass-tracks of Hirschi et al. (2004), calculated at Solar metallicity and which incorporate initial rotational velocities of 300 km s-1. We note that these tracks were created using the relative abundances of Anders & Grevesse (1989) and Grevesse & Noels (1993), and therefore use the higher initial C fractions described above. Thus, all other things being equal333We make the assumption that changes of a few 0.1dex in the relative abundances of C and O will not affect, for example, reaction rates or envelope opacties such that the evolutionary path of the star would be significantly altered from those plotted in Fig. 4, other than the linear displacement in abundance-space., the tracks should be displaced by -0.18dex in (C) if the latest relative C abundance is used. This is indicated by the arrow in the plot panel.
From the figure, we see that VR 5-7 is in good agreement with the 15⊙ track, even if the track is moved downwards to reflect the updated C fraction. However, the heavy depletion of C in IRS 7 is not reproduced by the mass-tracks, even when the lower value for (C)⊙ is taken into account. The sharp downturn in (C) of the 25⊙ track corresponds to the removal of the H-rich envelope and the evolution of the star away from the RSG stage towards a Wolf-Rayet phase. On the 25⊙ mass-track, the minimum (C) reached during the RSG phase is similar to the minimum (C) of the 15⊙ and 20⊙ tracks, at (C)8.45.
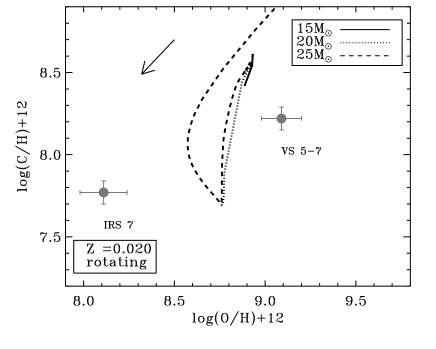
We explore the subject of the stars’ evolutionary state further in the right-hand panel of Fig. 4, where we plot the carbon fraction against the oxygen fraction for the two stars. The location in the panel synonymous with the RSG phase corresponds to the lower-left end of the 15⊙ and 20⊙ tracks at [(O), (C)] . If, as above, we again make the assumption that the mass-tracks can simply be displaced to represent the updated Solar abundances, the star VR 5-7 appears to be enhanced in O with respect to the evolutionary tracks. IRS 7 on the other hand shows severe depletion in both C and O, much more than is predicted by the evolutionary models for an RSG with Solar initial abundances. Indeed, the position of IRS 7 in (C)-(O) space is more consistent with the (C) minimum of the 25⊙ track. In the model, this corresponds to a nitrogen-rich Wolf-Rayet (WN) phase, where the products of CNO burning are more readily seen due to the removal of the outer envelope by the stellar wind. Our results suggest that the envelope of IRS 7 has experienced a greater level of pollution by CNO-processed material than is predicted by the standard set of rotating evolutionary models. This may have been caused by particularly deep convection zones in the star’s atmosphere, or by enhanced rotational mixing due to a high initial rotation velocity. Alternatively, a high mass-loss phase could have peeled away the outer layers, revealing more chemically-processed material, but without removing enough H to cause the drop the envelope opacity required for the star to evolve back to the blue.
3.4 Summary and discussion: chemical abundances in the Galactic Centre
The results of our abundance analyses of two RSGs in the GC can be summarized as follows:
-
•
The observed Fe/H ratios of the two stars studied are marginally super-Solar, in agreement with previous studies.
-
•
For the -elements Ca, Si, Mg and Ti together, we find enhancement with respect to H by 40-60%, albeit at the 2 confidence level. The /Fe ratios are Solar to within the errors (25%), a result which is again consistent with previous studies.
-
•
Weak evidence for O-enrichment is found in VR 5-7, while IRS 7 is heavily O-depleted - most likely a result of its advanced evolutionary state.
-
•
We find significant C depletion in the atmospheres of both stars. In the case of VR 5-7, this is consistent with the predictions of a 15-20⊙ RSG in the rotating Geneva evolutionary models. IRS 7 however has much greater C depletion. In combination with this star’s low O abundance, this suggests that the products of severe CNO processing are been seen at the star’s surface.
As summarized in Sect. 1, several previous studies of objects in the GC have argued for super-Solar metal abundances in the GC (Carr et al., 2000; Ramírez et al., 2000; Cunha et al., 2007; Najarro et al., 2008). We emphasize here that, where available, we measure elemental abundances for Fe and several -elements that are consistent with these studies. However, in the interpretation of their results these previous studies did not take into account the self-depletion of H at the surfaces of the stars due to nuclear burning and internal mixing. We have shown, with the aid of evolutionary models, that this level of self-depletion RSGs may be as large as 0.1dex, and is comparable to the observed level metal enhancement with respect to H. Hence, the super-Solar ratios may simply be an artifact of H-depletion rather than being due to enriched metal abundances, and the initial abundance ratios of the stars were consistent with Solar levels. When taking this effect into account, we interpret the results differently to previous works and conclude that the metallic elemental abundances in the GC are Solar, at least to within the precision to which we are currently able to measure them. In addition, we find that the ratio /Fe is also Solar to within the errors.
Thus, with a Solar /Fe ratio in the GC it is not necessary to invoke a peculiar star-forming history, such as a significantly flattened IMF. Nor do we need to reconcile a super-Solar /Fe ratio with star-formation which has been continuous for the last Gyr (see Sect. 1, and Figer et al., 2004). We again emphasize that our results of Solar /Fe and Solar Fe/H to within the uncertainties are in agreement with previous studies when H-depletion due to nuclear processing is taken into account.
So, how do these abundance patterns fit in with the rest of the Galaxy? A Solar Fe abundance in the GC is certainly inconsistent with a simple extrapolation of the disk’s Fe gradient to lower Galacto-centric distances. Luck et al. (2006) summarize the recent results of their group and show a clear trend of increasing Fe/H towards the GC from a large sample of Cepheids. They derive a gradient of -0.068dex kpc-1, which when extrapolated all the way to the GC implies . Our results, as well as those of other recent studies, show that the Fe/H ratio in the GC is more consistent with that of the inner disk, at kpc (see below).
As noted by Cunha et al. (2007), reconciliation between the disk Fe/H and that of the GC require that the Fe/H gradient become significantly flattened inside kpc. However, there is no reason to assume that this abundance gradient can simply be extrapolated all the way to the GC. Shortward of kpc there is a distinct lack of recent star-forming activity: there is a dearth of giant HII regions and massive stars between 0.1kpckpc. Presumably this is related to the presence of the Galactic Bar, which extends to kpc (Benjamin et al., 2005). This obvious and sharp transition in star-formation history makes it unlikely that the abundance gradients in the outer Galaxy are valid within kpc.
We are left with the problem of explaining the abundance patterns in the GC, with respect to those in the rest of the Galaxy. In external barred-spiral galaxies, it is commonly accepted that the effect of the bar is to transport gas from the inner disk to the galaxy’s centre – see for example the observational studies of M100 (Allard et al., 2006) and NGC1365 (Zánmar Sánchez et al., 2008), as well as numerical work (e.g. Athanassoula, 1992). Material infalling onto the galactic centre becomes shocked, and a nuclear starburst is triggered. This starburst can continue for as long as the centre is supplied with material. For an extensive review of the secular evolution of barred spiral galaxies, the reader is directed to Kormendy & Kennicutt (2004).
If the star-formation in the centre of our own Galaxy is being fuelled by matter transported down the Bar, one would expect to find similar abundance patterns at the GC as at the edges of the Bar. That is, the abundances we find in the thin disk at Galacto-centric distances of kpc. Abundance studies at these radii are few. The cepheid data from Luck et al. (2006) becomes scarce at kpc with only one data-point at kpc. From their inner-most data they find [Fe/H]0.2-0.3dex and [Ca/Fe]0.0. Smartt et al. (2001), Daflon & Cunha (2004) and Munn et al. (2004) have observed a total of 6 OB stars within kpc, finding weak evidence for a super-Solar O/H ratio, but with a large spread. Analysis of the Scutum Red Supergiant clusters, located at kpc, has revealed abundances which are 0.2dex below Solar (Davies et al., in prep). In their discussion of this result in the context of other abundance measurements in the GC, Davies et al. suggest that the abundances at from 3 to 5 kpc are approximately Solar, with Solar /Fe, but with a spread of 0.25dex. The abundance gradient between the inner disk and our location in the Galaxy must then be very shallow, as is typical for galaxies with strong bars (Zaritsky et al., 1994). Andrievsky et al. (2002) suggested that the gradient is extremely flat in the Solar neighbourhood (-0.02dex kpc-1), and steepens at kpc. However, we will show in a forthcoming paper (Davies et al., in prep) that this steepening may be an artifact of their spatial sampling, that large azimuthal variations may be present within kpc, and that this behaviour is seen in the inner disks of other barred spirals.
The abundances found at kpc are then similar with those we find at the GC; namely Fe/H, /Fe and O/Fe which are all approximately Solar to within the uncertainties of 20-30%. Hence, from a chemistry point-of-view it is entirely plausible that the star-formation in the GC is fuelled by material channelled from the inner-disk by the Bar, in a manner similar to that seen in external barred spirals. Further, the rate at which material flows down the Bar seems to be consistent with the global star-formation rate in the GC. Morris & Serabyn (1996) use order-of-magnitude dynamical arguments to estimate the rate of material flowing from the Inner Lindblad Resonance (ILR) to be ⊙yr-1; while Güsten (1989) estimate the GC star-formation rate to be 0.3-0.6 ⊙yr-1from the inferred number of Lyman photons. Hence, the rate of inflowing material appear to be sufficient to power the GC star-formation, even when one takes into account the outward-flowing Galactic wind ( ⊙yr-1 Morris & Serabyn, 1996).
Clearly, there are large uncertainties on these numbers, and we cannot discard the contribution of the winds from Bulge stars. Abundance studies of these objects have found similar average values of [Fe/H] and [O/Fe], albeit with a large spread in [Fe/H] of 0.4dex (Rich & Origlia, 2005; Cunha & Smith, 2006; Lecureur et al., 2007; Fulbright et al., 2007). The total mass-loss rate from these objects with kpc has been estimated to be 0.1 ⊙yr-1, though it is unknown how much of this material finds its way to the GC. If one wishes to add a further layer of complexity to the problem, it is possible that metal-rich gas from recent generations of massive stars mixes with metal-poor gas from the bulge stars’ winds to contrive current abundance levels which appear approximately Solar (see also van Loon et al., 2003).
In summary, from our abundance analysis of two RSGs in the GC, combined with the results of other studies, we find that both the Fe abundance and the /Fe ratio are consistent with Solar values, and those of the inner Galactic disk at kpc. When combined with mass-budget arguments, these results suggest that the recent star-formation in the GC was fuelled by material channelled along the Galactic Bar from the inner disk, though we cannot rule out a contribution from the winds of Bulge giants. Thus, there is no need to invoke of a top-heavy IMF to produce the relative chemical abundances. However, if a top-heavy IMF does exist in the GC, abundance levels in the GC may be held at Solar by a contribution of metal-poor gas from the winds of bulge giants.
References
- Allard et al. (2006) Allard, E. L., Knapen, J. H., Peletier, R. F., & Sarzi, M. 2006, MNRAS, 371, 1087
- Anders & Grevesse (1989) Anders, E. & Grevesse, N. 1989, Geochim. Cosmochim. Acta, 53, 197
- Andrievsky et al. (2002) Andrievsky, S. M., Bersier, D., Kovtyukh, V. V., Luck, R. E., Maciel, W. J., Lépine, J. R. D., & Beletsky, Y. V. 2002, A&A, 384, 140
- Asplund et al. (2005) Asplund, M., Grevesse, N., & Sauval, A. J. 2005, in Astronomical Society of the Pacific Conference Series, Vol. 336, Cosmic Abundances as Records of Stellar Evolution and Nucleosynthesis, ed. T. G. Barnes, III & F. N. Bash, 25–+
- Athanassoula (1992) Athanassoula, E. 1992, MNRAS, 259, 345
- Benjamin et al. (2005) Benjamin, R. A., Churchwell, E., Babler, B. L., Indebetouw, R., Meade, M. R., Whitney, B. A., Watson, C., Wolfire, M. G., Wolff, M. J., Ignace, R., Bania, T. M., Bracker, S., Clemens, D. P., Chomiuk, L., Cohen, M., Dickey, J. M., Jackson, J. M., Kobulnicky, H. A., Mercer, E. P., Mathis, J. S., Stolovy, S. R., & Uzpen, B. 2005, ApJ, 630, L149
- Bensby et al. (2004) Bensby, T., Feltzing, S., & Lundström, I. 2004, A&A, 415, 155
- Biemont & Grevesse (1973) Biemont, E. & Grevesse, N. 1973, Atomic Data and Nuclear Data Tables, 12, 217
- Blum et al. (2003) Blum, R. D., Ramírez, S. V., Sellgren, K., & Olsen, K. 2003, ApJ, 597, 323
- Carr et al. (2000) Carr, J. S., Sellgren, K., & Balachandran, S. C. 2000, ApJ, 530, 307
- Cunha et al. (2007) Cunha, K., Sellgren, K., Smith, V. V., Ramirez, S. V., Blum, R. D., & Terndrup, D. M. 2007, ApJ, 669, 1011
- Cunha & Smith (2006) Cunha, K. & Smith, V. V. 2006, ApJ, 651, 491
- Daflon & Cunha (2004) Daflon, S. & Cunha, K. 2004, ApJ, 617, 1115
- Figer et al. (1999) Figer, D. F., McLean, I. S., & Morris, M. 1999, ApJ, 514, 202
- Figer et al. (2002) Figer, D. F., Najarro, F., Gilmore, D., Morris, M., Kim, S. S., Serabyn, E., McLean, I. S., Gilbert, A. M., Graham, J. R., Larkin, J. E., Levenson, N. A., & Teplitz, H. I. 2002, ApJ, 581, 258
- Figer et al. (2004) Figer, D. F., Rich, R. M., Kim, S. S., Morris, M., & Serabyn, E. 2004, ApJ, 601, 319
- Fulbright et al. (2007) Fulbright, J. P., McWilliam, A., & Rich, R. M. 2007, ApJ, 661, 1152
- Geballe et al. (2006) Geballe, T. R., Najarro, F., Rigaut, F., & Roy, J.-R. 2006, ApJ, 652, 370
- Grevesse & Noels (1993) Grevesse, N. & Noels, A. 1993, in Origin and Evolution of the Elements, ed. S. Kubono & T. Kajino, 14–+
- Grevesse & Sauval (1998) Grevesse, N. & Sauval, A. J. 1998, Space Science Reviews, 85, 161
- Güsten (1989) Güsten, R. 1989, in IAU Symposium, Vol. 136, The Center of the Galaxy, ed. M. Morris, 89–+
- Hirschi et al. (2004) Hirschi, R., Meynet, G., & Maeder, A. 2004, A&A, 425, 649
- Johnson et al. (1980) Johnson, H. R., Bernat, A. P., & Krupp, B. M. 1980, ApJS, 42, 501
- Kormendy & Kennicutt (2004) Kormendy, J. & Kennicutt, Jr., R. C. 2004, ARA&A, 42, 603
- Larsen et al. (2008) Larsen, S. S., Origlia, L., Brodie, J., & Gallagher, J. S. 2008, MNRAS, 383, 263
- Larsen et al. (2006) Larsen, S. S., Origlia, L., Brodie, J. P., & Gallagher, J. S. 2006, MNRAS, 368, L10
- Lecureur et al. (2007) Lecureur, A., Hill, V., Zoccali, M., Barbuy, B., Gómez, A., Minniti, D., Ortolani, S., & Renzini, A. 2007, A&A, 465, 799
- Luck et al. (2006) Luck, R. E., Kovtyukh, V. V., & Andrievsky, S. M. 2006, AJ, 132, 902
- Maness et al. (2007) Maness, H., Martins, F., Trippe, S., Genzel, R., Graham, J. R., Sheehy, C., Salaris, M., Gillessen, S., Alexander, T., Paumard, T., Ott, T., Abuter, R., & Eisenhauer, F. 2007, ApJ, 669, 1024
- Martins et al. (2008) Martins, F., Hillier, D. J., Paumard, T., Eisenhauer, F., Ott, T., & Genzel, R. 2008, A&A, 478, 219
- Meléndez & Barbuy (1999) Meléndez, J. & Barbuy, B. 1999, ApJS, 124, 527
- Meynet & Maeder (2000) Meynet, G. & Maeder, A. 2000, A&A, 361, 101
- Morris (1993) Morris, M. 1993, ApJ, 408, 496
- Morris & Serabyn (1996) Morris, M. & Serabyn, E. 1996, ARA&A, 34, 645
- Munn et al. (2004) Munn, K. E., Dufton, P. L., Smartt, S. J., & Hambly, N. C. 2004, A&A, 419, 713
- Najarro et al. (2008) Najarro, F., Figer, D. F., Hillier, D. J., Geballe, T. R., & Kudritzki, R.-P. 2008, ApJ, in press
- Najarro et al. (2004) Najarro, F., Figer, D. F., Hillier, D. J., & Kudritzki, R. P. 2004, ApJ, 611, L105
- Origlia et al. (2003) Origlia, L., Ferraro, F. R., Bellazzini, M., & Pancino, E. 2003, ApJ, 591, 916
- Origlia et al. (1993) Origlia, L., Moorwood, A. F. M., & Oliva, E. 1993, A&A, 280, 536
- Origlia et al. (2002) Origlia, L., Rich, R. M., & Castro, S. 2002, AJ, 123, 1559
- Origlia et al. (2005) Origlia, L., Valenti, E., & Rich, R. M. 2005, MNRAS, 356, 1276
- Paumard et al. (2006) Paumard, T., Genzel, R., Martins, F., Nayakshin, S., Beloborodov, A. M., Levin, Y., Trippe, S., Eisenhauer, F., Ott, T., Gillessen, S., Abuter, R., Cuadra, J., Alexander, T., & Sternberg, A. 2006, ApJ, 643, 1011
- Ramírez et al. (2000) Ramírez, S. V., Sellgren, K., Carr, J. S., Balachandran, S. C., Blum, R., Terndrup, D. M., & Steed, A. 2000, ApJ, 537, 205
- Rich & Origlia (2005) Rich, R. M. & Origlia, L. 2005, ApJ, 634, 1293
- Rich et al. (2007) Rich, R. M., Origlia, L., & Valenti, E. 2007, ApJ, 665, L119
- Rudolph et al. (2006) Rudolph, A. L., Fich, M., Bell, G. R., Norsen, T., Simpson, J. P., Haas, M. R., & Erickson, E. F. 2006, ApJS, 162, 346
- Sakano et al. (2004) Sakano, M., Warwick, R. S., Decourchelle, A., & Predehl, P. 2004, MNRAS, 350, 129
- Serabyn et al. (1991) Serabyn, E., Lacy, J. H., & Achtermann, J. M. 1991, ApJ, 378, 557
- Simpson et al. (1995) Simpson, J. P., Colgan, S. W. J., Rubin, R. H., Erickson, E. F., & Haas, M. R. 1995, ApJ, 444, 721
- Smartt et al. (2001) Smartt, S. J., Venn, K. A., Dufton, P. L., Lennon, D. J., Rolleston, W. R. J., & Keenan, F. P. 2001, A&A, 367, 86
- van Loon et al. (2003) van Loon, J. T., Gilmore, G. F., Omont, A., Blommaert, J. A. D. L., Glass, I. S., Messineo, M., Schuller, F., Schultheis, M., Yamamura, I., & Zhao, H. S. 2003, MNRAS, 338, 857
- Yusef-Zadeh & Melia (1992) Yusef-Zadeh, F. & Melia, F. 1992, ApJ, 385, L41
- Yusef-Zadeh & Morris (1991) Yusef-Zadeh, F. & Morris, M. 1991, ApJ, 371, L59
- Zánmar Sánchez et al. (2008) Zánmar Sánchez, R., Sellwood, J. A., Weiner, B. J., & Williams, T. B. 2008, ApJ, 674, 797
- Zaritsky et al. (1994) Zaritsky, D., Kennicutt, Jr., R. C., & Huchra, J. P. 1994, ApJ, 420, 87