Accretion Properties of A Sample of Hard X-ray (keV) Selected Seyfert 1 Galaxies
Abstract
We examine the accretion properties in a sample of 42 hard (3-60keV) X-ray selected nearby broad-line AGNs. The energy range in the sample is harder than that usually used in the similar previous studies. These AGNs are mainly complied from the RXTE All Sky Survey (XSS), and complemented by the released INTEGRAL AGN catalog. The black hole masses, bolometric luminosities of AGN, and Eddington ratios are derived from their optical spectra in terms of the broad H emission line. The tight correlation between the hard X-ray (3-20keV) and bolometric/line luminosity is well identified in our sample. Also identified is a strong inverse Baldwin relationship of the H emission line. In addition, all these hard X-ray AGNs are biased toward luminous objects with high Eddington ratio (mostly between 0.01 to 0.1) and low column density (), which is most likely due to the selection effect of the surveys. The hard X-ray luminosity is consequently found to be strongly correlated with the black hole mass. We believe the sample completeness will be improved in the next few years by the ongoing Swift and INTEGRAL missions, and by the next advanced missions, such as NuSTAR, Simbol-X, and NeXT. Finally, the correlation between RFe (=optical Fe II/H) and disk temperature as assessed by leads us to suggest that the strength of the Fe II emission is mainly determined by the shape of the ionizing spectrum.
1 Introduction
It is now generally believed that the power of Active Galactic Nuclei (AGNs) is extracted through the accretion of gas onto a central supermassive black hole (SMBH). Such energy mechanism means that AGNs are characterized by their strong hard X-ray emission (keV), which is widely used as direct evidence suggesting the existence of a nuclear accretion activity (, e.g., Silverman et al. 2005; Brusa et al. 2007; Hasinger et al. 2005). The commonly accepted model is that the hard X-ray emission from AGNs is primarily produced by the inverse Compton scattering of the UV/soft X-ray photons emitted from the accretion disk (e.g, Zdziarski et al. 1995, 2000; Haardt & Maraschi 1991; Kawaguchi et al. 2001). The absorption-corrected X-ray photon spectra within the energy band 2-10keV could be best described as a cut-off powerlaw with index (e.g., Zdziarski et al. 1995; Reeves & Turner 2000; Piconcelli et al. 2005; Dadina 2008; Panessa et al. 2008). The synthesis spectra become flat beyond 10keV because of the Compton reflection caused by the ionized surface of the accretion disk (e.g., George & Fabian 1991).
Because the hard X-ray emission from central engine can penetrate the obscuration material much more easily than lower energy emission, it possesses particular importance in testing the traditional unified model (Antonucci 1993) in Seyfert 2 galaxies (e.g., Moran et al. 2002; Cardamone et al. 2007). The studies of the Chandra and XMM-Newton observatories showed that the cosmic X-ray background (CXRB) at 2-30keV might be contributed by many unknown obscured AGNs which are predicted by the CXRB models (e.g., Comastri et al. 1995; De Luca & Molendi 2004; Worsley et al. 2005; Gilli et al. 2007; Severgnini et al. 2003; Levenson et al. 2006). Taking into account of the issue of co-evolution of AGN and bulge of its host galaxy (e.g., Heckman et al. 2004; Kauffmann et al. 2003; Wang et al. 2006; Wang & Wei 2008 and references therein), the hard X-ray emission from AGNs is also an important tool in detecting and separating AGN’s contribution from circumnuclear star formation activity. The X-ray luminosities of known most X-ray luminous starforming and elliptical galaxies are not higher than (Zezas et al. 2003; Lira et al. 2002a, 2002b; O’Sullivan et al. 2001).
Heckman et al. (2005) identified a very tight correlation between the hard X-ray (3-20keV) and [O III] luminosities in a sample of hard X-ray selected AGNs when they performed a comparison between the hard X-ray selected and [O III] emission-line selected AGNs. In 2-10keV bandpass, similar correlations were identified in the Palomar optically selected AGNs by Panessa et al. (2006). On the contrary, a very weak - correlation was identified in the AGNs selected by their bright [O III] emission lines (Heckman et al. 2005). The result suggests that many AGNs might be missed in the hard X-ray survey. Moreover, Netzer et al. (2006) claimed that the / ratio depends on the X-ray luminosity.
The questions are therefore naturally raised: why is the - correlation broken in some kind of AGNs? which parameters (or what are the physical reasons that) determine the correlation? Are the hard X-ray selected AGNs particular in some parameters? Both black hole mass () and Eddington ratio () are two key parameters determining the observed properties of AGNs. In addition, with the development of the technology in hard X-ray detection, a major advance in studying AGN hard X-ray emission will be achieved in the next a few years due to the launch of new missions with enhanced hard X-ray capability (in sensitivity and imaging), such as NuSTAR, Simbol-X, and NeXT (e.g., Takahashi et al. 2008; Ferrando et al. 2003). The study on the existent surveys certainly prepares the ground for the future surveys.
In this paper, we examine the optical spectral properties of a sample of 42 hard X-ray selected broad-line AGNs, which allows us to investigate the properties of and in these hard X-ray AGNs. The sample is mainly compiled from the AGN catalog of the RXTE 3-20keV All Sky Survey (XSS, Sazonov & Revnivtsev 2004), and complemented by the AGN catalog released by the INTEGRAL all-sky hard X-ray survey (Bassani et al. 2006a and references therein). Note that the energy range used in this work is extended to the Compton reflection region, and is harder than the range (i.e., 0.5-10 keV) usually used in the similar previous studies. The paper is organized as follows. Section 2 and 3 shows the sample selection and spectroscopic observations, respectively. The data reduction is described in the next section. Section 5 presents the results and discussions. The cosmology with , , and (Bennett et al. 2003) is adopted in our calculations throughout the paper.
2 The Sample
Our sample is mainly compiled from the RXTE 3-20keV All-Sky Survey (XSS, Revnivtsev et al. 2004). Sazonov & Revnivtsev (2004, hereafter SR04) identified 95 nearby AGNs with detected in XSS. The survey covers about 90% of the sky at . The sensitivity of the survey in the energy band 3-20 keV is better than . SR04 therefore provides a nearly complete sample for bright hard X-ray selected AGNs, although the sample is still biased against sources with absorption column . The IBIS telescope (Ubertini et al. 2003) onboard the INTEGRAL observatory (Winkler et al. 2003) provides a better capability for heavily obscured objects because of its good sensitivity beyond 20 keV. After about three years INTEGRAL observation, their all-sky survey project allows Bassani et al. (2006a) to identify 62 AGNs in the energy bandpass 20-100keV above a flux of by analyzing 11,300 INTEGRAL points (see also in Bassani et al. 2006b; Bird et al. 2006; Beckmann et al. 2006).
Both catalogs are then combined to enlarge our sample content, and to attempt to alleviate the bias against the obscuration. We further limit the objects to the broad-line AGNs according to the identification provided by previous optical spectroscopy. The BAT instrument (Barthelmy et al. 2005) onboard the Swift satellite (Gehrels et al. 2004) provides an all-sky hard X-ray survey with a sensitivity down to a few in higher energy band 14-195 keV. Markwardt et al. (2005) identified 44 previous known AGNs in the Swift survey. However, considering the spectroscopic observation condition (see below), only three objects are not listed in our sample. It is worthy noting that the ongoing Swift/BAT and INTEGRAL survey could provide a larger sample of hard X-ray selected AGNs at the end of our program (i.e., Krivonos et al. 2006; Sazonov et al. 2007; Tueller et al. 2008). We will perform a subsequent spectroscopic study on these AGNs in the next work.
Figure 1 shows the column density () distribution for our sample. is complied from SR04, and from Sazonov et al. (2007) for the objects detected by INTEGRAL only. Briefly, these authors determined by fitting the available spectra from different X-ray instruments by an absorbed powerlaw. Values of less than were ignored in the fitting of SR04 and Sazonov et al. (2007). As shown in the figure, the current sample is still strongly biased against AGNs with large column density.
3 Spectroscopic Observations
Both because of the constraint of the observatory site and because of the instrumental capability, the spectroscopic observations are only carried out for the bright (mag) objects located in the northern sky with declination . In total, there are 53 objects fulfilling the selection criterion. Six of these objects are not observed because of the poor weather conditions. Among the remaining objects, five objects (i.e., XSSJ 02151-0033, XSS J11570+5514, XSS J22363-1230, NGC 788, IGR J21247+5058) are excluded in subsequent spectral modeling because of the weakness or absence of broad H and/or H emission lines111Our spectroscopic observations show that three objects, i.e., XSS J02151-0033, XSS J11570+5514, and XSS J22363-1230, could be further classified as Seyfert 1.9-like galaxies without broad components of Balmer emission lines except a broad H emission. In addition, the continuum is dominated by the contribution from starlight of host galaxy rather than AGN in XSS J02151-0033 and XSS J11570+5514, which precludes the measurements of the Fe II complex. We include NGC 788 in our observation program because multi-classification is shown in the NED (see also in Beckmann et al. 2006). Our spectrum indicates a Seyfert 2 nucleus in the object. In fact, the object is classified as a Seyfert 2 galaxy with polarized broad emission lines in the catalogue of quasars and active nuclei (Veron-Cetty & Veron 2006). Our spectrum taken in Dec 20, 2006 shows that the spectrum of IGR J21247+5058 is dominated by a typical late type star, which is consistent with Masetti et al. (2004). By identifying the broad emission bump around 6700Å as H, these author argued that the background AGN is aligned with a F- or early G-type star by chance.
The total 42 high (or intermediate high) quality optical spectra were obtained by using the National Astronomical Observatories, Chinese Academy of Science (NAOC), 2.16m telescope in Xinglong observatory during several observing runs carried out from November 2005 to Mar 2008. The spectra were taken by the OMR spectrograph equipped with a back-illuminated SPEC10 1340400 CCD as detector. A grating of 300 and a slit of 2.0˝ oriented in south-north direction were used in our observations. This setup results in a final spectral resolution as measured from both comparison spectra and night sky emission lines. The blazed wavelength was fixed to be 6000Å, which provides a wavelength coverage of 3800-8300Å in observer frame. This attempt covers both H and H region in most spectra because of their small redshifts. Each object was observed successively twice. The two exposures were combined prior to extraction to enhance the S/N ratio and eliminate the contamination of cosmic-rays easily. The exposure time for each frame is generally between 900 and 3600 seconds depending on the brightness of the object. The wavelength calibration associated with each object was carried out by the helium-neon-argon comparison arcs taken between the two successive frames. The arcs were obtained at the position being nearly identical to that of the specified object. Two or three Kitt Peak National Observatory (KPNO) standard stars (Massey et al. 1988) were observed per night for both flux calibration and removal of the atmospheric absorption features. All the objects were observed as close to meridian as possible. Table 1 shows the log of observations of the 42 objects listed in our sample.
4 Data Reduction and Emission Line Measurements
The standard procedures using the IRAF package 222IRAF is distributed by the National Optical Astronomical Observatories, which is operated by the Association of Universities for Research in Astronomy, Inc., under cooperative agreement with the National Science Foundation. are adopted by us to reduce the unprocessed frames. The CCD reductions include bias subtraction, flat-field correction, and cosmic-rays removal before the extraction of signal. One-dimensional sky-subtracted spectra are then wavelength and flux calibrated. The uncertainties of the wavelength and flux calibrations are no more than 1Å and 20%, respectively. The Galactic extinctions are corrected by the color excess, the parameter taken from the NASA/IAPC Extragalactic Database (NED), assuming an extinction law of Milk Way (Cardelli et al. 1989). The spectra are then transformed to the rest frame, along with a -correction, according to the narrow peak of H.
4.1 Fe II subtractions
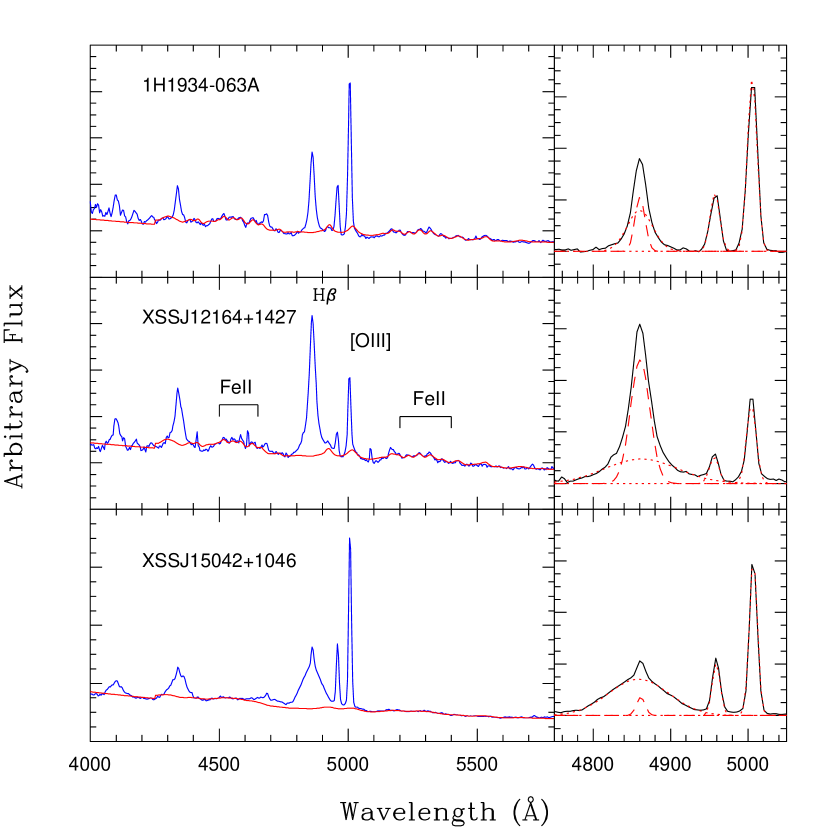
In order to determine the strength of the optical Fe II complex and to reliably profile the emission lines in H region, the Fe II complex should be modeled and then removed from each spectrum at first. We simply adopt the empirical template of the Fe II complex introduced in Boroson & Green (1992, hereafter BG92). For each object, the template is first broadened to the FWHM of the H broad component by convolving with a Gaussian profile (BG92). The broadened template and a broken powerlaw are combined to model the continuum by a minimization for individual object. The minimization is performed over the rest frame wavelength range from 4300 to 7000Å, except for the regions around the strong emission lines (i.e., H+[N II], [S II], H, H, [O III], He II). The fittings are illustrated in the left column of Figure 2 for three typical cases. The flux of the Fe II complex is integrated between the rest wavelength 4434 and 4686Å. The Fe II complex is not measured in XSS J11067+7234 because its continuum is dominated by the starlight from the host galaxy.
4.2 Emission lines measurements
After removing the Fe II blends and continuum, the isolated AGN emission lines at H region are modeled by the SPECFIT task (Kriss 1994) in IRAF package. In each object, each of the [O III]4959,5007 doublet is modeled by a single Gaussian component. The flux ratio of the doublet is fixed to be 3 (e.g., Dimitrijevic et al. 2007). In principle, each H profile is modeled by a set of two Gaussian components: a narrow and a broad Gaussian component (denoted as H and H, respectively). The profile modelings are illustrated for the three cases in the right column in Figure 2. The deblendings of the H emission line are, however, difficult in 15 objects because no obvious transition between the narrow and broad components is observed. In these 15 cases, the reported H measurements include both components, and the contribution of H is usually expected to be less than 3% for typical broad-line AGNs as suggested by BG92.
The described modeling works very well in most objects, except in three ones. In XSS J22539-1735, a very broad H component () is required to properly reproduce the observed profile. Such component has been reported in H and highly ionized emission lines in previous studies (e.g., Sulentic et al. 2000b; Wang et al. 2005; Veron-Cetty et al. 2007; Marziani et al. 2003; Mullaney & Ward 2008; Hu et al. 2008). A double peaked and a boxy H profile is observed in XSS J18408+7947 and XSS J23073+0447, respectively. In all of the three cases, each H line is modeled by three Gaussian components, i.e., a narrow and two broad components. The modeled narrow component is then subtracted from the observed spectrum to derive a residual profile which is then used to measure FWHM and integrated flux.
5 Results and Discussion
Table 2 lists the following items measured from the spectra. Column (2) and (3) lists the equivalent widths (EWs) of H and H, respectively. All the EWs refer to the continuum level determined from the continuum fitting at the position of wavelength 4861. The line ratio RFe (=Fe II/H) is shown in column (4). Column (5) lists the luminosity of the H broad component, and Column (6) the FWHM of the broad H in units of . All quoted widths are not corrected for the intrinsic resolution, since the widths are much broader than the resolution. Column (7) shows the luminosity of the [O III] emission line. Both [O III] and H luminosities are calculated from the cosmology-corrected luminosity distance 333Because the objects listed in our sample are generally very nearby, the radial velocity is corrected by a redshift of 0.017877 to the reference frame defined by the 3K Microwave Background Radiation. given by NED. The next two columns show the absorption-corrected hard X-ray luminosities in the bandpass 3-20 keV (XSS) and in 17-60 keV (INTEGRAL).
Six out of the 42 AGNs are detected by INTEGRAL only. In order to estimate their X-ray luminosities in the bandpass 3-20 keV from the luminosities in 17-60 keV, a transformation is derived in terms of the 18 objects detected by both surveys. The left panel of Figure 3 shows the relationship between the two sets of luminosity. A unweighted fitting yields a relationship with a standard deviation of 0.25. After transform the luminosities in the bandpass 17-60 keV to 3-20 keV for the six objects, the strong correlation between the [O III] and 3-20 keV luminosity is shown in the right panel of Figure 3 for the total 42 objects. The correlation is highly consistent with that derived in Heckman et al. (2005), which firmly demonstrates the accuracy of our observations and calibrations.
5.1 Hard X-ray vs. bolometric luminosity
The detection of hard X-ray emission from a nucleus is regarded as strong evidence of accretion activity occurring around the central SMBH. The correlations between X-ray luminosity and luminosities of optical emission lines (e.g., H, H, [O III]) have been extensively established in the previous studies (e.g., Elvis et al. 1984; Ward et al. 1988; Mulchaey et al. 1994; Heckman et al. 2005; Panessa et al. 2006). However, the correlations seem to depend on sample selection (Heckman et al. 2005) and on X-ray luminosity itself (Netzer et al. 2006). In this paper, we estimate the luminosity of AGN at rest wavelength 5100Å from the H component according to the calibration given by Greene & Ho (2005):
| (1) |
The bolometric luminosity is then derived by adopting the usually used bolometric correction (e.g., Kaspi et al. 2000). The significant correlation between and is shown in the left panel in Figure 4. A unweighted least square fitting gives a relationship:
| (2) |
or for simplification. The correlation strongly indicates a close link between the hard X-ray emission and ionizing radiation emitted from the accretion disk. Note that the bolometric luminosity spans four orders of magnitude, down to , which is close to the formal definition of low luminous AGNs (i.e., , Ho 2003). These faint galaxies generally radiate at low state with Eddington ratio marginally exceeds 0.01.
5.2 Black Hole Mass and Eddington Ratio
It is now generally believed that black hole mass () and specific accretion rate () are two basic parameters determining the properties of AGNs. The role of in driving the Eigenvector I (EI) space 444 The EI space is one of the key properties of AGN phenomena. It was first established by BG92 who analyzed the optical spectra of 87 bright PG quasars. In addition to the anti-correlation between the intensity of Fe II and [O III], the EI space has been subsequently extended to ultraviolet and soft X-ray bands (i.e., FWHM(C IV) and , e.g., Wang et al. 1996; Xu et al. 2003; Grupe 2004; Sulentic et al. 2007; see Sulentic et al. 2000a for a review). has been extensively investigated in numerous previous studies (e.g., Boroson 2002; Sulentic et al. 2006; Xu et al. 2003; Grupe 2004; Zamanov & Marziani 2002; Marziani et al. 2001), because of the great progress in the calibration of the relationship (e.g, Kaspi et al. 2000, 2005, 2007; McLure & Jarvis 2004; Vestergaard & Peterson 2006; Peterson et al. 2004; Bentz et al. 2006) due to the recent great advance in the reverberation mapping (e.g., Kapsi et al. 2000; Peterson & Bentz 2006). We refer the reads to McGill et al. (2008, and references therein) for a summary of the existing formula used to calculate basing upon “single-epoch” observation. In this work, the black hole mass is estimated by the width and luminosity of H in individual object, according to the scaling law obtained by Greene & Ho (2005).
| (3) |
For each object, the estimated and is listed in Column (10) and (11) in Table 2, respectively. The bolometric luminosity is estimated from the H component as described above.
The calculations of both and allow us to find that the current sample is strongly biased against sub-luminous AGNs usually with low . In fact, the left panel of Figure 4 shows the lack of AGNs with . Figure 5 displays the distributions of the (left panel) and (middle panel) for the total 42 AGNs. As shown in the middle panel, the is sampled within a wide range ( dex) from to with a peak at . In contrast, the left panel shows that distributes in a relatively narrow range as compared with the previous studies. The total range of our spans from 0.01 to 1. In particular, about % objects listed in the sample have between 0.01 and 0.1. However, the of bright local AGNs usually spans at least three orders of magnitude from 1 to 0.001 (e.g., Woo & Urry 2002; Boroson 2002). Basing upon the 2-10keV X-ray luminosity, Panessa et al. (2006) indicated that the of the Palomar optically selected AGNs ranges from to 0.1. As an additional test, the right panel of Figure 4 shows the vs. plot. as a function of is over-plotted as dashed lines for three different (i.e., 1, 0.1, and 0.01). As shown in the plot, a majority of our objects are located below the line with and above the line with .
In summary, the hard X-ray selected AGNs listed in our sample are luminous AGNs with a wide range of but a nearly constant accretion activity (i.e., ), which is likely due to the selection effect of the survey that is biased toward X-ray luminous objects. In active (or luminous) AGN, the optical/UV ionizing radiation is believed to be emitted from a standard geometric thin disk (e.g., Shakura & Sunyaev 1973). The low energy photon is comptonized by a hot corona to produce the hard X-ray emission below 10keV (Haardt & Maraschi 1991). A Compton recoil of the soft photon is required to occur on the ionized surface of the accretion disk to produce the emission spectrum beyond 10keV. The main observation feature of the reflection is a bump peaked at about 30keV (e.g., George & Fabian 1991; Zycki et al. 1994; Ross & Fabian 2002, 2005).
The bias towards active AGNs could be possibly caused by the fact that either intensive Compton reflection takes place only in AGNs at high state with large or the surveys are biased against the Compton-thick objects. In the first case, the theory of the Compton reflection predicts that the X-ray emission contributed by the reflection depends primarily on the X-ray ionizing parameter, and secondarily on the UV radiation produced by the dissipation inside the accretion disk. In the second case, our analysis implies a possible connection between the less X-ray absorption and high in broad-line AGNs. In fact, we selected the objects with regardless of their X-ray spectral properties. Figure 1 shows the lack of objects with large column density in the sample. We believe that the sample completeness would be improved by including the ongoing Swift/BAT survey with large effective collecting area and harder energy bandpass (14-195 keV) in the future studies.
Figure 4 shows that the hard X-ray luminosity is strongly correlated with the in our sample. In fact, the correlation is naturally expected given the tight vs. correlation and nearly constant . The vs. correlation provides us a potential estimate of black hole mass for luminous AGNs within . The following relationship is obtained by us through a least square fitting: . Our results conflicts with Panessa et al. (2006) and Pellegrini (2005) who did not find the correlation, but is in agreement with Kiuchi et al. (2006). Panessa et al. (2006) investigated a sample of 47 nearby Seyfert galaxies selected from the Palomar spectroscopy (Ho et al. 1997). The luminosity obtained by different X-ray instruments is down to . The studies in Pellegrini (2005) are based on the Chandra observations down to a luminosity . Kiuchi et al. (2006) used the broad-line AGN sample detected by the ASCA Large Sky Survey (ALSS) and ASCA Medium Sensitivity Survey in the northern sky (AMSSn) with a detection limit of a few in 2-10keV bandpass. As discussed above, it is worthy noting that the correlation most likely does not reflect the physics but a selection effect of the surveys.
5.3 Fe II ratio vs. disk temperature relation
As a key parameter in the EI space, the Fe II ratio (RFe) is defined as the ratio of the optical Fe II complex to H. Although the total Fe II emission increases by fourfold with reasonable ionization parameter in AGN (Korista et al. 1997), traditional photoionization models can not explain the strong Fe II emission in optical and UV bands (e.g, Netzer & Wills 1983; Joly 1987; Collin-Souffrin et al. 1988). At present, the problem is only slightly alleviated by the major improvements in the atomic data and by the improved treatment of the line excitation process (Sigut & Pradhan 2003; Baldwin et al. 2004). We refer the reads to Collin & Joly (2000) for a summary of the mechanisms that can enhance the Fe II emission. BG92 put forward a picture in which the RFe is determined by the vertical structure of the accretion disk. The vertical structure is governed by . A large leads to a large X-ray heated volume that could generate large Fe II emission. Sulentic et al. (2000b) developed a semi-analysis model in which the RFe depends on as . Although the RFe is found to generally increase with in optical bright quasars, Netzer et al. (2004) found that a number of high-z quasars deviate the trend, i.e., with very small RFe but large (see also in Netzer & Trakhtenbrot 2007). Using the large database provided by the Sloan Digital Sky Survey, Netzer & Trakhtenbrot (2007) recently suggested that the enhanced RFe is mainly caused by increased metal abundance.
In the current sample, the distribution of RFe is shown in the right panel of Figure 5. RFe uniformly ranges from to 1. On the contrary, distributes in a quite narrow range as describe above. In fact, no correlation between RFe and is found in our sample (see the upper panel in Figure 6), which motivates us to suspect that RFe does not depend on only. RFe is plotted against the characteristic disk temperature in the bottom panel in Figure 6. The temperature scales with and as predicted by the standard geometric thin disk model (e.g., Shakura & Sunyaev 1973). The exact formula of disk temperature depends on various accretion disk models. For a rapidly rotating Kerr hole, with a spin parameter and efficiency of 0.31, we have . The diagram indicates an obvious correlation between the two parameters. A spearman rank-order test calculated by survival analysis yields a formal correlation coefficient (, where is the probability of null correlation). The correlation is not highly significant probably because of the small sample size. The estimated temperature spans about one order of magnitude (), corresponding to a factor of . The correlation then suggests a trend of more intensive Fe II emission for higher disk temperature. A marginal dependence of the continuum shape of QSOs on was recently identified by Bonning et al. (2007) who compared the observations of SDSS with the NLTE models of accretion disk. The current result means that the strength of the Fe II emission is likely controlled by the spectral shape of the ionizing continuum.
5.4 Equivalent width of H vs.
The physical reason of the absence of the Baldwin relationship (Baldwin 1977) for low ionization emission lines is still an open question. In fact, a weak inverse Baldwin relationship for H has been demonstrated by recent studies basing upon large AGN samples (e.g., Croom et al. 2002; Greene & Ho 2005). We identify a tight, positive correlation between and EW(H) in our hard X-ray selected AGNs (i.e., an inverse Baldwin relationship). Figure 7 presents the correlation with correlation coefficient () estimated by the spearman rank-order analysis. EW(H) roughly scales with hard X-ray luminosity as . Wilkes et al. (1999) identified a marginal Baldwin effect in H line. Noted that they examined only the luminous local quasars with .
Although many models are developed to explain the Baldwin effect for high ionization emission lines (e.g., C IV, Wandel 1999; Korista et al. 1998; Shields et al. 1995; Wills et al. 1999; Baskin & Loar 2004; Bachev et al. 2004), these models can not explain the difference between C IV and H. Croom et al. (2002) suggested that the inverse Baldwin relationship could be explained if the longer wavelength continuum contains emission from other components (e.g., thermal dust emission, non-thermal radio emission, starlight). We estimate the possible contribution of the unknown sources as follows. We start from the relationship , and re-write , where and is the AGN luminosity and luminosity of other unknown sources at the H wavelength, respectively. The X-ray luminosity could be replaced by given Eq. (2) and the bolometric correction factor of 9. Replacing as given Eq.(1) finally yields a relationship . Considering the typical case with , about 40% of the observed continuum at H wavelength is estimated to be contributed by the unknown sources.
6 Conclusion
The properties ( and ) of accretion onto SMBH are examined in a sample of 42 hard X-ray selected (3-60keV) broad-line AGNs in terms of their optical spectra taken by us. The energy range is harder than that usually used in the similar previous studies. These AGNs are mainly compiled from the RXTE All Sky Survey (Sazonov & Revnivtsev 2004), and are complemented by the released INTEGRAL AGN sample (Bassani et al. 2006a). The statistical analysis allows us to draw the following conclusions:
-
1.
We confirm the tight correlation between the hard X-ray and optical emission line luminosities (and bolometric luminosity) in our sample, which suggests a close link between the hard X-ray emission reflected by the ionized surface of the accretion disk and UV/optical radiation. Using the hard X-ray luminosity, a strong inverse Baldwin relationship of the H emission line is identified in the sample.
-
2.
The hard X-ray selected broad-line AGNs listed in the sample are found to be strongly biased toward luminous AGNs with high and low column density. Since is constant (mostly between 0.01 and 0.1) in a first order approximation, the hard X-ray luminosity is strongly correlated with the black hole mass in our sample, which is most likely due to the selection effect of the surveys.
-
3.
Although the RFe parameter is independent on in our sample, it is found to be correlated with the accretion disk temperature as assessed by . This result implies that the strength of the Fe II emission is determined by the shape of the ionizing spectrum.
Finally, it should be mentioned that a new era in AGN hard X-ray study will be opened in next a few years due to the launch of new missions with enhanced hard X-ray detection capability in not only sensitivity, but also imaging, such as Simbol-X, NeXT and NuSTAR. These missions will provide larger, and more complete samples to study the present open issues.
References
- Antonucci (1993) Antonucci, R., 1993, ARA&A, 31, 473
- Bachev et al. (2004) Bachev, R., et al., 2004, ApJ, 617, 171
- Baldwin (1977) Baldwin, J. A., 1977, ApJ, 214, 679
- Baldwin et al. (2004) Baldwin, J. A., Ferland, G. J., Korista, K. T., et al., 2004, ApJ, 615, 610
- Barthelmy et al. (2005) Barthelmy, S. D., Barbier, L. M., Cummings, J. R., et al., 2005, SSRV, 120, 143
- Baskin & Loar (2004) Baskin, A., & Loar, A., 2004, MNRAS, 350, L31
- (7) Bassani, L., Malizia, A., Stephen, J. B., et al., 2006b, arXiv: astro-ph/10455
- (8) Bassani, L., Molina, M., Malizia, A., et al., 2006a, ApJ, 636, L65
- Beckmann et al. (2006) Beckmann, V., Gehrels, N., Shrader, C. R., et al., 2006, ApJ, 638, 642
- Bennett et al. (2003) Bennett, C. L., Halpern, M., Hinshaw, G., et al., 2003, ApJS, 148, 1
- Bentz et al. (2006) Bentz, M. C., Peterson, B. M., Pogge, R. W., et al., 2006, ApJ, 644, 133
- Bird et al. (2006) Bird, A. J., Barlow, E. J., Bassani, L., et al., 2006, ApJ, 636, 765
- Bonning et al. (2007) Bonning, E. W., Cheng, L., Shields, G. A., et al., 2007, ApJ, 659, 211
- Boroson (2002) Boroson, T. A., 2002, ApJ, 565, 78
- Boroson & Green (1992) Boroson, T. A., & Green, R. F., 1992, ApJS, 80, 109 (BG92)
- Brusa et al. (2007) Brusa, M., Zamorani, G., Comastri, A., et al., 2007, ApJS, 172, 353
- Cardamone et al. (2007) Cardamone, C. N., Moran, E. C., & Kay, L. E., 2007, AJ, 134, 1264
- Cardelli et al. (1989) Cardelli, J. A., Clayton, G. C., & Mathis, J. S., 1989, ApJ, 345, 245
- Comastri et al. (1995) Comastri, A., Setti, G., Zamorani, G., et al., 1995, A&A, 296, 1
- Collin-Souffrin et al. (1988) Collin, S., Hameury, J. M., & Joly, M., A&A, 205, 19
- Collin & Joly (2000) Collin, S., & Joly, M., 2000, NewAR, 44, 531
- Croom et al. (2002) Croom, S. M., Smith, R. J., Boly, B. J., et al., 2001, MNRAS, 322, L29
- Dadina (2008) Dadina, M., 2008, astro-ph/arXiv0801.4338, accetped by A&A
- De Luca & Molendi (2004) De Luca, A., & Molendi, S., 2004, A&A, 419, 837
- Dimitrijevic et al. (2007) Dimitrijevic. M. S., Popovic, L. C., Kovacevic, L., et al., 2007, MNRAS, 374, 1181
- Elvis et al. (1984) Elvis, M., Soltan, A., & Keel, W. C., 1984, ApJ, 283, 479
- Ferrando et al. (2004) Ferrando, P., Arnaud, M., Cordier, B., et al., 2003, arXiv:astro-ph/0309424
- Gehrels e tal. (2004) Gehrels, N., Chincarini, G., Giommi, P., et al., 2004, ApJ, 611, 1005
- George & Fabian (1991) George, I. M., & Fabian, A. C., 1991, MNRAS, 249, 352
- Gilli et al. (2007) Gilli, R., Comastri, A., & Hasinger, G., 2007, A&A, 463, 79
- Greene & Ho (2005) Greene, J. E., & Ho, L. C., 2005, ApJ, 630, 122
- Grupe (2004) Grupe, D., 2004, AJ, 127, 1799
- Haardt & Maraschi (1991) Haardt, F., & Maraschi, L., 1991, ApJ, 1991, 380, L51
- Hasinger et al. (2005) Hasinger, G., Miyaji, T., & Schmidt, M., 2005, A&A, 441, 417
- Heckman et al. (2004) Heckman, T. M., Kauffmann, G., Brinchmann, J., et al., 2005, ApJ, 613, 109
- Heckman et al. (2005) Heckman, T. M., Ptak, A., Hornschemeier, A., et al., 2005, ApJ, 634, 161
- Ho (2005) Ho, L. C., 2005, Active Galactic Nuclei: From central Engine to Host Galaxy, ASPC, Ser, 290, 379
- Ho et al. (1997) Ho, L. C., Filippenko, A. V., & Sargent, W. L., 1997, ApJS, 112, 315
- Hu et al. (2008) Hu, C., Wang, J. M., Ho, L. C., et al., 2008, astro-ph/arXiv:0807.2060, accepted by ApJL
- Joly (1987) Joly, M., 1987, A&A, 184, 33
- Kaspi et al. (2000) Kaspi, S., Smith, P. S., Netzer, H., et al., 2000, ApJ, 533, 631
- Kaspi et al. (2005) Kaspi, S., Smith, P. S., Netzer, H., et al., 2005, ApJ, 629, 61
- Kaspi et al. (2007) Kaspi, S., Brandt, W. N., Maoz, D., et al., 2007, ApJ, 659, 997
- Kauffmann et al. (2003) Kauffmann, G., Heckman, T. M., Tremonti, C., et al., 2003, MNRAS, 346, 1055
- Kawaguchi et al. (2001) Kawaguchi, T., Shimura, T. & Mineshige, S., 2001, ApJ, 546, 966
- Kiuchi et al. (2006) Kiuchi, G., Ohta, K., Akiyama, M., et al., 2006, ApJ, 647, 892
- Korista et al. (1998) Korista, K., Baldwin, J., & Ferland, G., 1998, ApJ, 507, 24
- Korista et al. (1997) Korista, K., Baldwin, J., Ferland, G., et al., 1997, ApJS, 108, 401
- Kriss (1994) Kriss, G., 1994, Adass, 3, 437
- Krivonos et al. (2007) Krivonos, R., Revnivtsev, M., Lutovinov, A., et al., 2007, A&A, 475, 775
- Levenson et al. (2006) Levenson, N. A., Heckman, T. M., Krolik, J. H., et al., 2006, 648, 111
- (52) Lira, P., Ward, M. J., Zezas, A., et al., 2002, MNRAS, 333, 709
- (53) Lira, P.; Ward, M. J., Zezas, A., et al., 2002, MNRAS, 330, 259
- Markwardt et al., (2005) Markwardt, C. B., Tuller, J., Skinner, G. K., et al., 2005, ApJ, 633, L77
- Marziani et al. (2003) Marziani, P., Sulentic, J. W., Zamanov, R., et al., 2003, MmsAI, 74, 490
- Marziani et al. (2001) Marziani, P., Sulentic, J. W., Zwitter, T., et al., 2001, ApJ, 558, 533
- Masetti et al. (2004) Masetti, N., Palazzi, E., Bassani, L., et al., 2004, A&A, 426, L41
- Massey et al. (1988) Massey, P., Strobel, K., Barnes, J. V., et al., 1988, ApJ, 328, 315
- McGill et al. (2008) McGill, K. L., Woo, J., Treu, T., et al., 2008, ApJ, 673, 703
- McLure & Jarvis (2004) McLure, R. J., & Jarvis, M. J., 2004, MNRAS, 353, L45
- Moran et al. (2002) Moran, E. C., Filippenko, A. V., & Chornock, R., 2002, ApJ, 579, L71
- Mulchaey et al. (1994) Mulchaey, J. S., Koratkar, A., Ward, M. J., et al., 1994, ApJ, 436, 586
- Mullaney & Ward (2008) Mullaney, J. R., & Ward, M. J., 2008, MNRAS, 385, 53
- Netzer et al. (2006) Netzer, H., Mainieri, V., Rosati, P., et al., 2006, A&A, 453, 525
- Netzer et al. (2004) Netzer, H., Shemmer, O., Maiolino, R., et al., 2004, ApJ, 614, 558
- Netzer & Trakhtenbrot (2007) Netzer, H., & Trakhtenbrot, B., 2007, ApJ, 654, 754
- Netzer & Wills (1983) Netzer, H., & Wills, B. J., 1983, ApJ, 275, 445
- O’Sullivan et al. (2001) O’Sullivan, E., Forbes, D. A., & Ponman, T. J., 2001, MNRAS, 328, 461
- Panessa et al. (2006) Panessa, F., Bassani, L., Cappi, M., et al., 2006, A&A, 455, 173
- Panessa et al. (2008) Panessa, F., Bassani, L., De Rosa, A., et al., 2008, A&A, 483, 151
- Piconcelli et al. (2005) Piconcelli, E., Jimenez-Bailon, E., Guainazzi, M., et al., 2005, A&A, 423, 15
- Pellegrini (2005) Pellegrini, S., 2005, ApJ, 624, 155
- Peterson et al. (2004) Peterson, B. M., Ferrarese, L., Gilbert, K. M., et al., 2004, ApJ, 613, 682
- Peterson & Bentz (2006) Peterson, B. M., & Bentz, M. C., 2006, NewAR, 50, 796
- Reeves & Turner (2000) Reeves, J. N., & Turner, M. J. L., 2000, MNRAS, 316, 234
- Revnivtsev et al. (2004) Revnivtsev, M., Sazonov, S., Jahoda, K., et al., 2004, A&A, 418, 927
- Ross & Fabian (2002) Ross, R. R., & Fabian, A. C., 2002, MNRAS, 336, 315
- Ross & Fabian (2005) Ross, R. R., & Fabian, A. C., 2005, MNRAS, 358, 211
- Shakura & Sunyave (1973) Shakura, N. I., & Sunyaev, R. A., 1973, A&A, 24 ,337
- Sazonov & Revnivtsev (2004) Sazonov, S. Y., & Revnivtsev, M. G., 2004, A&A, 423, 469
- Sazonov et al. (2007) Sazonov, S., Revnivtsev, M., Krivonos, R., et al., 2007, A&A, 462, 57
- Severgnini et al. (2003) Severgnini, P., Caccianiga, A., Braito, V., et al., 2003, A&A, 406, 483
- Shields et al. (1995) Shields, J. C., Ferland, G. J., & Peterson, B. M., 1995, ApJ, 411, 507
- Sigut & Pradhan (2003) Sigut, T. A. A., & Pradhan, A. K., 2003, ApJS, 145, 15
- Silverman et al. (2005) Silverman, J. D., Green, P. J., Barkhouse, W. A., et al., 2005, ApJ, 618, 123
- Sulentic et al. (2007) Sulentic, J. W., Bachev, R., Marziani, P., et al., 2007, ApJ, 666, 757
- (87) Sulentic, J. W., Marziani, P., & Dultzin-Hacyan, D., 2000a, ARA&A, 38, 521
- (88) Sulentic, J. W., Marziani, P., & Zwitter, T., et al., 2000b, ApJ, 545, L15
- Sulentic et al. (2006) Sulentic, J. W., Repetto, P., Stirpe, G. M., et al., 2006, A&A, 456, 929
- Takahashi et al. (2008) Takahashi, T., Kelley, R., Mitsuda, K., et al., 2008, astro-ph/arXiv:0807.2007
- Tuller et al. (2008) Tueller, J., Mushotzky, R. F., Barthelmy, S., et al., 2008, ApJ, 681, 113
- Ubertini et al. (2003) Ubertini, P., Lebrun, F., Di Cocco, G., et al., 2003, A&A, 411, L131
- Veron-Cetty & Veron (2006) Veron-Cetty, M.-P., & Veron, P., 2006, A&A, 455, 773
- Veron-Cetty et al. (2007) Veron-Cetty, M.-P., Veron, P., Joly, M., et al., 2007, A&A, 475, 487
- Vestergaard & Peterson (2006) Vestergaard, M., & Peterson, B. M., 2006, ApJ, 641, 689
- Wandel (1999) Wandel, A., 1999, ApJ, 527, 649
- Wang et al. (2006) Wang, J., Wei, J. Y., & He, X. T., 2005, NewA, 10, 353
- Wang et al. (2006) Wang, J., Wei, J. Y., & He, X. T., 2006, ApJ, 638, 106
- Wang & Wei (2008) Wang, J., & Wei, J. Y., 2008, ApJ, 679, 86
- Wang et al. (1996) Wang, T., Brinkmann, W., & Bergeron, J., 1996, A&A, 309, 81
- Ward et al. (1988) Ward, M. J., Done, C., Fabian, A. C., et al., 1988, ApJ, 324, 767
- Wilkes et al. (1999) Wilkes, B. J., Kuraszkiewicz, J., Green, P. J., et al., 1999, ApJ, 513, 76
- Wills et al. (1999) Wills, B. J., Bortherton, M. S., Fang, D., et al., 1993, ApJ, 415, 563
- Winkler et al. (2003) Winkler, C., Courvoisier, T. J. -L., Di Cocco, G., et al., 2003, A&A, 411, L1
- Worsley et al. (2005) Worsley, M. A., Fabian, A. C., Bauer, F. E., et al., 2005, MNRAS, 357, 1281
- Xu et al. (2003) Xu, D. W., Komossa, S., Wei, J. Y., et al., 2003, ApJ, 590, 73
- Zamanov & Marziani (2002) Zamanov, R., & Marziani, P., 2002, ApJ, 571, L77
- Zdziarski et al. (1995) Zdziarski, A. A., Johnson, W. N., & Done, C., et al., 1995, ApJ, 438, L63
- Zdziarski et al. (2000) Zdziarski, A. A., Poutanen, J., & Johnson, W. N., 2000, ApJ, 542, 703
- Zezas et al. (2003) Zezas, A., Hernquist, L., Fabbiano, G., et al., 2003, ApJ, 699, L73
- Zycki et al. (1994) Zycki, P. T., Krolik, J. H., Zdziarski, A. A., et al., 1994, ApJ, 437, 597


| Name | Other name | R.A. | Decl. | z | Date | Exposure (s) | AGN Type | |
|---|---|---|---|---|---|---|---|---|
| (1) | (2) | (3) | (4) | (5) | (6) | (7) | (8) | (9) |
| XSS J00368+4557 | CGCG 535-012 | 00 36 21.0 | 45 39 54 | 0.048 | 2400 | 2006 Aug 15 | 15.45 | S1 |
| QSO 0241+622 | 02 44 57.7 | 62 28 07 | 0.044 | 3600 | 2006 Dec 17 | 16.1 | S1 | |
| 3C 111 | 04 18 21.3 | 38 01 36 | 0.0485 | 3600 | 2007 Nov 03 | 18.0 | S1 | |
| XSS J04331+0520 | 3C 120 | 04 33 11.1 | 05 21 16 | 0.033 | 1800 | 2007 Feb 16 | 14.2 | BLRG |
| XSS J05103+1640 | IRAS 05078+1626 | 05 10 45.5 | 16 29 56 | 0.018 | 1800 | 2007 Feb 16 | 15.6 | S1 |
| XSS J05162-0008 | AKN 120 | 05 16 11.4 | -00 08 59 | 0.033 | 1200 | 2006 Nov 18 | 14.1 | S1 |
| XSS J05552+4617 | MCG +8-11-11 | 05 54 53.6 | 46 26 22 | 0.02 | 1800 | 2007 Feb 17 | 15.0 | S1 |
| Mark 6 | 06 52 12.2 | 74 25 37 | 0.01881 | 3600 | 2007 Feb 16 | 15.0 | S1.5 | |
| XSS J07434+4945 | MRK 79 | 07 42 32.8 | 49 48 35 | 0.022 | 1800 | 2005 Nov 29 | 14.9 | S1 |
| XSS J08117+7600 | PG 0804+761 | 08 10 58.6 | 76 02 42 | 0.1 | 2400 | 2007 Nov 16 | 15.15 | S1 |
| XSS J09204+1608 | MRK 704 | 09 18 26.0 | 16 18 19 | 0.029 | 1800 | 2006 Nov 17 | 15.38 | S1 |
| XSS J09261+5204 | MRK 110 | 09 25 12.9 | 52 17 11 | 0.036 | 1800 | 2005 Nov 30 | 15.6 | NLS1 |
| XSS J10231+1950 | NGC 3227 | 10 23 30.6 | 19 51 54 | 0.0038 | 1800 | 2006 Jan 31 | 11.1 | S1 |
| XSS J11067+7234 | NGC 3516 | 11 06 47.5 | 72 34 07 | 0.008836 | 900 | 2006 Dec 18 | 12.5 | S1 |
| XSS J11417+5910 | SBS 1136+594 | 11 39 08.9 | 59 11 55 | 0.06 | 2400 | 2007 Jan 26 | 15.5 | S1 |
| XSS J12032+4424 | NGC 4051 | 12 03 09.6 | 44 31 53 | 0.0023 | 1200 | 2006 Nov 16 | 10.83 | NLS1 |
| XSS J12106+3927 | NGC 4151 | 12 10 32.6 | 39 24 21 | 0.0033 | 1800 | 2006 Jan 29 | 11.5 | S1 |
| XSS J12164+1427 | PG 1211+143 | 12 14 17.7 | 14 03 13 | 0.081 | 3600 | 2006 Feb 04 | 14.63 | NLS1 |
| NGC 4253 | 12 18 26.5 | 29 48 46 | 0.01293 | 1200 | 2006 Dec 21 | 13.7 | S1.5 | |
| XSS J12206+7509 | MRK 205 | 12 21 44.0 | 75 18 38 | 0.07 | 2400 | 2007 Jan 27 | 14.5 | S1 |
| XSS J12288+0200 | 3C 273 | 12 29 06.7 | 02 03 08 | 0.15834 | 900 | 2006 Dec 21 | 12.86 | RLQ |
| XSS J12408-0516 | NGC 4593 | 12 39 39.4 | -05 20 39 | 0.009 | 1200 | 2007 Jan 26 | 14.67 | S1 |
| XSS J13420-1432 | NPM1G -14.0512 | 13 41 12.9 | -14 38 41 | 0.042 | 2400 | 2008 Mar 13 | 15.50 | NLS1 |
| XSS J13530+6916 | MRK 279 | 13 53 03.4 | 69 18 30 | 0.031 | 1200 | 2007 Feb 16 | 14.57 | S1 |
| XSS J14181+2514 | NGC 5548 | 14 17 59.5 | 25 08 12 | 0.017 | 1800 | 2008 Mar 03 | 13.3 | S1 |
| XSS J15042+1046 | MRK 841 | 15 04 01.2 | 10 26 16 | 0.036 | 1200 | 2007 Feb 16 | 14.0 | S1 |
| XSS J15348+5750 | MRK 290 | 15 35 52.3 | 57 54 09 | 0.030 | 2400 | 2008 Mar 13 | 15.1 | S1 |
| XSS J17276-1359 | PDS 456 | 17 28 19.8 | -14 15 56 | 0.184 | 1800 | 2007 Sep 07 | 14.69 | RQQ |
| XSS J17413+1851 | 4C +18.51 | 17 42 07.0 | 18 27 21 | 0.19 | 2400 | 2007 Sep 07 | 16.43 | RLQ |
| XSS J18196+6454 | H 1821+643 | 18 21 57.3 | 64 20 36 | 0.297 | 1800 | 2006 Aug 16 | 14.1 | RQQ |
| XSS J18348+3238 | 3C 382 | 18 35 02.1 | 32 41 50 | 0.059 | 1800 | 2006 Aug 16 | 15.5 | BLRG |
| XSS J18408+7947 | 3C 390.3 | 18 42 09.0 | 79 46 17 | 0.056 | 1800 | 2006 Aug 15 | 14.37 | BLRG |
| 1H 1934-063A | 19 37 33.0 | -06 13 05 | 0.01059 | 1800 | 2006 Aug 16 | 14.09 | S1 | |
| NGC 6814 | 19 42 40.6 | -10 19 25 | 0.00521 | 1800 | 2007 Nov 04 | 12.06 | S1.5 | |
| XSS J20404+7521 | 4C +74.26 | 20 42 37.3 | 75 08 02 | 0.1 | 1800 | 2006 Sep 15 | 15.13 | RLQ |
| XSS J20441-1042 | MRK 509 | 20 44 09.7 | -10 43 25 | 0.034 | 1800 | 2006 Sep 15 | 13.0 | S1 |
| XSS J21128+8216 | S5 2116+81 | 21 14 01.2 | 82 04 48 | 0.084 | 2400 | 2006 Aug 15 | 15.7 | BLRG |
| XSS J22423+2958 | AKN 564 | 22 42 39.3 | 29 43 31 | 0.025 | 1800 | 2006 Nov 15 | 14.55 | NLS1 |
| XSS J22539-1735 | MR 2251-178 | 22 54 05.8 | -17 34 55 | 0.064 | 1800 | 2006 Nov 15 | 14.36 | RQQ |
| XSS J23033+0858 | NGC 7469 | 23 03 15.6 | 08 52 26 | 0.016 | 1800 | 2006 Aug 15 | 13.0 | S1 |
| XSS J23040-0834 | MRK 926 | 23 04 43.5 | -08 41 09 | 0.047 | 1800 | 2007 Nov 03 | 14.6 | S1 |
| XSS J23073+0447 | PG 2304+042 | 23 07 02.9 | 04 32 57 | 0.042 | 2400 | 2007 Nov 02 | 15.44 | S1 |
| Name | RFe | FWHM(H) | ||||||||
|---|---|---|---|---|---|---|---|---|---|---|
| Å | Å | |||||||||
| (1) | (2) | (3) | (4) | (5) | (6) | (7) | (8) | (9) | (10) | (11) |
| XSSJ 00368+4557 | 82.6 | 0.35 | 42.1 | 2555 | 41.3 | 43.48 | 7.42 | 0.23 | ||
| QSO 0241+622 | 43.6 | 0.26 | 42.1 | 9401 | 41.8 | 44.34 | 44.28 | 8.54 | 0.02 | |
| 3C 111 | 119.9 | 0.00 | 43.3 | 3445 | 42.8 | 44.53 | 44.59 | 8.33 | 0.30 | |
| XSS J04331+0520 | 10.5 | 82.7 | 0.24 | 42.2 | 5367 | 42.1 | 44.16 | 8.11 | 0.06 | |
| XSS J05103+1640 | 9.0 | 74.5 | 41.3 | 4855 | 41.5 | 43.47 | 43.58 | 7.55 | 0.04 | |
| XSS J05162-0008 | 2.3 | 72.7 | 0.55 | 42.5 | 6595 | 41.5 | 44. | 44.26 | 8.48 | 0.05 |
| XSS J05552+4617 | 53.5 | 103.2 | 0.30 | 41.2 | 5761 | 41.7 | 43.56 | 43.67 | 7.60 | 0.02 |
| Mark 6 | 6.0 | 37.4 | 0.42 | 41.4 | 5627 | 41.7 | 43.32 | 43.41 | 7.74 | 0.03 |
| XSS J07434+4945 | 8.6 | 65.8 | 0.40 | 41.6 | 3815 | 41.7 | 43.45 | 7.47 | 0.07 | |
| XSS J08117+7600 | 74.7 | 0.52 | 43.4 | 3146 | 42.3 | 44.47 | 44.43 | 8.32 | 0.39 | |
| XSS J09204+1608 | 6.9 | 91.8 | 0.29 | 41.9 | 6421 | 41.6 | 43.65 | 8.11 | 0.03 | |
| XSS J09261+5204 | 118.6 | 0.08 | 42.1 | 1798 | 41.8 | 43.81 | 44.17 | 7.12 | 0.47 | |
| XSS J10231+1950 | 5.1 | 39.3 | 0.007 | 40.5 | 4556 | 40.6 | 42.4 | 42.67 | 7.01 | 0.02 |
| XSS J11067+7234 | 31.9 | 41.1 | 5020 | 40.7 | 43.04 | 7.46 | 0.03 | |||
| XSS J11417+5910 | 7.3 | 73.8 | 0.13 | 42.0 | 4608 | 41.9 | 43.82 | 7.91 | 0.07 | |
| XSS J12032+4424 | 21.5 | 0.61 | 39.9 | 1202 | 40.0 | 42.04 | 41.87 | 5.53 | 0.20 | |
| XSS J12106+3927 | 37.2 | 100.0 | 0.12 | 40.8 | 6354 | 41.3 | 43.17 | 43.37 | 7.49 | 0.01 |
| XSS J12164+1427 | 120.3 | 0.40 | 42.5 | 1804 | 41.7 | 44.22 | 7.32 | 0.60 | ||
| NGC 4253 | 11.3 | 32.1 | 0.72 | 40.8 | 2153 | 41.3 | 42.59 | 42.7 | 6.57 | 0.13 |
| XSS J12206+7509 | 95.6 | 0.21 | 42.5 | 3037 | 41.8 | 43.88 | 7.83 | 0.23 | ||
| XSS J12288+0200 | 71.3 | 0.51 | 44.1 | 2970 | 43.2 | 45.91 | 45.92 | 8.66 | 0.74 | |
| XSS J12408-0516 | 49.8 | 0.54 | 41.0 | 3654 | 40.4 | 42.57 | 43.04 | 7.12 | 0.05 | |
| XSS J13420-1432 | 15.3 | 64.6 | 0.66 | 41.8 | 4112 | 41.8 | 43.57 | 7.67 | 0.07 | |
| XSS J13530+6916 | 5.7 | 59.6 | 0.44 | 42.2 | 5147 | 41.8 | 43.94 | 8.07 | 0.06 | |
| XSS J14181+2514 | 7.8 | 62.7 | 0.04 | 41.3 | 10312 | 41.5 | 43.66 | 43.08 | 8.20 | 0.008 |
| XSS J15042+1046 | 9.4 | 129.6 | 0.33 | 42.5 | 5709 | 42.2 | 43.67 | 8.33 | 0.061 | |
| XSS J15348+5750 | 4.2 | 23.5 | 0.71 | 41.1 | 4740 | 41.6 | 43.43 | 7.41 | 0.03 | |
| XSS J17276-1359 | 74.6 | 3.58 | 44.1 | 2957 | 44.93 | 8.66 | 0.75 | |||
| XSS J17413+1851 | 1.8 | 115.5 | 0.04 | 43.0 | 13506 | 42.2 | 45.45 | 9.35 | 0.02 | |
| XSS J18196+6454 | 2.9 | 65.4 | 0.18 | 44.3 | 5797 | 43.7 | 45.61 | 9.36 | 0.23 | |
| XSS J18348+3238 | 111.4 | 0.19 | 42.8 | 8340 | 41.8 | 44.58 | 44.45 | 8.84 | 0.04 | |
| XSS J18408+7947 | 3.2 | 118.8 | 0.15 | 42.5 | 13799 | 42.0 | 44.39 | 44.61 | 9.13 | 0.01 |
| 1H 1934-063A | 55.2 | 0.94 | 41.1 | 1354 | 41.0 | 42.48 | 42.59 | 6.29 | 0.38 | |
| NGC 6814 | 38.8 | 0.75 | 40.2 | 5182 | 40.2 | 42.35 | 42.47 | 6.95 | 0.01 | |
| XSS J20404+7521 | 85.4 | 43.6 | 9418 | 42.5 | 44.73 | 44.98 | 9.37 | 0.05 | ||
| XSS J20441-1042 | 10.7 | 111.8 | 0.21 | 42.4 | 2261 | 42.1 | 44.2 | 44.13 | 7.47 | 0.36 |
| XSS J21128+8216 | 6.3 | 150.0 | 0.14 | 42.6 | 4123 | 42.3 | 44.25 | 44.65 | 8.12 | 0.13 |
| XSS J22423+2958 | 56.6 | 0.74 | 41.7 | 3649 | 41.7 | 43.42 | 7.52 | 0.09 | ||
| XSS J22539-1735 | 5.7 | 132.5 | 0.02 | 42.9 | 4093 | 42.6 | 44.63 | 44.62 | 8.28 | 0.16 |
| XSS J23033+0858 | 13.7 | 45.3 | 0.30 | 41.5 | 2819 | 41.6 | 43.27 | 43.40 | 7.17 | 0.12 |
| XSS J23040-0834 | 3.4 | 65.1 | 42.5 | 7083 | 42.2 | 44.23 | 44.21 | 8.51 | 0.04 | |
| XSS J23073+0447 | 2.7 | 42.0 | 41.2 | 7322 | 41.2 | 43.67 | 7.85 | 0.01 |