Galactic Parameters from Whole Sky 2MASS Star Counts
Abstract
The whole sky differential star counts (DSC) with 1 degree resolution are retrieved from 2MASS online data service. Galaxy with double exponential thin and thick disks and a single power law luminosity function (LF) is used to interpret the 2MASS data. The slope of the DSC appears roughly isotropic over the whole sky, the average value is , which corresponds to a power law index of the LF. We find that the scale-length and scale-height the thin disk are kpc and pc, and those of the thick disk are kpc and pc. The ratio of the thick disk to the thin disk is %. The location of Sun above the disk is pc. A comparison of the data and model and their discrepancy are also provided.
keywords:
Galaxy: general - Galaxy: stellar content - Galaxy: structure -infrared: stars1 Introduction
Star counts provides us a good way to investigate the structure of the Milky Way. In 1980 Bahcall & Soneira proposed a two component model, disk and halo, to interpret Galactic structure (Bahcall & Soneira 1980). However, in 1983 Gilmore & Reid identified the disk could be further divided into two parts, thin and thick, for better fitting (Gilmore & Reid 1983). Since then, many works based on different observations with limited or specific sky area have been carried out (Karaali et al. 2004) and indicate that the thick disk is an individual component. The scale-heights of the thin disk in these works are similar, ranging from 240 kpc to 350 kpc. However, the scale-height of the thick disk have a much larger range and tends to have smaller value with larger local stellar number density (Chen et al. 2001). The Two Micron All Survey, 2MASS (Skrutskie et al. 2006), provides an opportunity to use large sky coverage star counts to investigate the Galactic structure and more detail structures were recognized. The warp found on 2MASS is the same as that from gas and dust. Also, the scale-height of the thick disk increases with the Galactocentric radius for kpc (Cabrera-Lavers et al. 2007). However, the best model to describe the major smooth components, thin and thick disks, of the Milky Way has not been fixed yet.
In this contribution, we use the whole sky 2MASS point source catalog (hereafter, 2MASS PSC) to derive the overall structural parameters and the luminosity function of the Milky Way.
2 2MASS Point Source Catalog
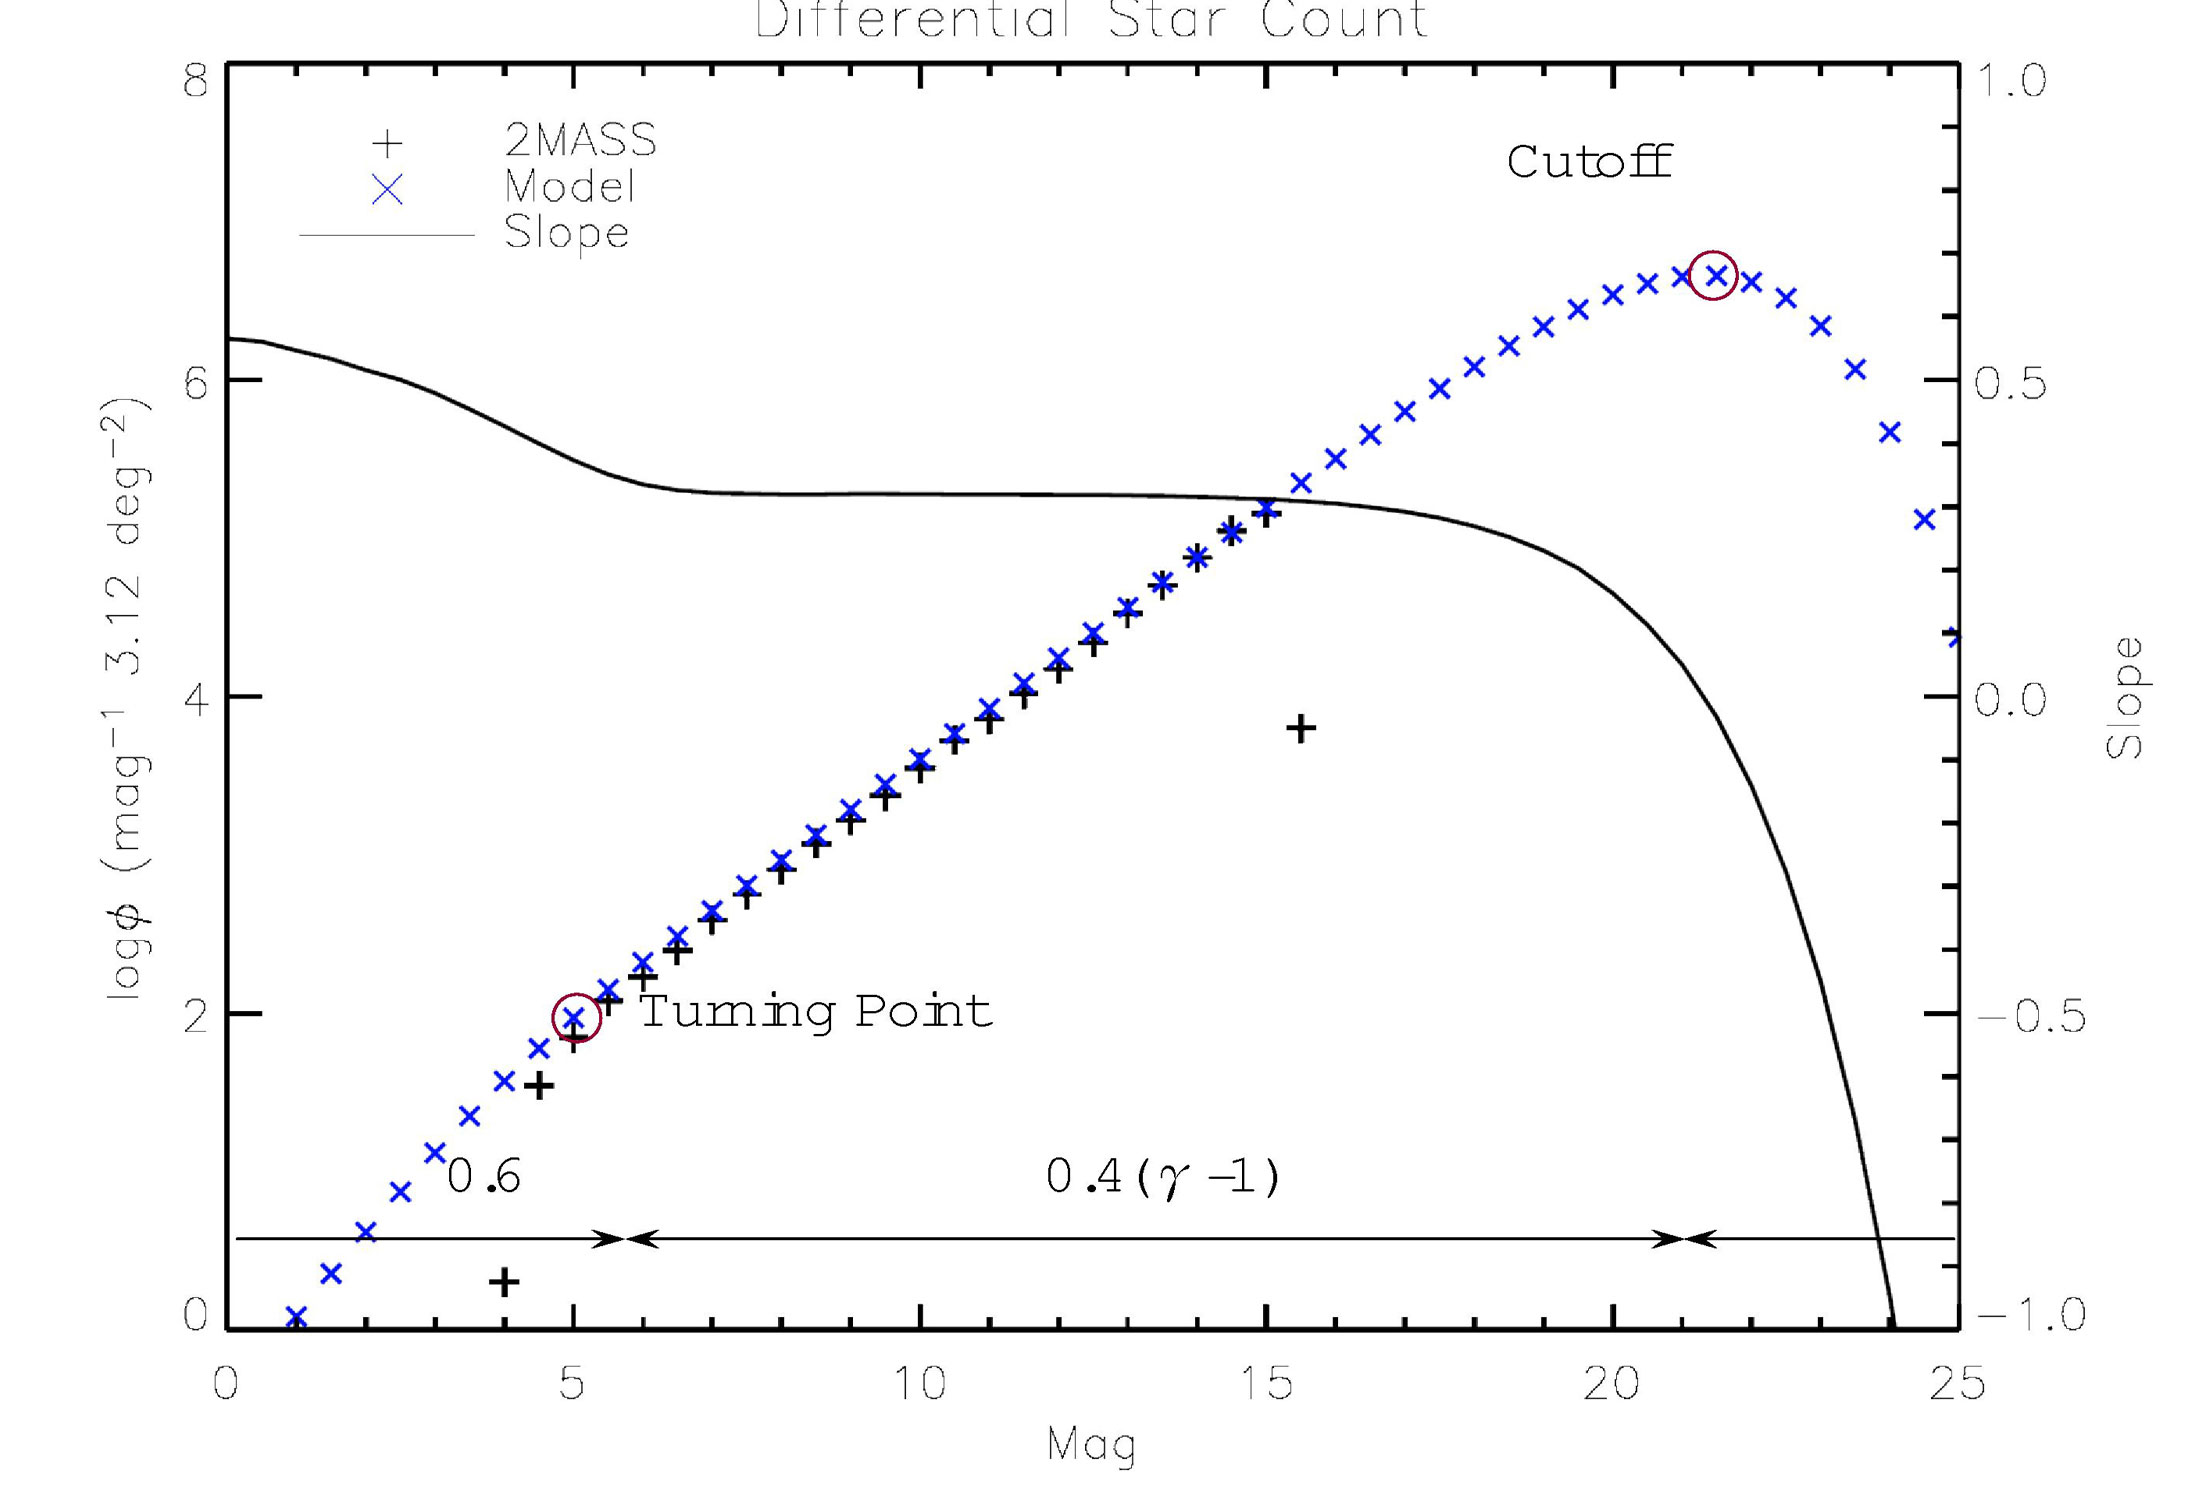
Sources with SNR and detected in all J, H, Ks bands were selected from 2MASS PSC. Its completeness rate corresponding SNR limiting magnitude is 99%. By Hierarchical Triangular Mesh, the whole sky is divided into 32768 nodes with degree resolution. The data was retrieved directly from 2MASS online data service via virtual observatory protocol. We only use Ks band data in this work. Due to the small number of stars brighter than 8 magnitude and incompleteness fainter than limiting magnitude, we analyze data between 8 to 14 Ks magnitude only. The differential star counts (hereafter DSC) is well approximated by a single power law in this region (see Fig.1 left).
3 The model and its features
Star count depends on the distribution of stars in space and luminosity, i.e., stellar number density profile of the Galaxy and local luminosity function. The density profile, , in our model contains a thin disk and a thick disk. Both are exponentially decayed along the Galactocentric radius, , and the distance above or below the Galactic plane, ,
| (1) |
where and are the scale-length and scale-height of the disk, is the local density in the solar neighborhood, and are the sun location. In our model the luminosity function (hereafter LF), , is a single power law, where , are lower and upper cutoffs. Moreover, we assume that the LF does not depend on location. The synthetic DSC can be divided into 3 regions, bright, modest and faint, with slopes 0.6, and a cutoff, respectively (See Fig.1 left). Therefore, we can derive from the slope in the modest region. Moreover, the turning point and cut off can be determined by , , and . The New COBR/IRAS extinction model (hereafter NCI model) was adapted for Galactic latitude area (Chen et al. 1999).
4 Results and Discussion
4.1 Luminosity Function
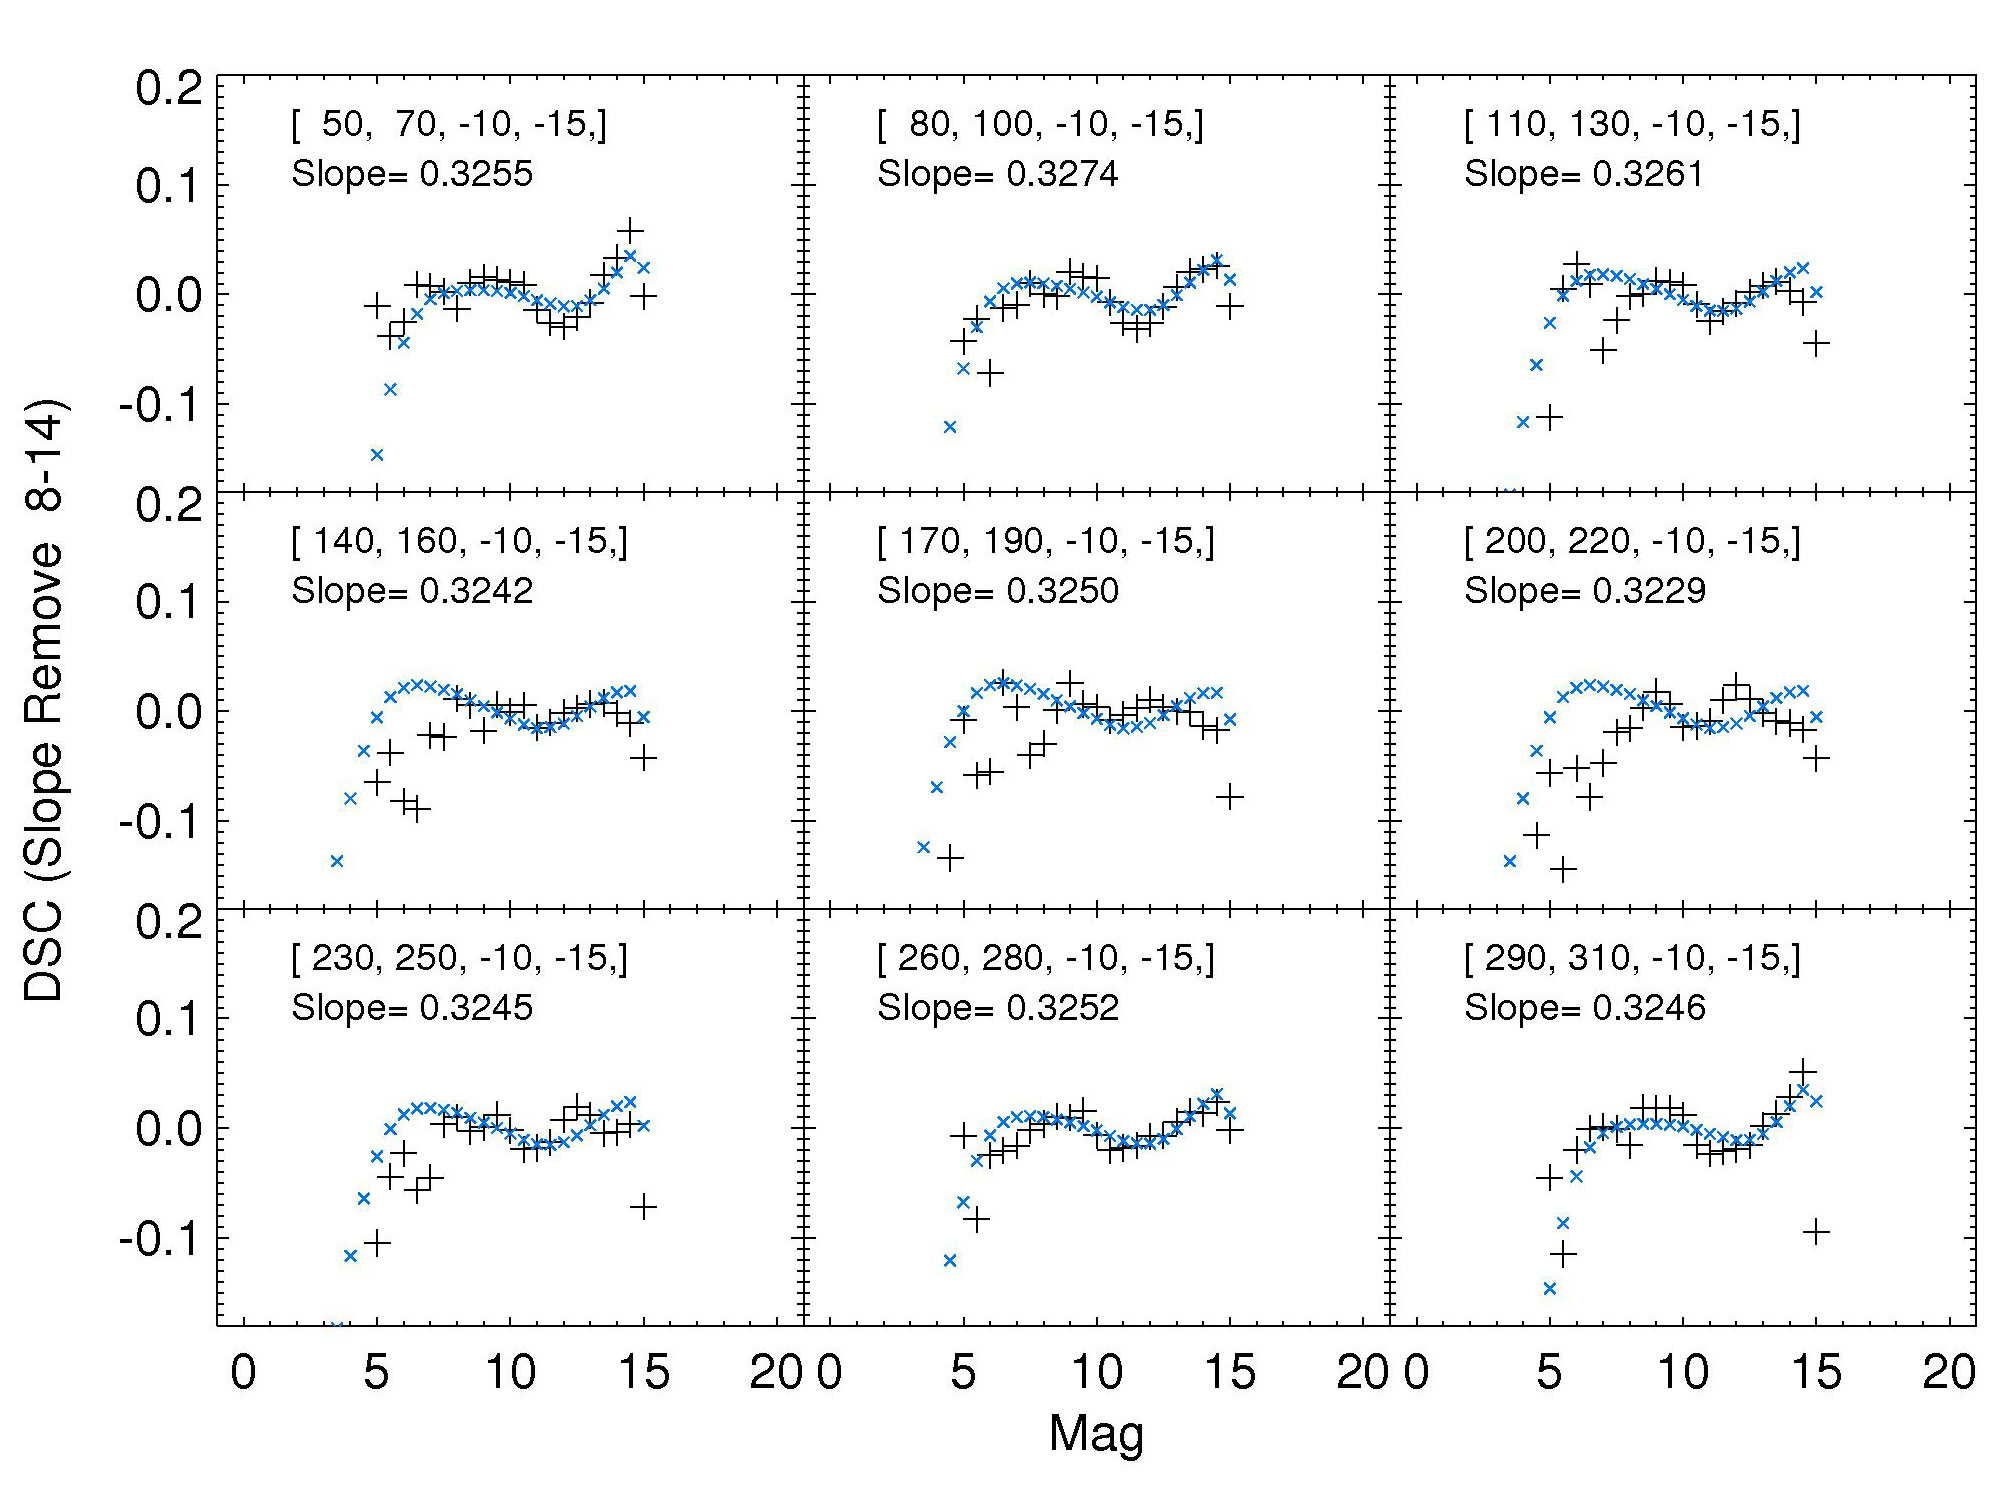
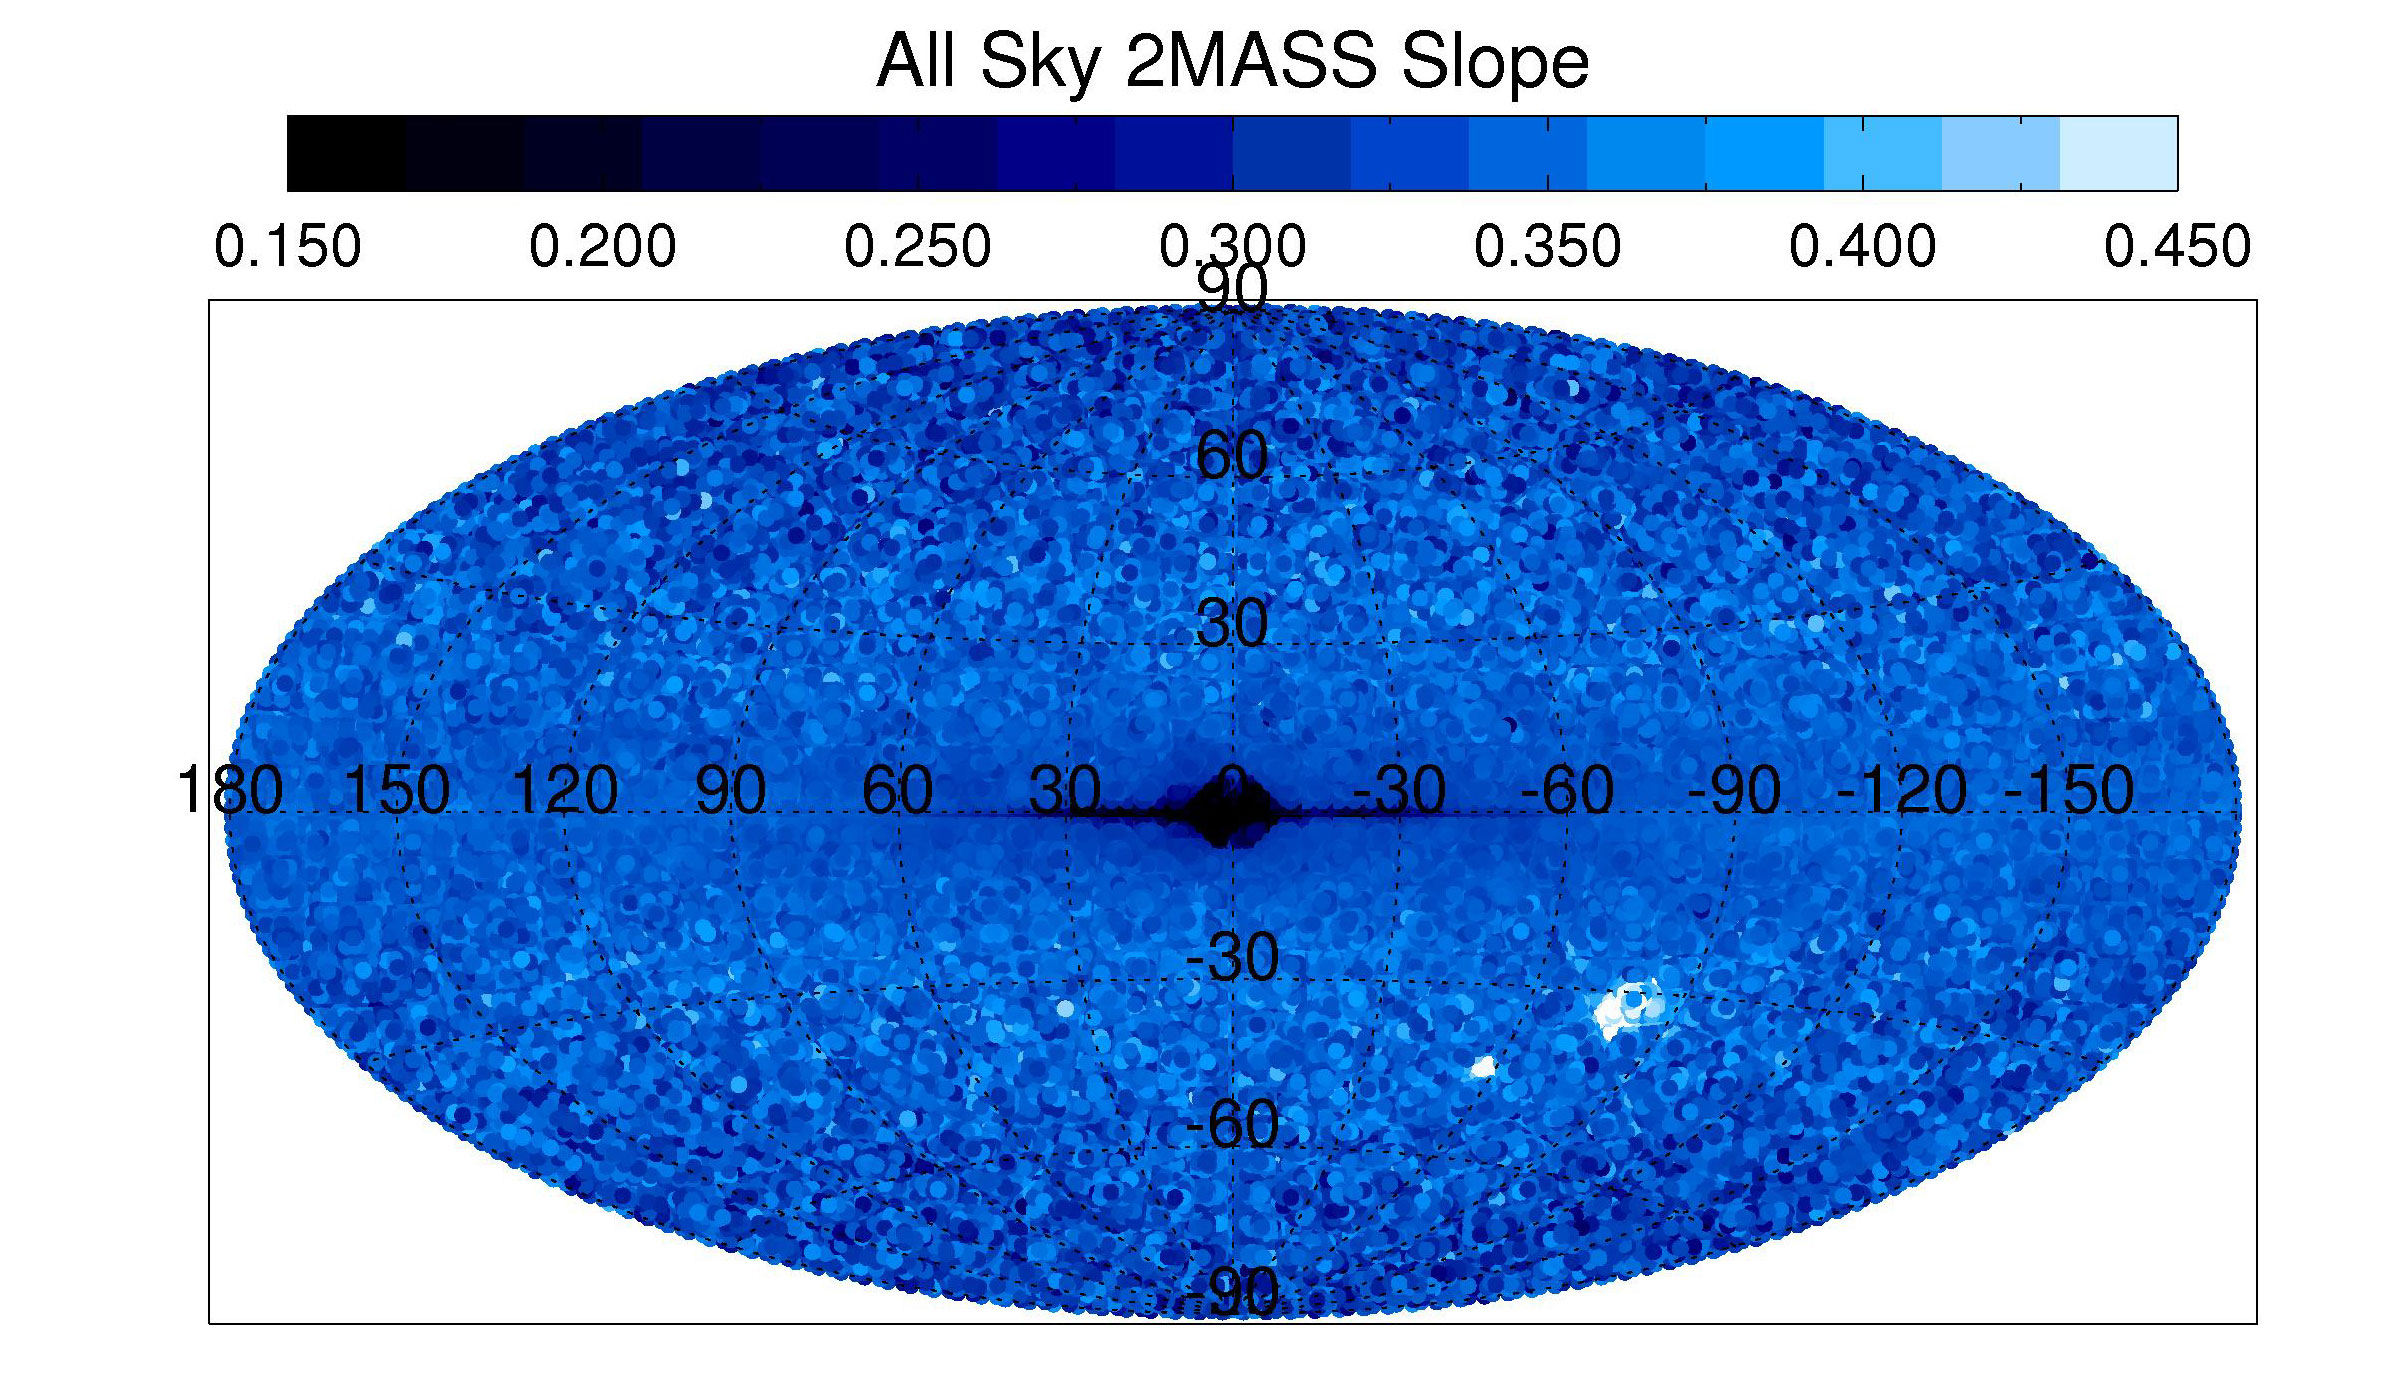
The differential star counts between magnitude 8 to 14 was used to derive the slope of the DSC of the whole sky. The slope seems roughly isotropic over the whole sky, and the average value is , and hence the power law index of the LF, (see Fig.2). If the slope is removed from the DSC, a small but significant dip appears (see Fig.1 right). Although the depth and width of the dip are hard to quantify, it can only be reproduced by some deficiency on the LF. We strongly believed that the dip is not caused by the fluctuation on density profile. In this case, the deficiency on LF can help us to quantify and , and vice versa. According to the derived and of the thin disk, the deficiency on the LF is located at Ks absolute magnitude.
4.2 Density Profile
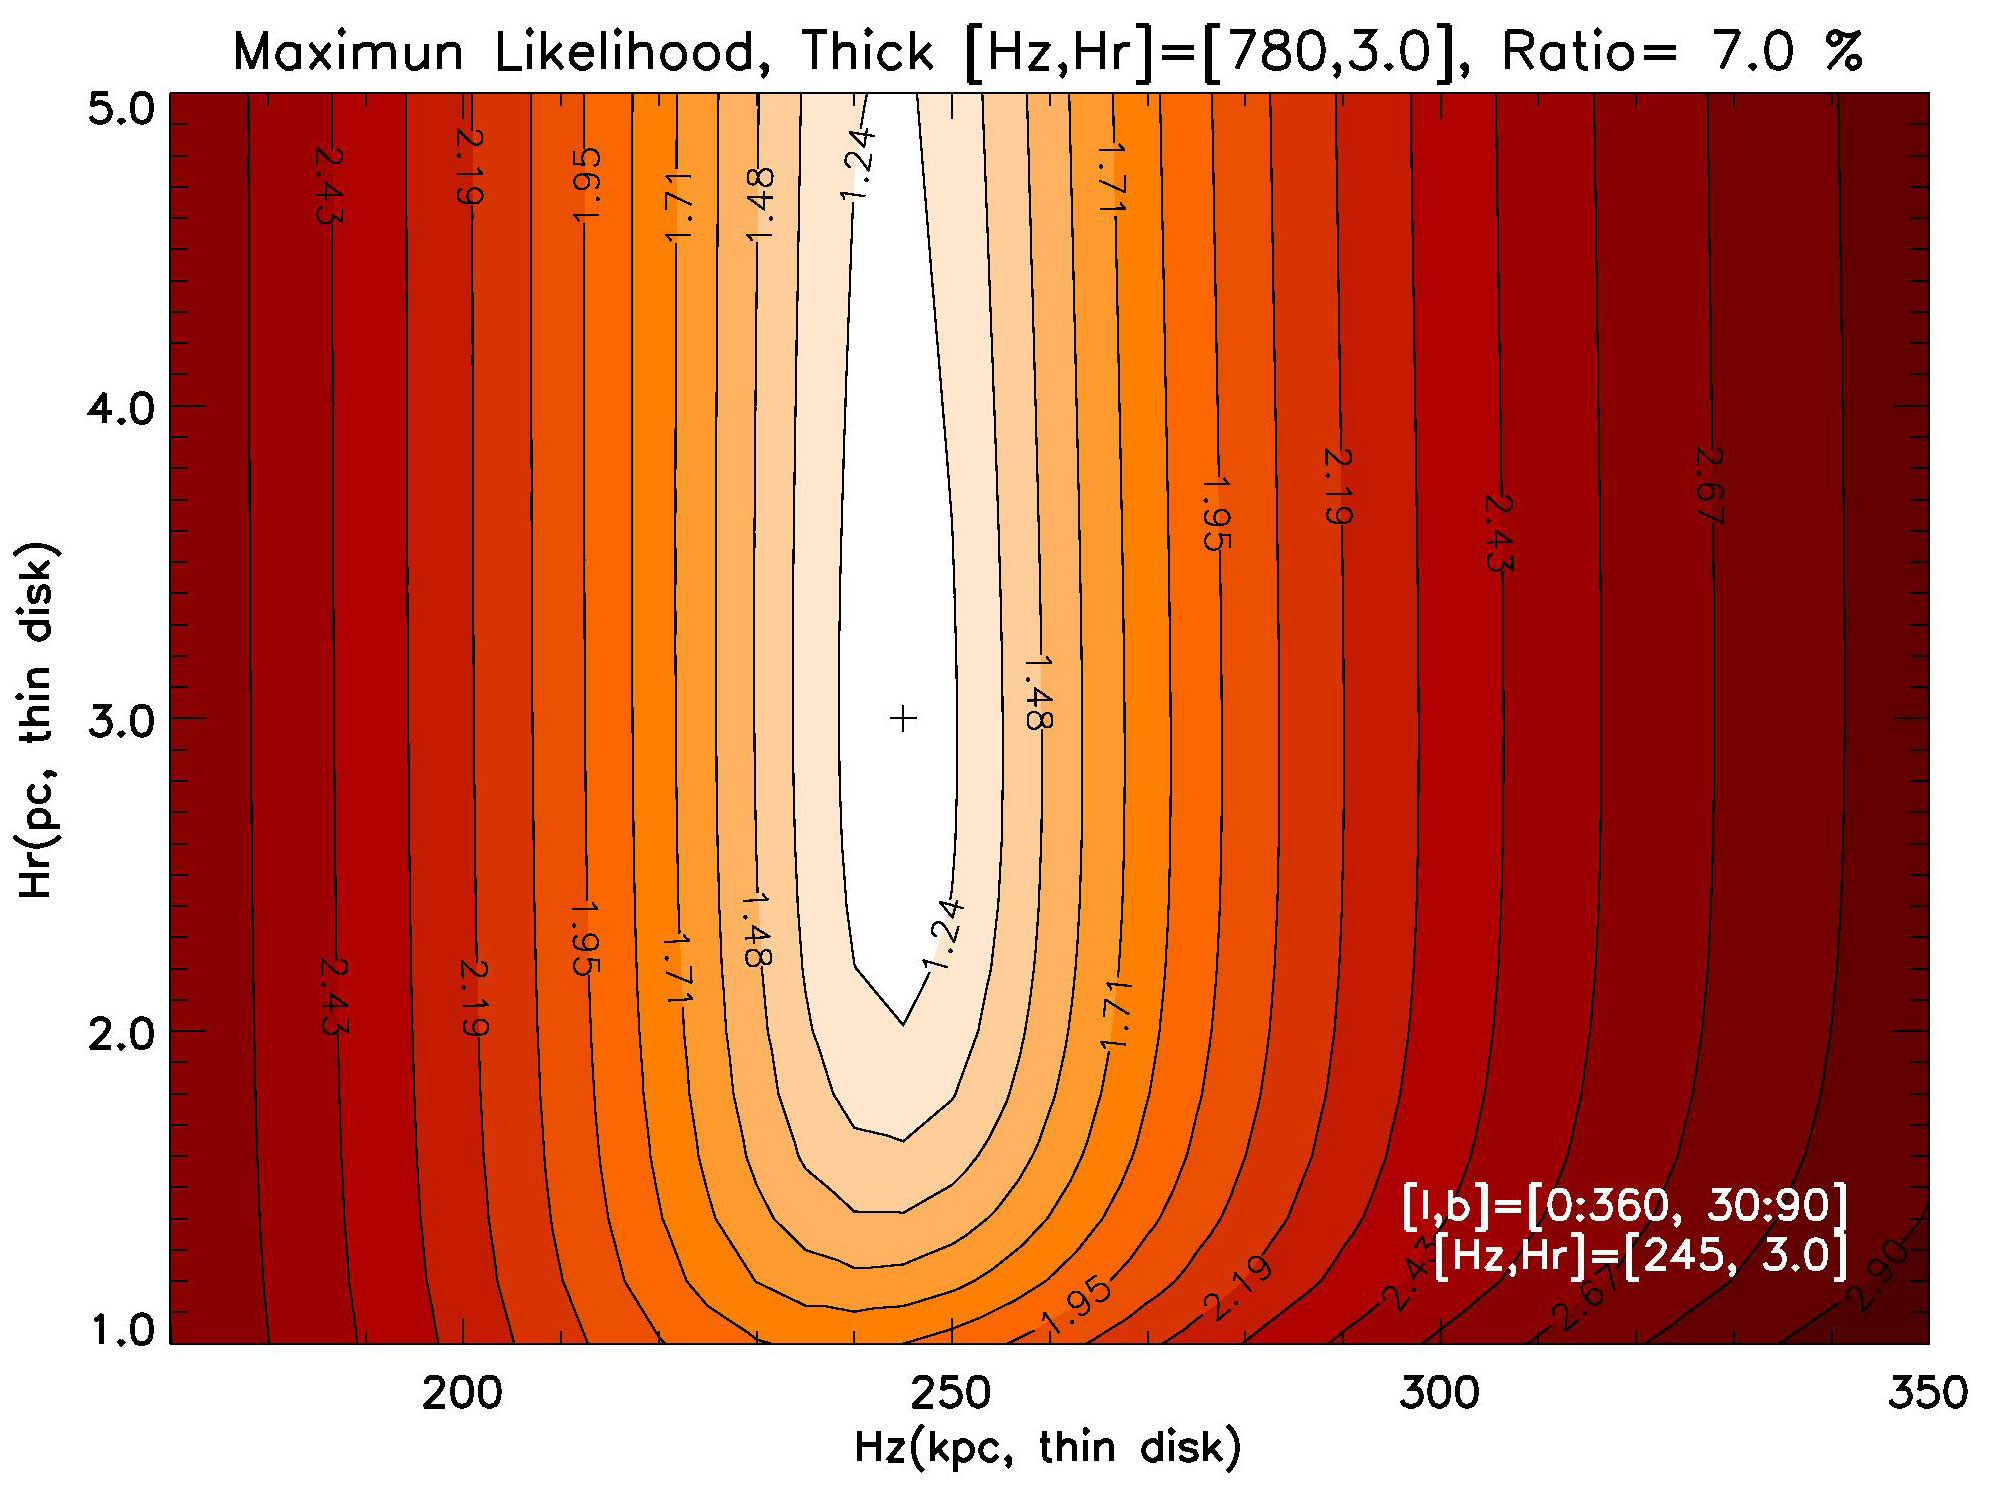
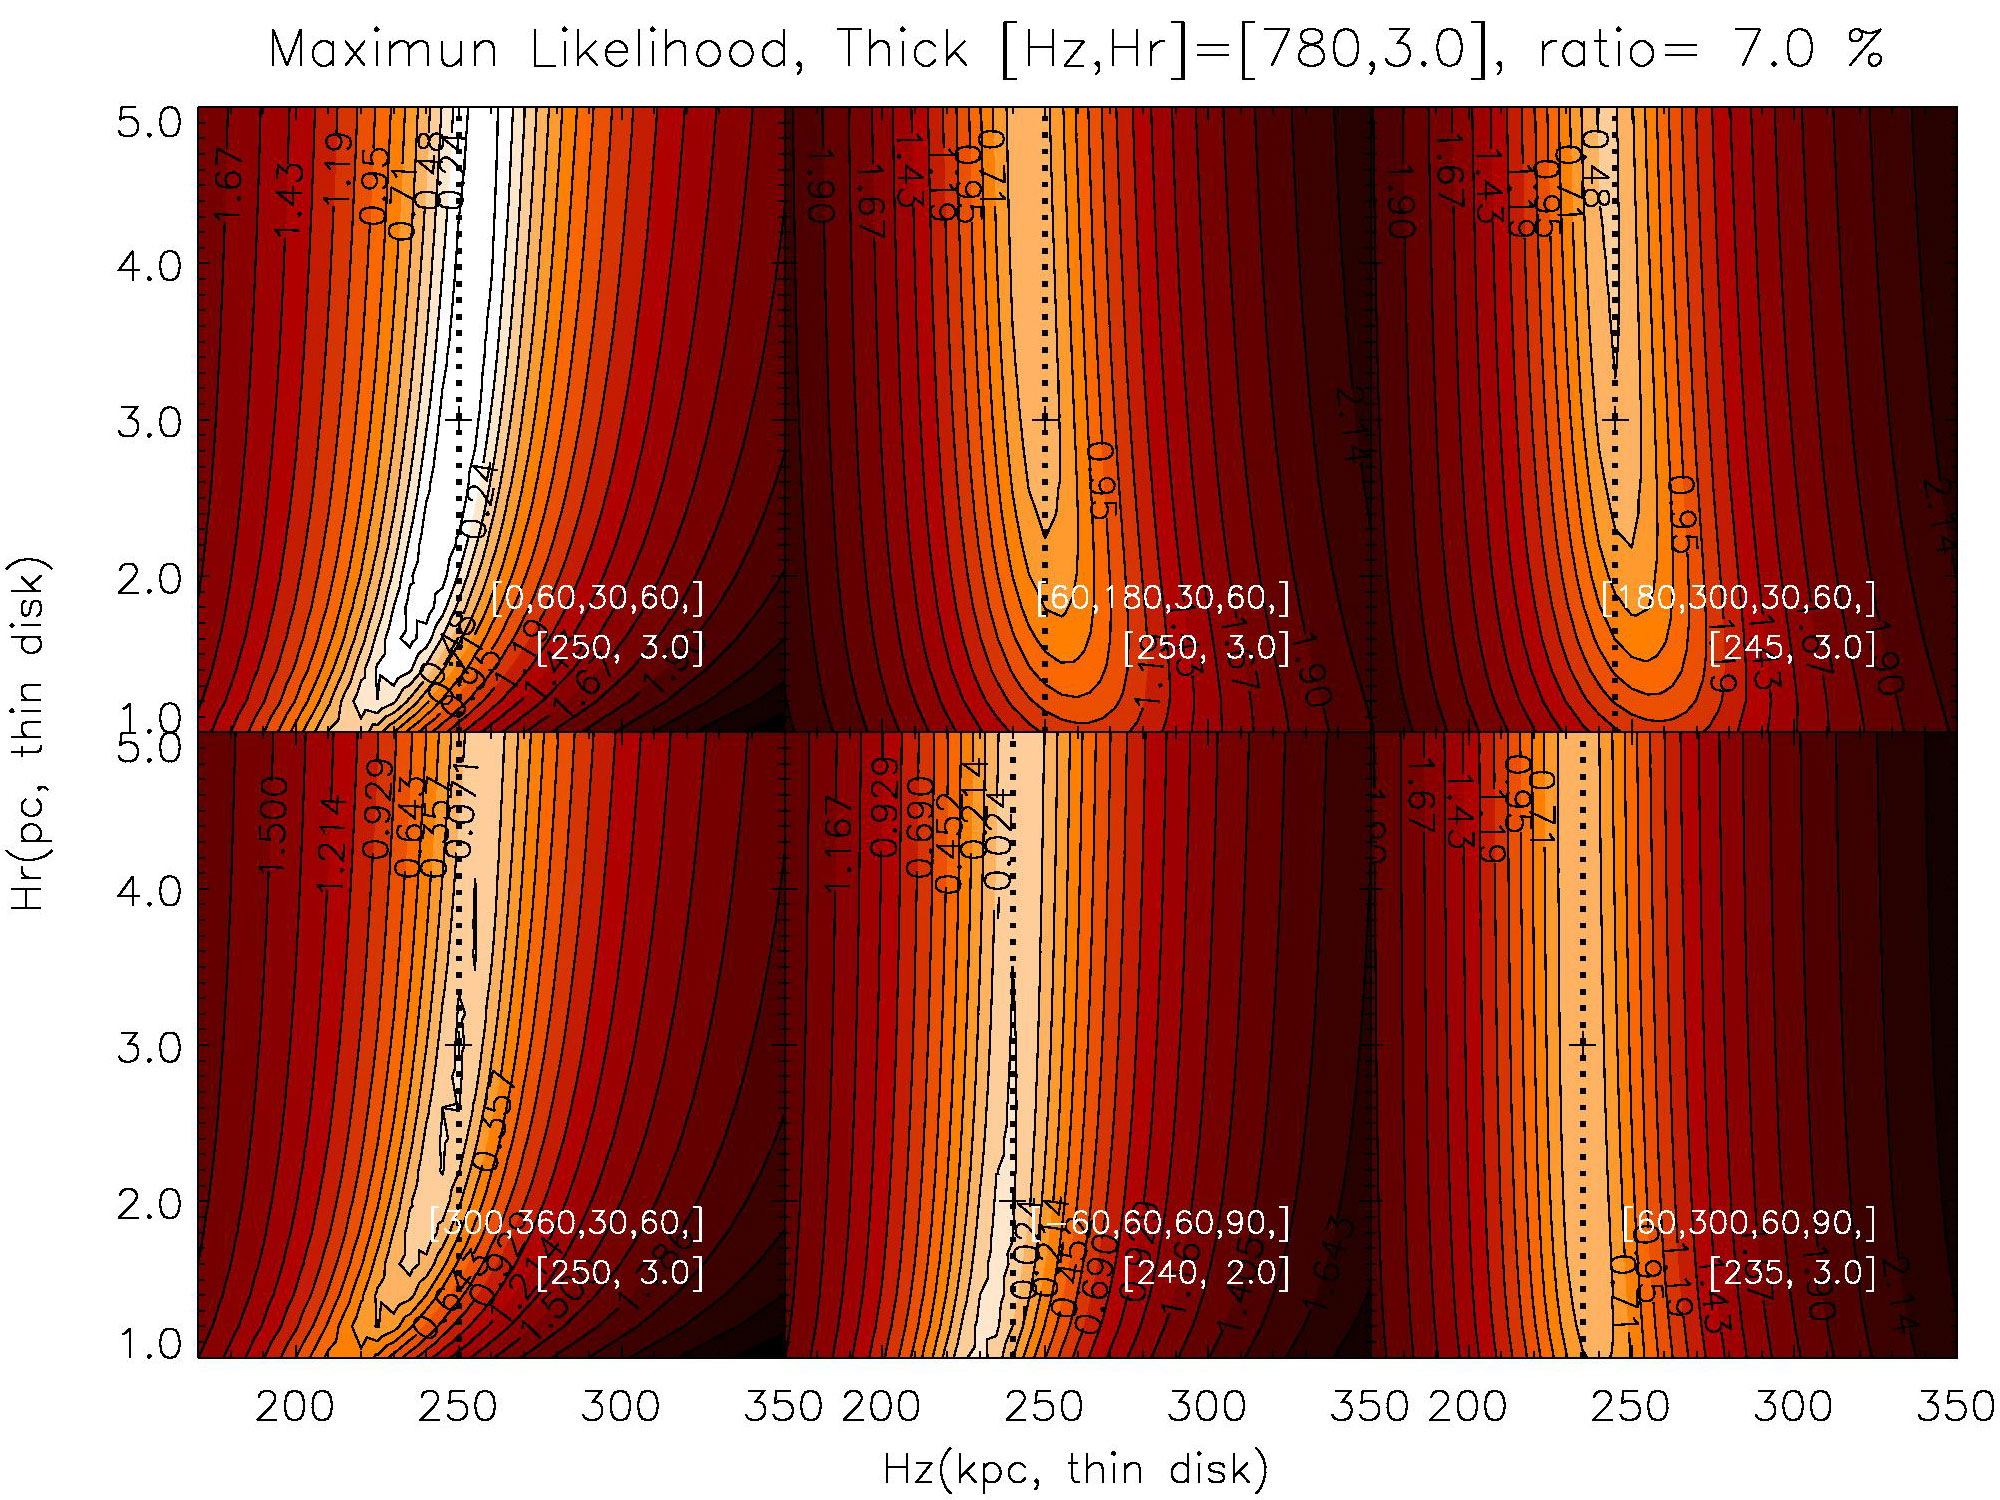
The method of maximum likelihood was applied to find the best fit and . In region with , the thin disk and are kpc, pc, and those of the thick disk are kpc, pc. The ratio of the thin to the thick disk is (see Fig.3). is derived from the number ratio of north to south Galaxy, and the value is pc.
4.3 Comparison Between Data and Model
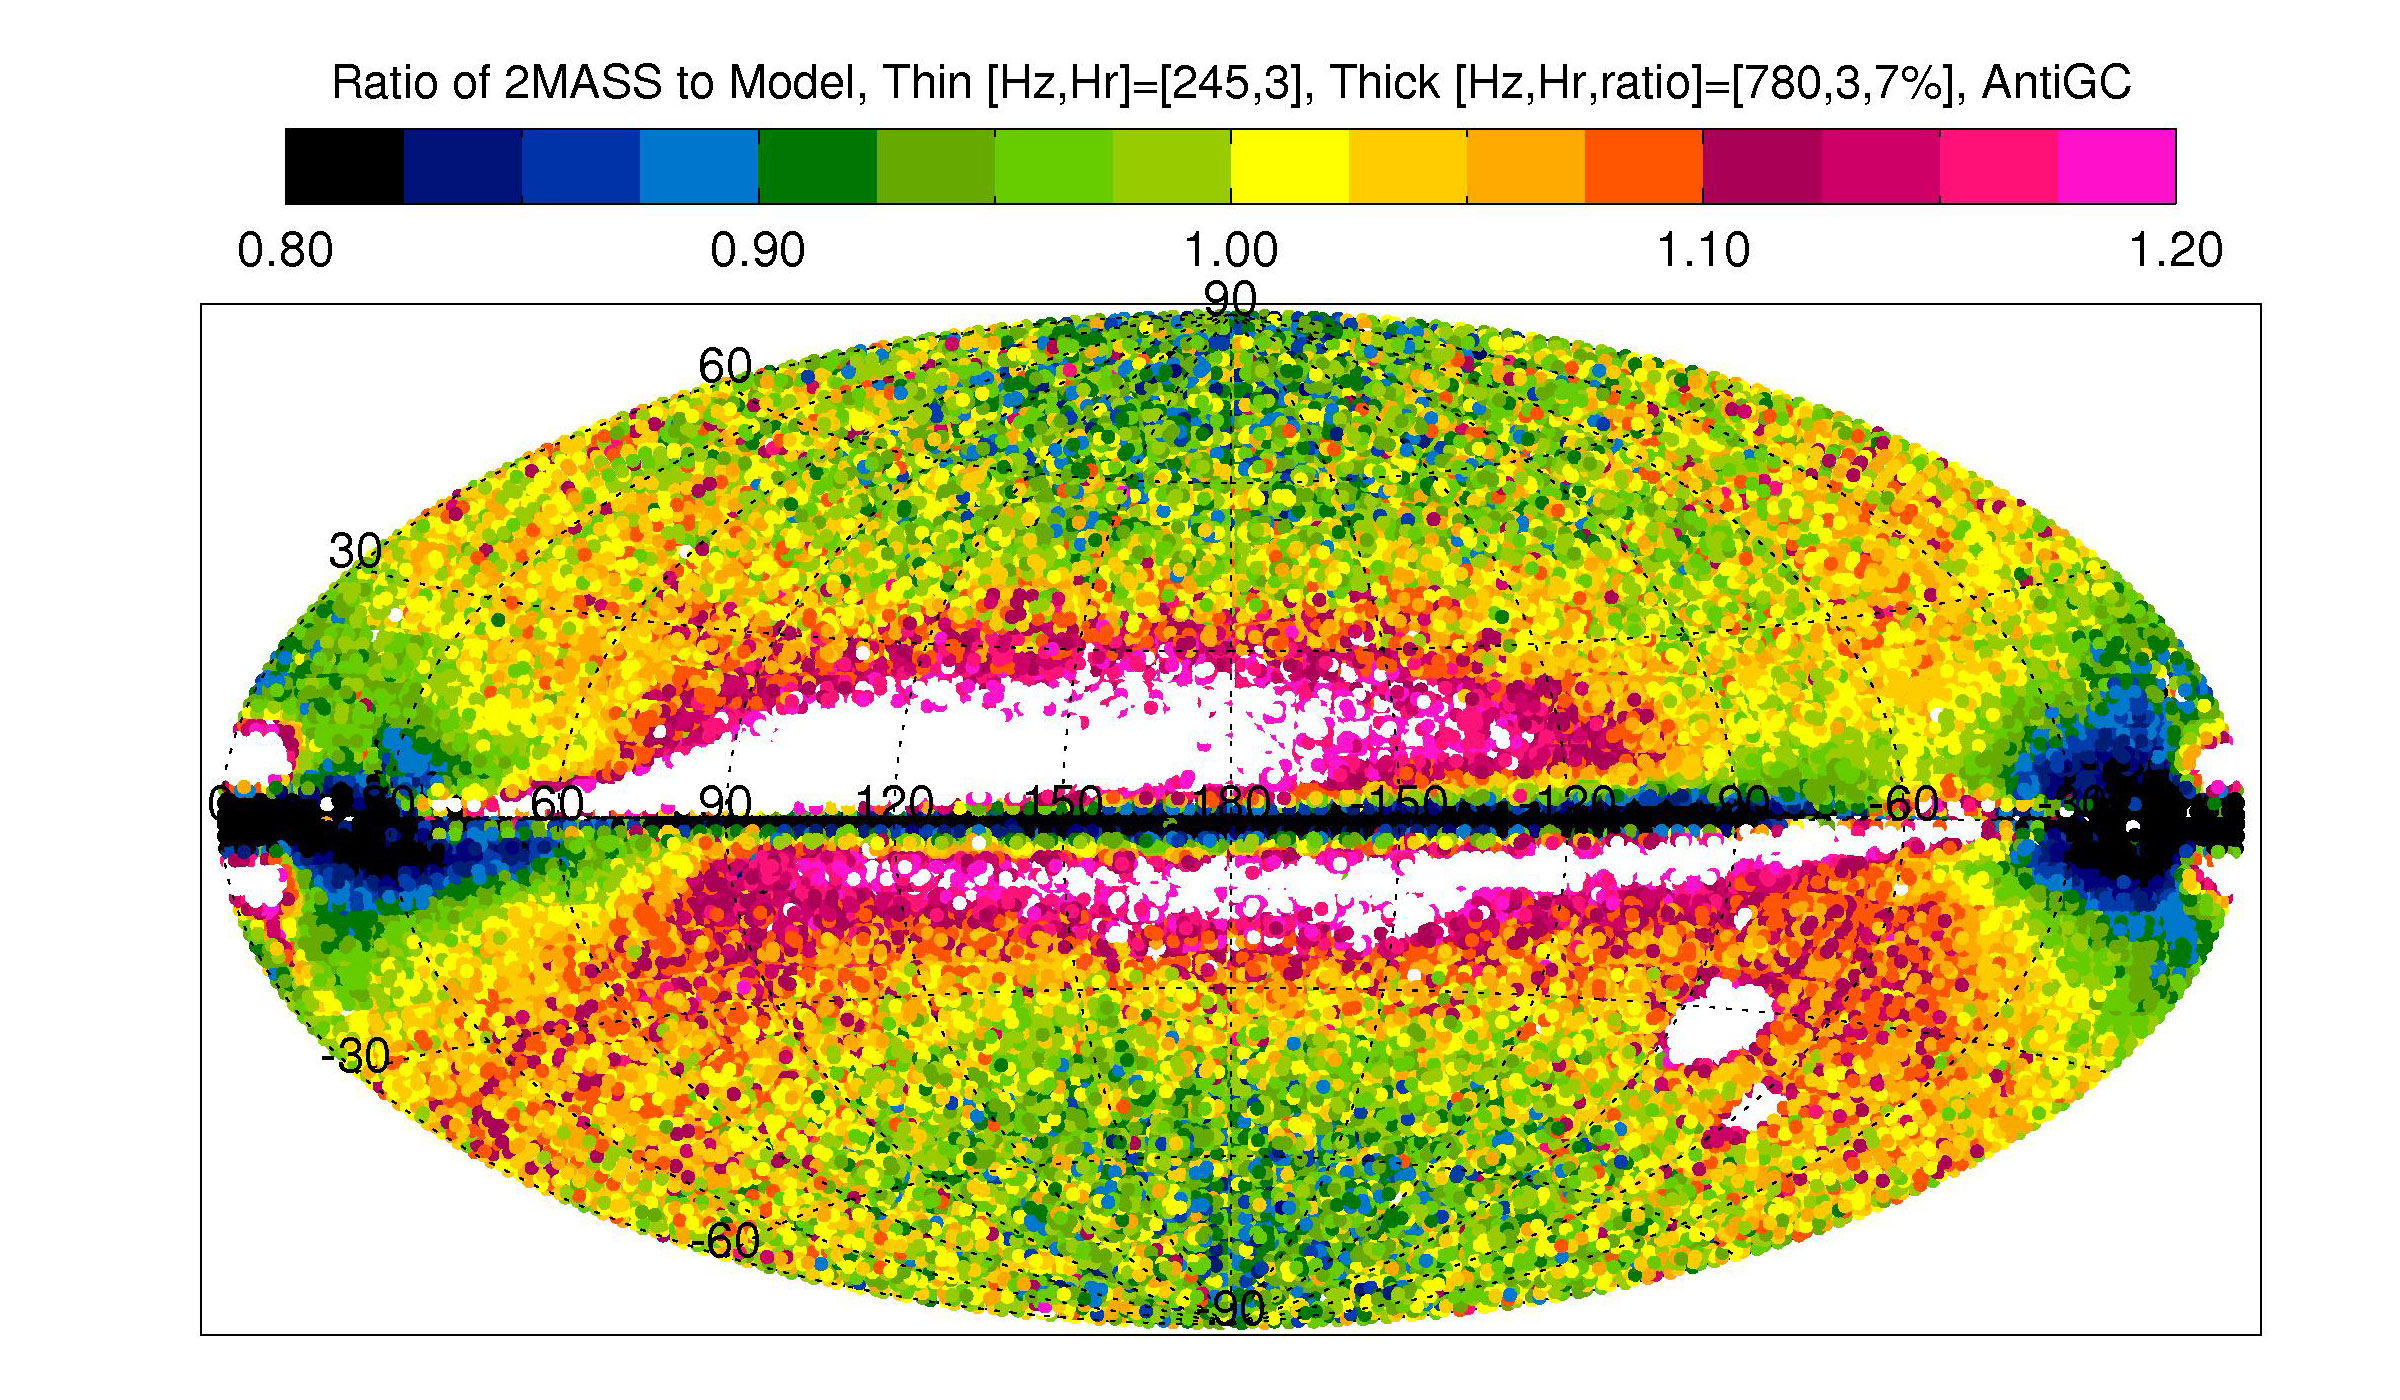
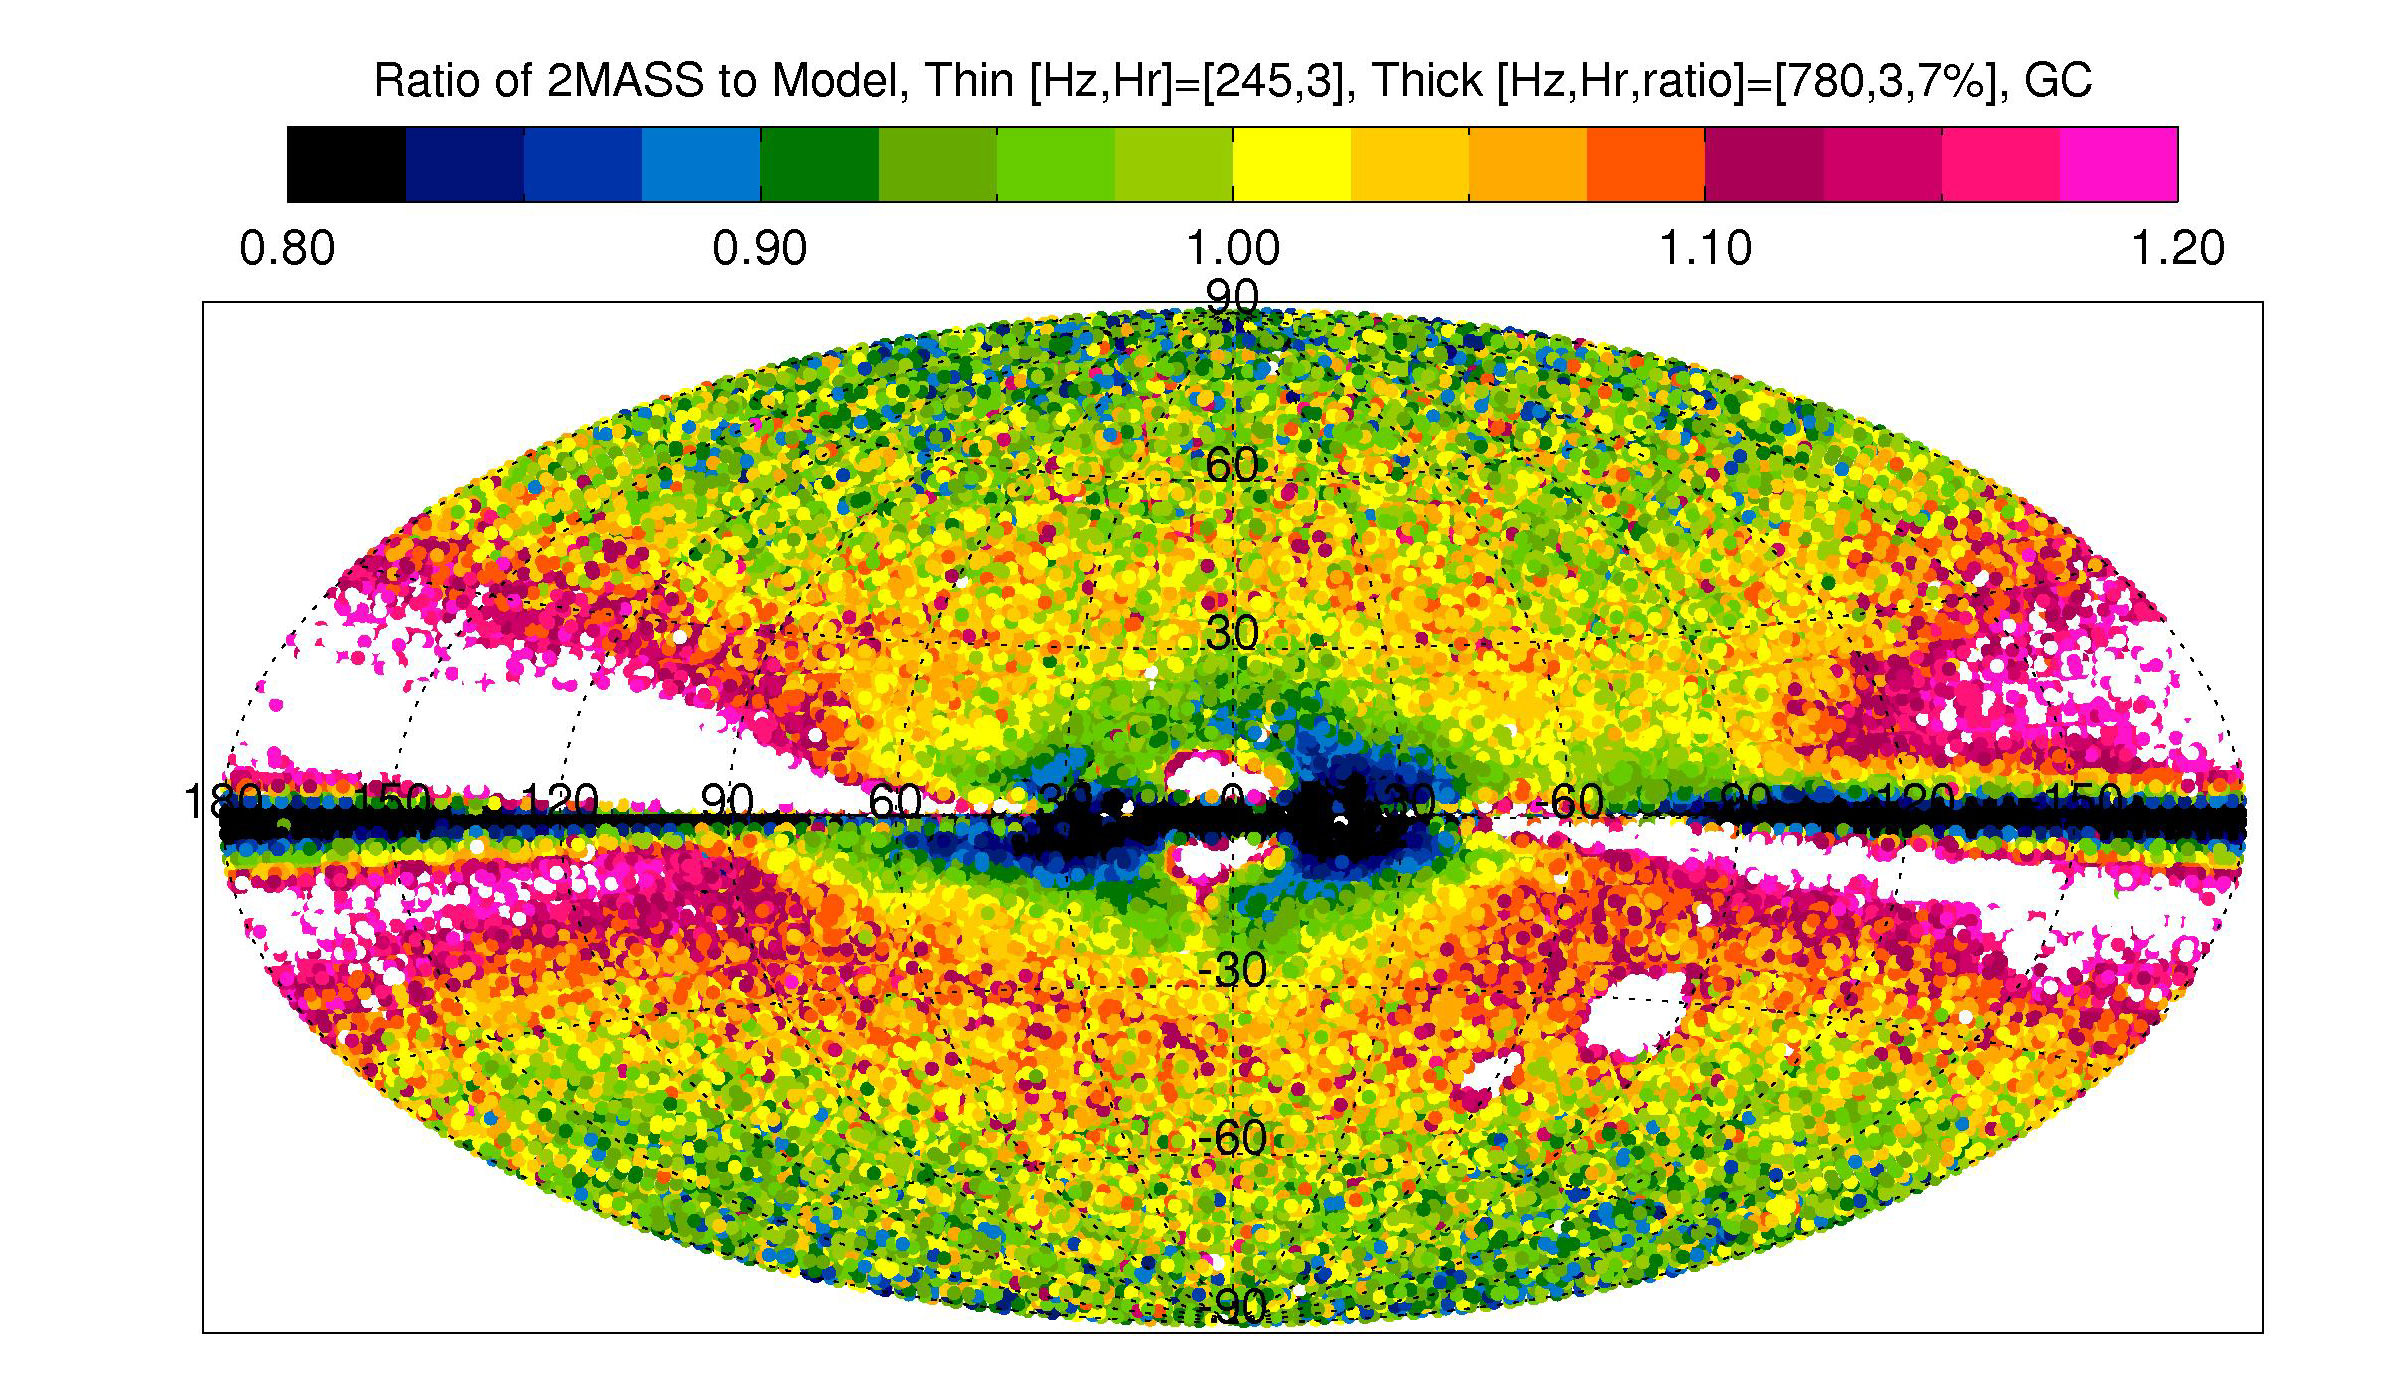
Fig.4 shows the number ratio of the 2MASS data to the model. Since we do not include the Galactic bulge in our model, there is an obvious discrepancy at the Galactic center. Our model generates less star in the high latitude area. This discrepancy can not be explained away by adding thick disk in our model. In addition, there is another discrepancy in the anti-GC direction. It might be a result of a warp or an increasing with Galactocentric radius (Cabrera-Lavers et al. 2007). The NCI model has large uncertainty in low Galactic latitude area, therefore our model produces unreasonably large star number in these areas. If we believe that stellar distribution on the disk is smooth, the star count can constrain the extinction model.
Acknowledgment
This work is supported in part by NSC96-2112-M-008-014-MY3. The authors thank Japanese Virtual Observatory for technical help.
References
- Bahcall & Soneira (1980) Bahcall J.N., Soneira R.M., 1980, ApJS, 47, 357
- Cabrera-Lavers et al. (2007) Cabrera-Lavers A. et al., 2007, A&A, 464, 565
- Chen et al. (2001) Chen B. et al. (the SDSS collaboration), 2001, ApJ, 553, 184
- Chen et al. (1999) Chen B. et al., 1999, A&A, 352, 459
- Gilmore & Reid (1983) Gilmore G., Reid N., 1983, MNRAS, 202, 1025
- Karaali et al. (2004) Karaali S., Bilir S., Hamzaoglu E., 2004, MNRAS, 335, 307
- Skrutskie et al. (2006) Skrutskie M. F. et al. 2006, AJ, 131, 1163